
peshkov
Introduction
As the name suggests, the Vanguard Total Stock Market ETF (NYSEARCA:VTI) is an investment product backed by the Vanguard Group, which seeks to provide access to US stocks across a broad market-cap spectrum. VTI does so by passively tracking the CRSP US Total Market Index, which essentially covers the entire landscape of investable US stocks, amounting to over 3500 stocks in total!
It’s fair to say that VTI is one of the more established names within the equity ETF (exchange-traded fund) terrain, with an AUM [assets under management] size of over $1.7 trillion and a listing history of almost a quarter-century (it began trading on May 24, 2001). Incidentally, that sizable AUM figure would also put VTI in the haloed club of the largest ETFs in the world, while also making it the preeminent name in the category of ETFs that focus on the “total market”.
As noted earlier, because of its passively managed stature, VTI also boasts one of the lowest expense ratios in the business at just 0.03% (for context, the median expense ratio of all ETFs works out to around 0.5%). Investors who also like a bit of income, besides desiring capital appreciation of their portfolio, may be pleased to note a dividend yield of 1.29% (based on quarterly distributions, which are annualized) associated with this product.
What Does The Vanguard Total Stock Market Index Fund Do?
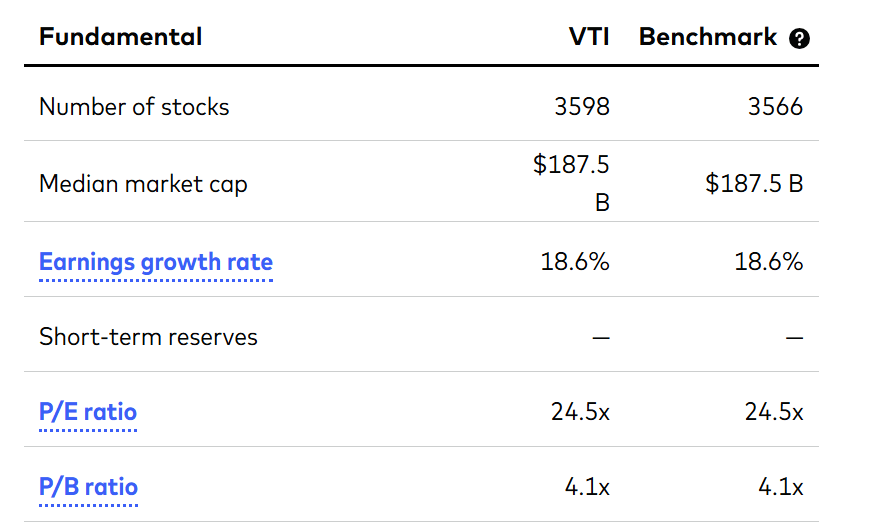
VTI’s remit is to passively track the CRSP US Total Market Index, which it accomplishes through an index-sampling strategy. What this means is that, rather than pursuing every single stock that the index tracks (and in the same proportion), VTI only holds a sample of stocks, which in aggregate end up closely mirroring the overall features of the index. By features, we mean similar industry weighting (as the benchmark), similar threshold of market capitalization, similar P/E profiles, similar dividend yields, etc.
Interestingly enough, VTI covers a slightly larger pool of stocks (32 more stocks) than its benchmark, but what’s key to note is that the market-cap texture, the earnings texture, and the valuation texture (be it on a trailing price-to-earnings ratio or a trailing price-to-book value ratio) are all identical.
Vanguard
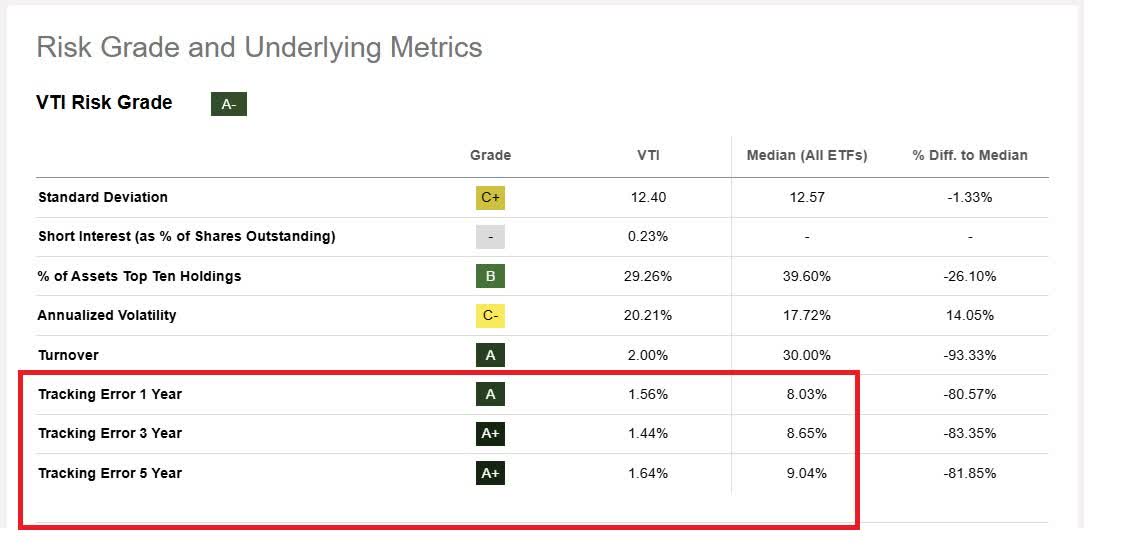
VTI’s ability to closely reflect the CRSP US Total Market Index—despite covering a larger pool of stocks—can also be validated by the rather low tracking error over time. What does this mean?
Well, this metric gives investors a sense of the variability in the returns of the ETF and the benchmark it tracks. Naturally, a higher number reflects the inadequacies of the ETF in effectively tracking its benchmark. In VTI’s case, the tracking error has worked out to only around 1.4-1.7% across different time frames, a lot lower than the 8-9% threshold witnessed by other ETFs.
Seeking Alpha
Coming back to the CRSP US Total Market Index, note that it doesn’t just cover the common stocks of various businesses but also those structured as REITs (Real Estate Investment Trusts). This index also doesn’t stick to stock sourcing from just one exchange, but quite a few prominent ones, including the NYSE, NYSE American, NYSE Arca, Nasdaq, and CBOE BZX.
What Are The Dominant Components Of VTI?
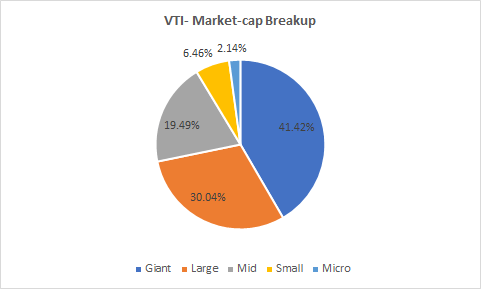
Prima facie, considering the number of stocks that it covers (close to 3600), VTI may come across as a product with great reach, giving you a healthy dose of giant caps, large caps, mid caps, and small caps, but the reality is quite different, with the onus largely on just a few pockets in particular.
Given that the benchmark index is essentially a free-float market cap weighted product (which means the largest stocks based on the market cap garner a higher weight in the portfolio), at the end of the day, this is still very much a product meant for those largely interested in giant and large caps, with a sprinkling of small-cap exposure (mid-cap exposure is reasonable at around 20%). To elaborate, close to 72% of the portfolio comprises giant and large-cap US stocks, with the average market cap of this portfolio ($197.8B) very much reiterating the giant-cap tilt.
Morningstar
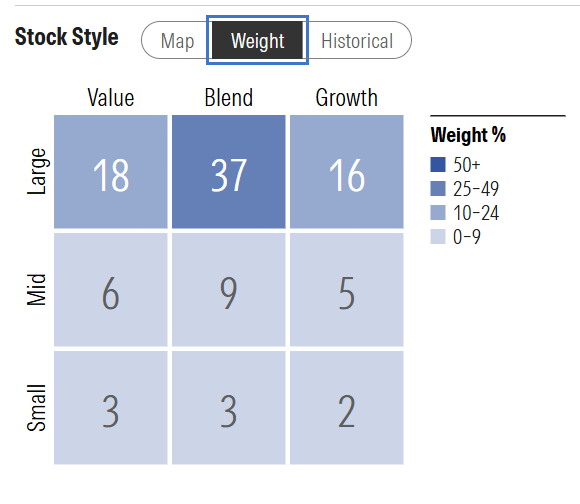
On the style front, though, VTI does come across as a more balanced fit, offering a nice mixture of stocks with both growth and value characteristics (the blended component dominates, accounting for 37% of the total portfolio). This balance could prove to be useful in weathering different cyclical hues; when risk sentiment is on the up and economic prospects look rosy, the growth component of VTI could flourish; in contrast, when things turn awry at the top and investors start fishing for value and stocks with useful income profiles, the value component of this portfolio could start chipping in with greater fervor.
Morningstar
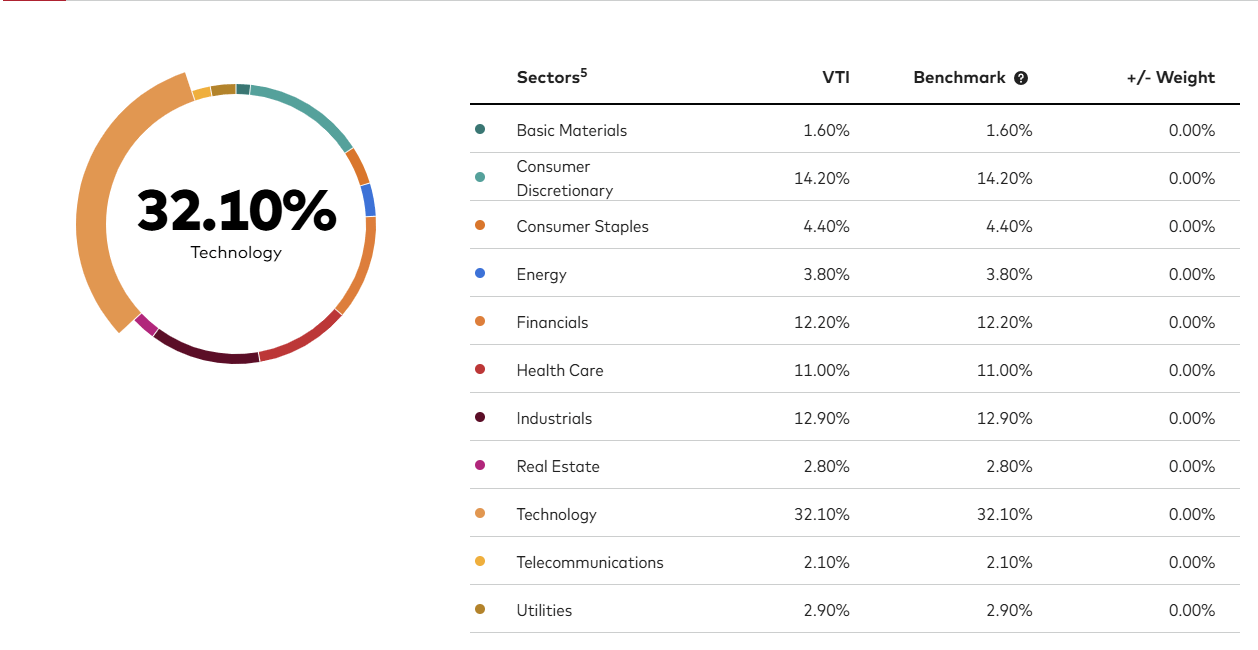
One could also argue that VTI is over-indexed to the technology sector, as it accounts for almost one-third of the total holdings (besides, the top 3 stocks belong to this sector) and is comfortably more than twice as much as the next largest sector—consumer discretionary (which has a weighting of around 14%). Even if this portfolio gets rebalanced (which happens every quarter), the technology sector is still expected to dominate, given the free-float market-cap weighted methodology employed here and the typically elevated market-cap of large-cap technology stocks.
Vanguard
Who Is VTI For?
One of the comforting facets of VTI is that it doesn’t come across as a very esoteric product that only a certain cohort of the broad investor base will gravitate to. Given its healthy mix of growth and value stocks and coverage across different market caps (even if small-cap exposure isn’t hugely meaningful, it is still something and better than the VOO ETF, the largest ETF by AUM in the world that tracks the S&P 500 and offers no exposure to small caps whatsoever), it has the potential of attracting different breeds of investors.
Its cheap expense ratio also makes it very accessible for long-term investors, particularly those who resort to dollar cost averaging on a frequent basis. Say one invests $1,000 every month in VTI; one would only lose 30 cents a month towards this initiative.
VTI is also meant for those seeking some stability in their portfolios. Since VTI passively tracks the CRSP US Total Market Index, it is not prone to a great degree of churn on an annual basis. To highlight, over the past four years, its annual turnover ratio has worked out to just 2% (in contrast, most ETFs witness an annual turnover of around 15x more). What this means is that just a very miserly portion of the holdings have been replaced every year. This enables investors to profit from the prospect of these businesses across different cyclical swings of the US economy over time.
Another reason why we think VTI may attract long-term investors is that, in all its years of existence, equating to 287 months in total, the maximum drawdown (from a peak in price to a trough) it has incurred is just six months, which is very acceptable in the grand scheme of things.
A low turnover ratio will also appeal to those investors placing importance on greater tax efficiency, given the incidence of lower trading costs.
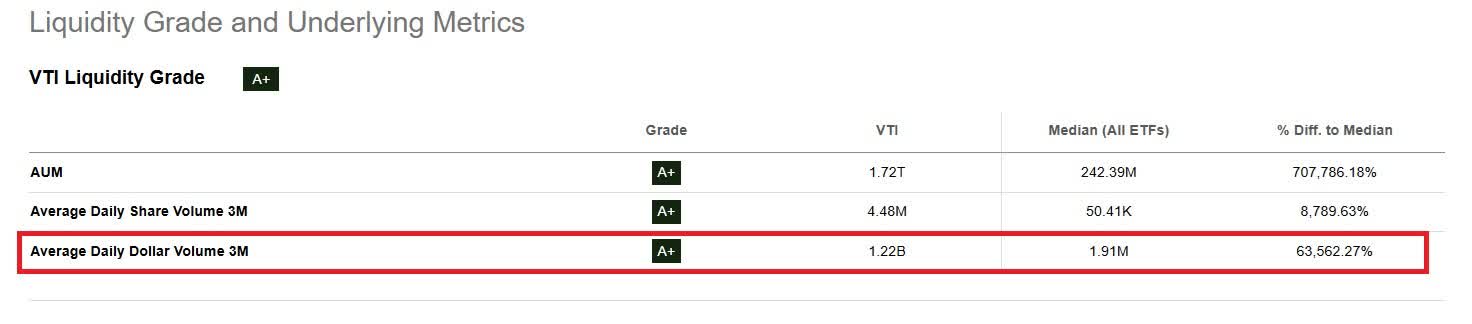
Also, while we wouldn’t necessarily hoist it up for market players looking to make short-term tactical bets on the market, those who are still looking to resort to that stance won’t be put off, given the high level of liquidity witnessed in this fund (at over $1.2B, the dollar volumes seen in VTI’s ticker every day are over 600x higher than what the standard ETF sees per day).
Seeking Alpha
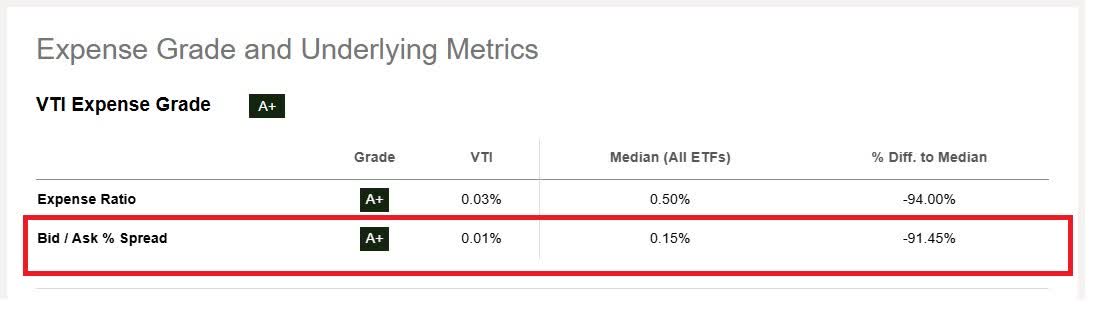
High liquidity will also translate to a very narrow difference between the average bid and the ask. At an average spread of just 0.01% (for most ETFs, the average difference between the bid and the ask works out to 0.15%), the chances of investors not getting a fill at their desired price are extremely low.
Seeking Alpha
However, despite its tradability quotient, what we’ve observed is that VTI doesn’t quite manage to catch the fancy of short-sellers, as exemplified by a low short interest of just 0.23% (of VTI’s total shares outstanding).
What Are The Risks?
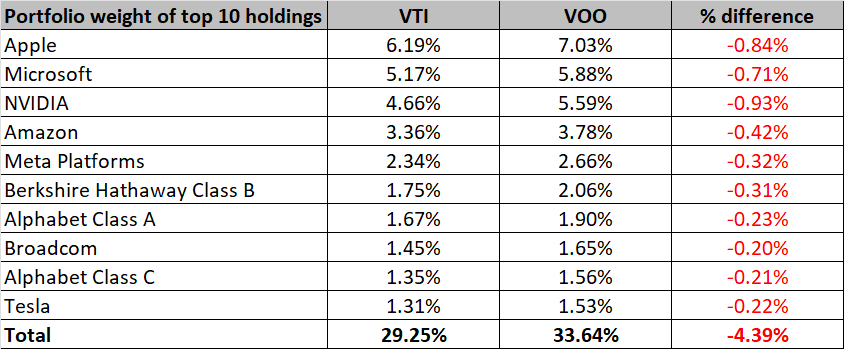
One may question if VTI will be in a position to flourish if its top-10 holdings underperform, since just these 10 stocks alone account for close to 30% of the total portfolio. Some may argue that a top 10 weight of less than 30% isn’t hugely concerning, but do keep in mind that this is a portfolio that covers almost 3600 stocks, so that would also suggest that quite a few stocks at the lower end of the ladder are largely just making up the numbers without contributing a great deal to overall returns and risk-adjusted returns.
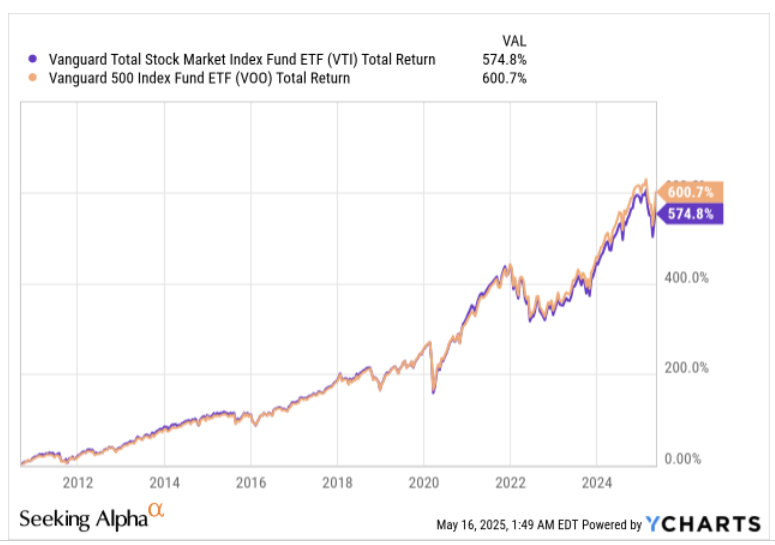
To better highlight this flaw, we can look at how VTI has performed over time versus the most popular ETF in the market—the Vanguard S&P 500 ETF (VOO). As implied by the name, VOO covers a smaller number of stocks (the 500 largest US companies) than VTI, but interestingly, both VOO and VTI cover the same top 10 stocks (albeit with marginally higher portfolio weights for the latter).
Morningstar
Despite strong similarities in the major holdings, VTI has underperformed VOO since the latter debuted in 2010.
YCharts
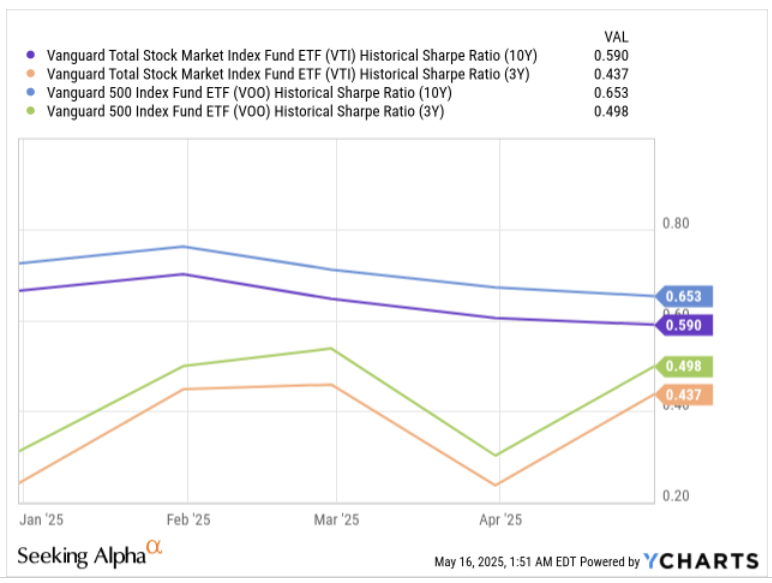
It also doesn’t appear that VTI has done a particularly great job of juggling its risk profile while attempting to generate higher returns than the risk-free rate. This can be captured by both the long- and short-term Sharpe ratios, where VTI has been lagging VOO.
YCharts
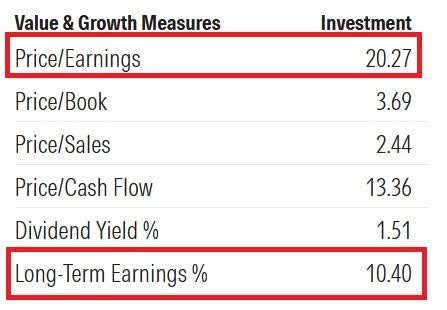
Value-conscious investors may also not necessarily take a fancy to VTI, given its relatively steep forward price-to-earnings P/E ratio of over 20x; one would make allowances for that high multiple if this portfolio’s holdings were set to deliver a high cadence of long-term earnings growth, but at only around 10%, one is staring at an implied price-to-earnings growth (PEG) ratio of roughly 2x (ideally you want to see a ratio of less than 1x).
Morningstar
We also previously noted the elevated share of the tech sector in VTI’s portfolio, which may be seen as desirable to a fair few, particularly in light of the rapid and ongoing penetration of artificial intelligence in the modern world. However, this is also one of those archetypal sectors that is beset by relatively pricey valuations, which may dampen investor interest. Large-cap tech (which dominates VTI), for instance, is priced at a forward P/E of almost 25x while covering stocks with a long-term earnings profile of only 11%.
One could make peace with VTI’s pricey valuation multiple if this product also offered a solid enough dividend yield that could particularly serve as a cushion during drawdowns, but at less than 1.3%, it is not even half as good as what most other ETFs offer (2.83%).
Which Are The Other Major Competing Products For VTI?
Two other prominent ETFs that offer total market exposure of US equities are:
iShares Core S&P Total U.S. Stock Market ETF (ITOT) and the iShares Russell 3000 ETF (IWV)
Seeking Alpha, Morningstar
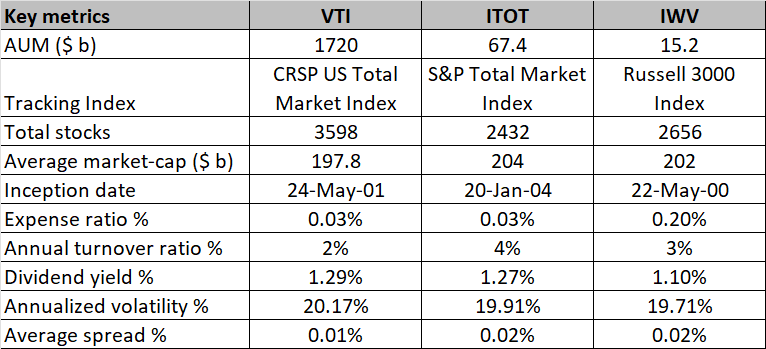
Both ITOT and IWV are passively managed products that cover different indexes than VTI (the former tracks the S&P Total Market Index, while the latter focuses on the Russell 3000 index). Note, however, that even though they seek to cover a broad group of stocks across differing market caps, like VTI, these are more of giant-cap focused products (as can be gleaned by the +$200B average market-cap of the portfolio). Interestingly, VTI offers a much wider reach, covering roughly 1,000 more stocks (on average) than both these portfolios.
VTI is clearly the most popular product, with an AUM that dwarfs the other two. This is interesting to note, particularly in relation to IWV, which came to the bourses one year earlier. Some of the heightened interest could be a function of VTI possessing a superior return track record to the other two (since ITOT, the youngest of the three products, got listed), but it also appears that VTI has superior structural qualities.
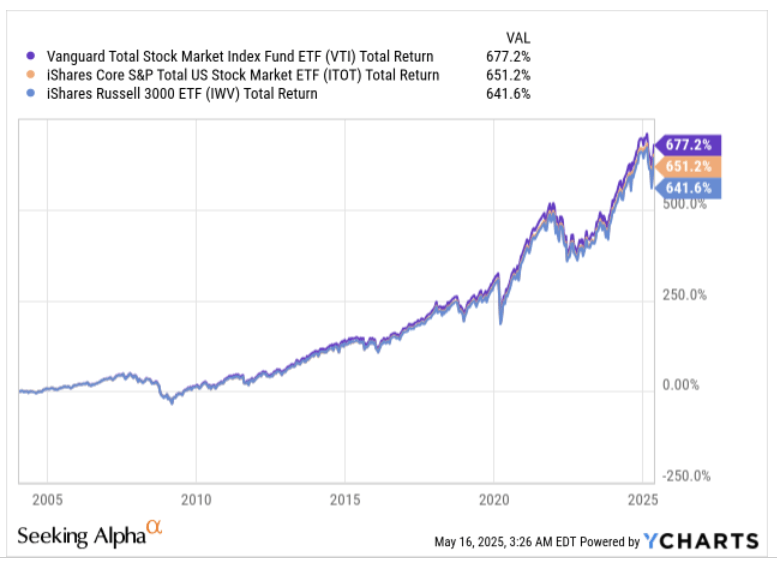
YCharts
Its expense ratio is on par with ITOT and significantly better than IWV; it is also more stable than the other two, with the lowest turnover ratio; additionally, it offers the tightest spreads amongst the three, and finally, it also has the highest yield of the lot.
One area where VTI appears a little troubling is its risk profile (as measured by the annualized volatility), although if one takes a look at the long- and short-term Sharpe ratios, one would note that it has done a good job of generating a decent threshold of excess returns (over the risk-free rate) for the risk it takes (Sharpe ratios that are roughly on par with ITOT and better than IWV).
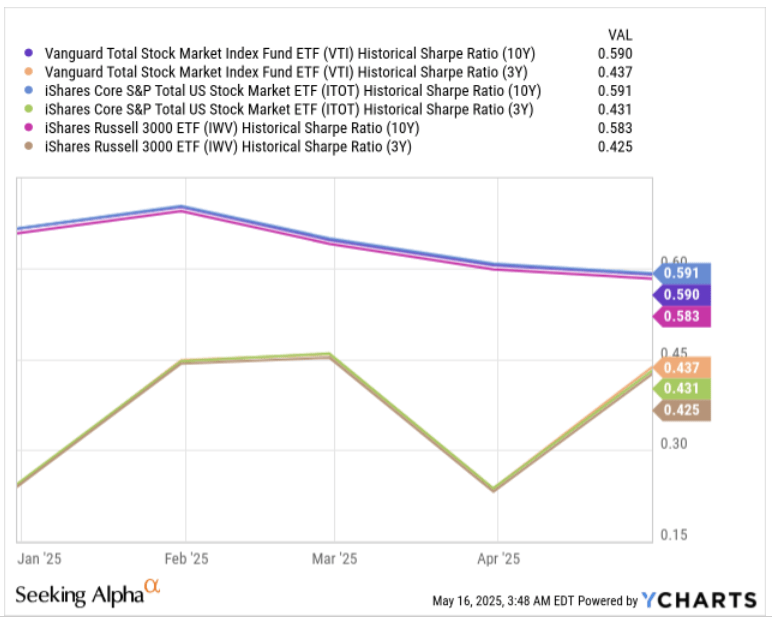
YCharts
Summary
To sum up, VTI comes across as a competent, highly liquid, stable, and cost-efficient ETF for long-term investors looking to partake in the progression of a wide group of US stocks over time. Having said that, the onus here will very much be on the relatively expensive giant caps (most of which are tech stocks) to deliver the goods. Also, given that VTI covers only a few small-cap stocks that largely appear to be making up the numbers, we can also appreciate the rationale of prospective investors shunning this product and rather pursuing something like a VOO, which is also priced at an identical expense ratio but appears to be doing a better job on the risk-adjusted return front.
This article answers these three main questions about VTI:
- Does VTI provide exposure to both growth and value stocks?
- How has VTI performed compared to the S&P 500?
- How many different stocks does VTI hold?
Editor's note: This article is intended to provide a general overview of the ETF for educational purposes only and, unlike other articles on Seeking Alpha, does not offer an investment opinion about the ETF.