designer491
REIT Performance
REITs fell further into the red in 2025 during a tough April selloff, with a -6.45% average total return. The REIT sector badly underperformed the broader market, falling far short of the Dow Jones Industrial Average (-3.1%), S&P 500 (-0.7%) and NASDAQ (+0.9%). The market cap weighted Vanguard Real Estate ETF (VNQ) handily outpaced the average REIT again in April (-2.44% vs. -6.45%) and has massively outperformed year-to-date (+0.19% vs. -9.10%). The spread between the 2025 FFO multiples of large-cap REITs (17.5x) and small cap REITs (12.9x) narrowed in March as multiples contracted 0.6 turns for large caps but held steady for small caps. Investors currently need to pay an average of 35.7% more for each dollar of FFO from large-cap REITs relative to small-cap REITs. In this monthly publication, I will provide REIT data on numerous metrics to help readers identify which property types and individual securities currently offer the best opportunities to achieve their investment goals.
Source: Graph by Simon Bowler of 2nd Market Capital, Data compiled from S&P Global Market Intelligence LLC. See important notes and disclosures at the end of this article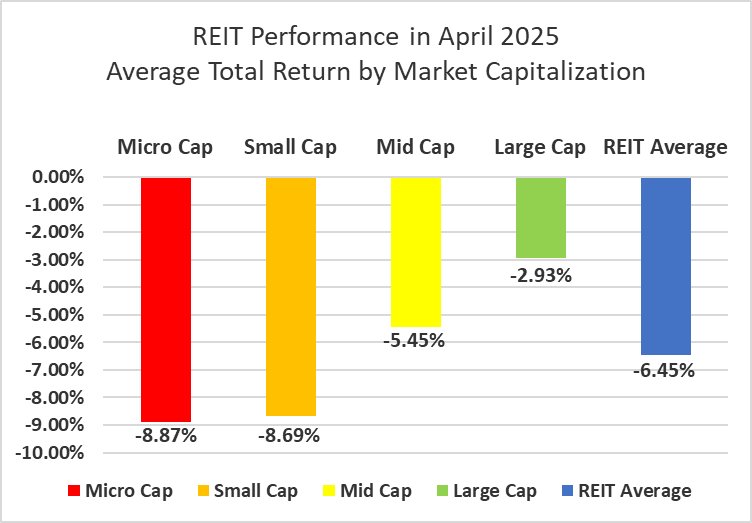
Microcap REITs (-8.87%) underperformed their larger peers for the 6th straight month. Large caps (-2.93%) continued to outperform both mid-caps (-5.45%) and small caps (-8.69%) in April. During the first four months of 2025, large-cap REITs have outperformed small caps by 1081 basis points.
Source: Graph by Simon Bowler of 2nd Market Capital, Data compiled from S&P Global Market Intelligence LLC. See important notes and disclosures at the end of this article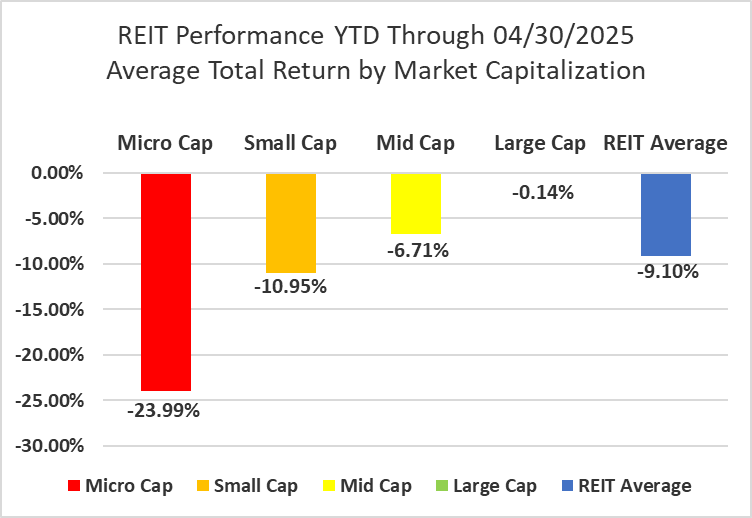
16 out of 18 Property Types Averaged Negative Returns in April
Only 11.11% of REIT property types averaged a positive total return in April. There was a 20.17% total return spread between the best- and worst-performing property types. Data Centers (+7.28%) and Infrastructure (+2.47%) were the only property types in positive territory in April. Timber (-12.90%), Mall (-10.52%) and Land REITs (-10.10%) averaged double-digit declines.
Source: Table by Simon Bowler of 2nd Market Capital, Data compiled from S&P Global Market Intelligence LLC. See important notes and disclosures at the end of this article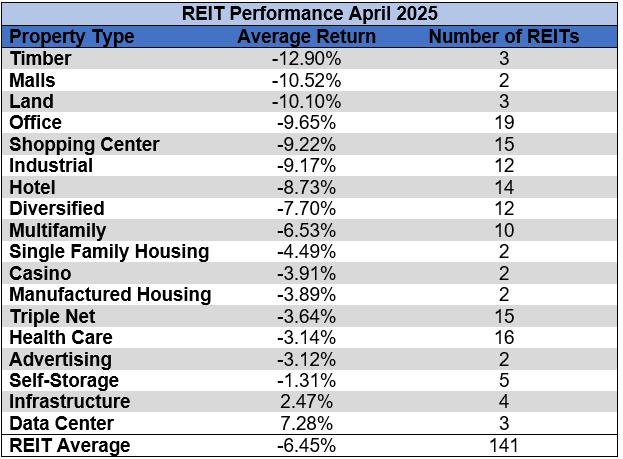
Office (-24.06%) and Hotel REITs (-22.90%) significantly underperformed over the first four months of 2025. Health Care (+7.23%), Infrastructure (+6.88%), and Casinos (+6.00%) were the only three property types to average positive total returns year-to-date.
Source: Table by Simon Bowler of 2nd Market Capital, Data compiled from S&P Global Market Intelligence LLC. See important notes and disclosures at the end of this article
The REIT sector as a whole saw the average P/FFO (2025Y) decrease 0.5 turns in April from 13.9x down to 13.4x. 16.7% of property types averaged multiple expansion and 83.3% averaged multiple contraction in April. Data Centers (26.9x), Multifamily (24.6x), Land (21.6x), Single Family Housing (19.1x), and Infrastructure (18.7x) currently trade at the highest average multiples among REIT property types. Hotels (5.9x) and Office (8.2x) are the only property types that average single-digit FFO multiples.
Source: Table by Simon Bowler of 2nd Market Capital, Data compiled from S&P Global Market Intelligence LLC. See important notes and disclosures at the end of this article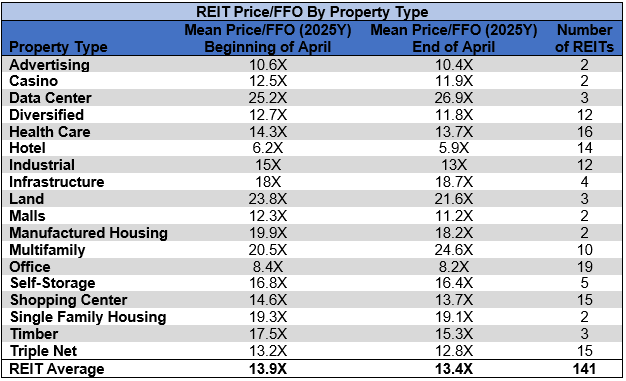
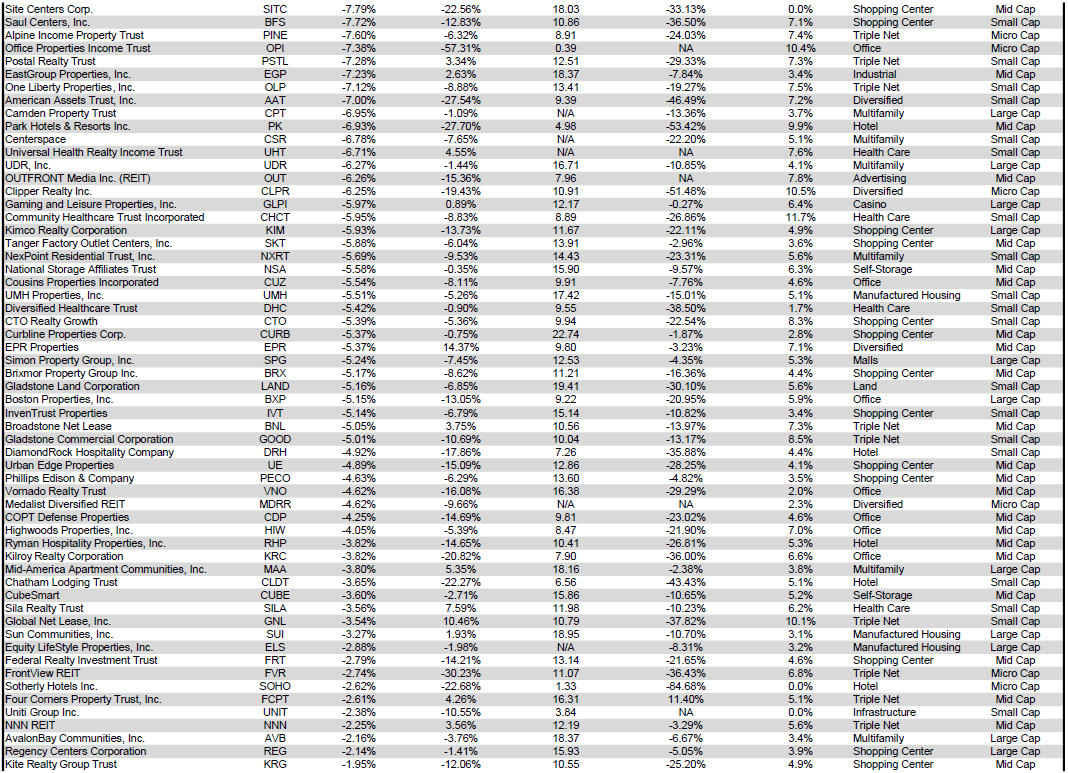
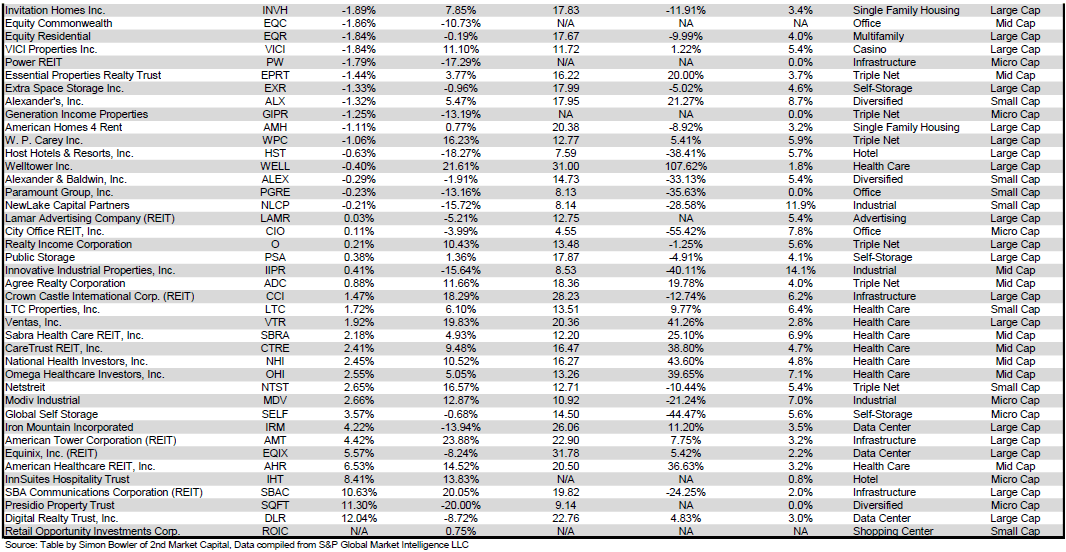
Performance of Individual Securities
Equity Commonwealth (EQC) has delisted from the NYSE with a last trading day of April 21st. EQC paid out a final cash liquidating distribution of $1.60 per share on April 22nd, which followed a $19.00/share cash liquidating distribution in December.
Digital Realty Trust (DLR) (+12.04%) achieved a strong gain in April as they raised guidance and outlined an ambitious growth plan for the year. Despite outpacing all other REITs in April, DLR is still in the red year-to-date, with a -8.72% total return in 2025.
Wheeler REIT (WHLR) (-63.61%) was yet again the worst-performing REIT in April and has already plummeted a disastrous -98.29% in just the first 4 months of 2025. This collapse mirrors Wheeler’s -98.47% 2024 return as the free fall continues.
Only 15.38% of REITs had a positive total return in April. REITs have averaged a -9.10% year-to-date total return in 2025, which was a bit worse than the -7.65% return for the REIT sector over the first 4 months of 2024.
For the convenience of reading this table in a larger font, the table below is available as a PDF as well.
Source: Table by Simon Bowler of 2nd Market Capital, Data compiled from S&P Global Market Intelligence LLC. See important notes and disclosures at the end of this article Source: Table by Simon Bowler of 2nd Market Capital, Data compiled from S&P Global Market Intelligence LLC. See important notes and disclosures at the end of this article Source: Table by Simon Bowler of 2nd Market Capital, Data compiled from S&P Global Market Intelligence LLC. See important notes and disclosures at the end of this article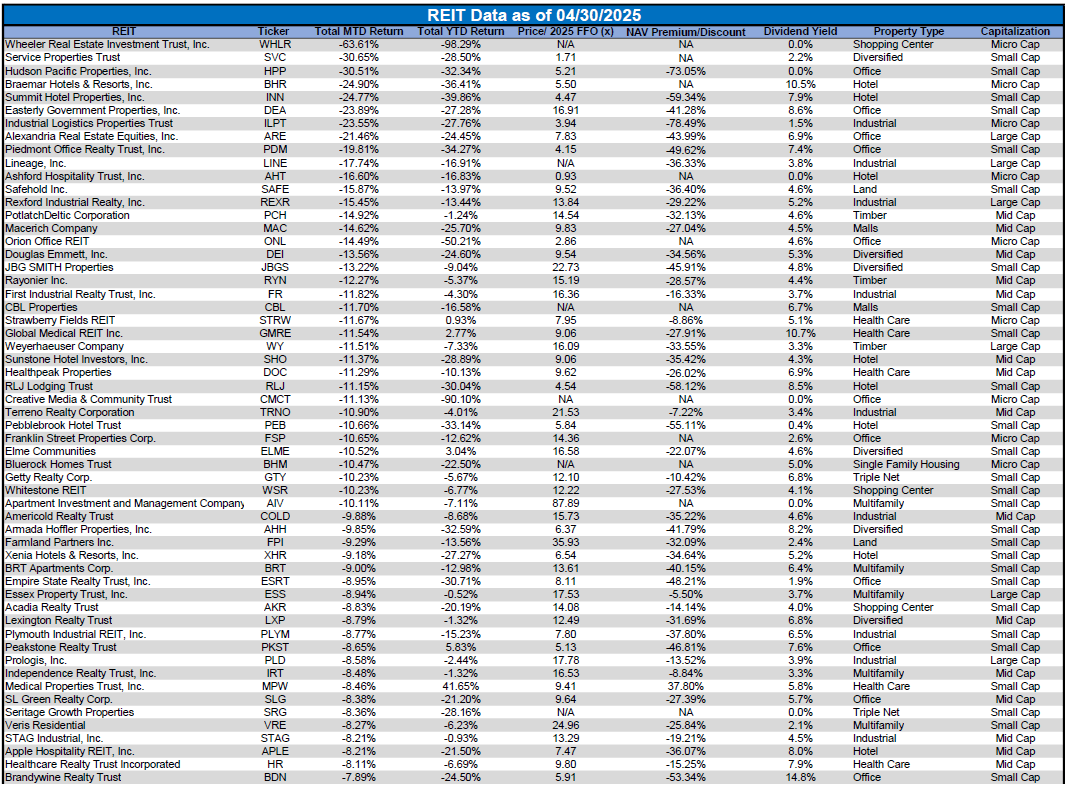
Dividend Yield
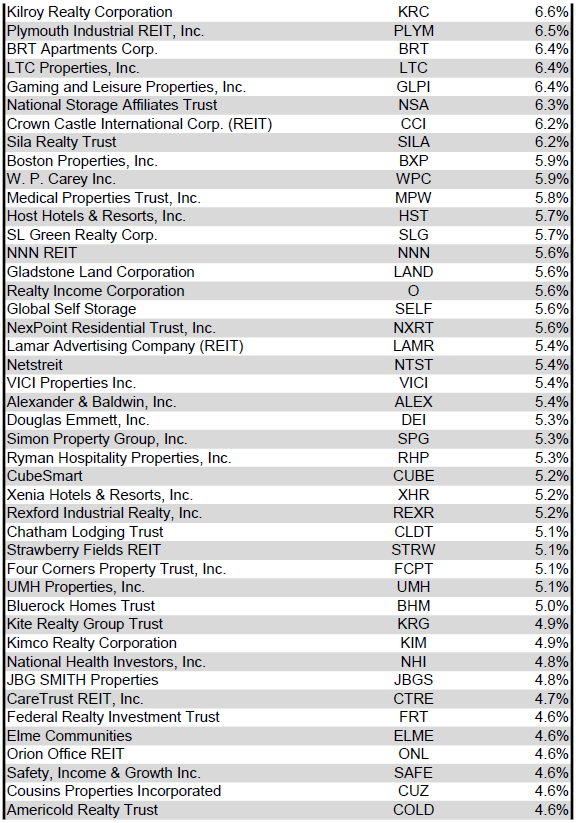
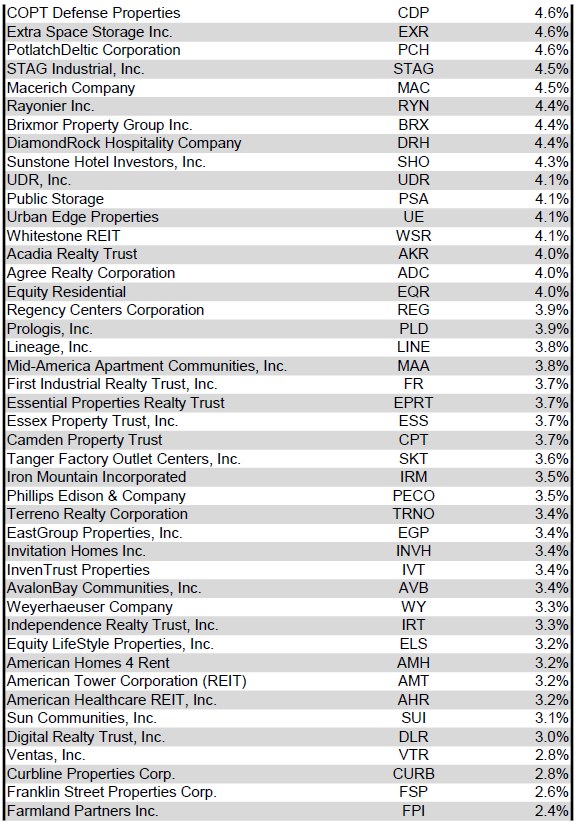
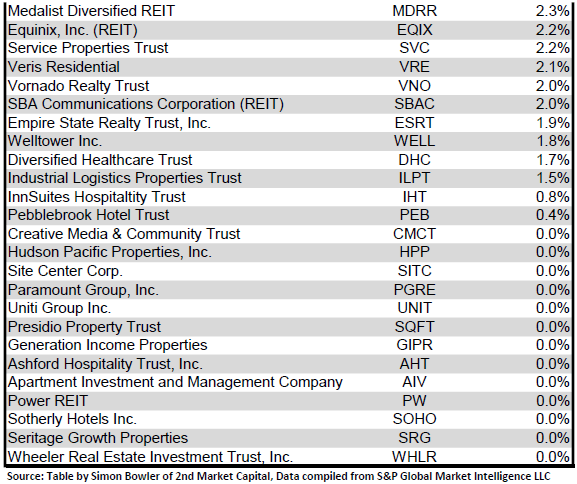
The dividend yield is an important component of a REIT's total return. The particularly high dividend yields of the REIT sector are, for many investors, the primary reason for investment in this sector. As many REITs are currently trading at share prices well below their NAV, yields are currently quite high for many REITs within the sector. Although a particularly high yield for a REIT may sometimes reflect a disproportionately high risk, there exist opportunities in some cases to capitalize on dividend yields that are sufficiently attractive to justify the underlying risks of the investment. I have included below a table ranking equity REITs from the highest dividend yield (as of 4/30/2025) to the lowest dividend yield.
For the convenience of reading this table in a larger font, the table below is available as a PDF as well.
Source: Table by Simon Bowler of 2nd Market Capital, Data compiled from S&P Global Market Intelligence LLC. See important notes and disclosures at the end of this article Source: Table by Simon Bowler of 2nd Market Capital, Data compiled from S&P Global Market Intelligence LLC. See important notes and disclosures at the end of this article Source: Table by Simon Bowler of 2nd Market Capital, Data compiled from S&P Global Market Intelligence LLC. See important notes and disclosures at the end of this article Source: Table by Simon Bowler of 2nd Market Capital, Data compiled from S&P Global Market Intelligence LLC. See important notes and disclosures at the end of this article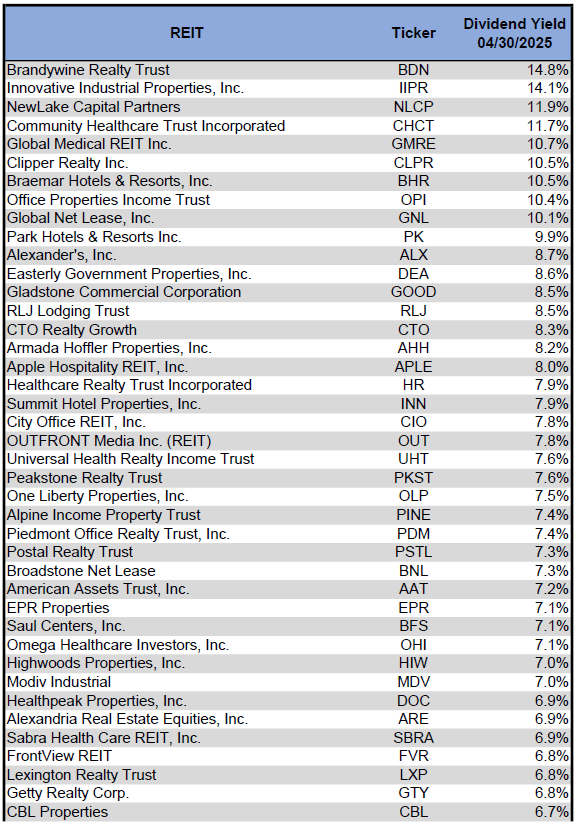
Although a REIT’s decision regarding whether to pay a quarterly dividend or a monthly dividend does not reflect on the quality of the company’s fundamentals or operations, a monthly dividend allows for smoother cash flow to the investor. Below is a list of equity REITs that pay monthly dividends, ranked from the highest yield to the lowest yield.
Source: Table by Simon Bowler of 2nd Market Capital, Data compiled from S&P Global Market Intelligence LLC. See important notes and disclosures at the end of this article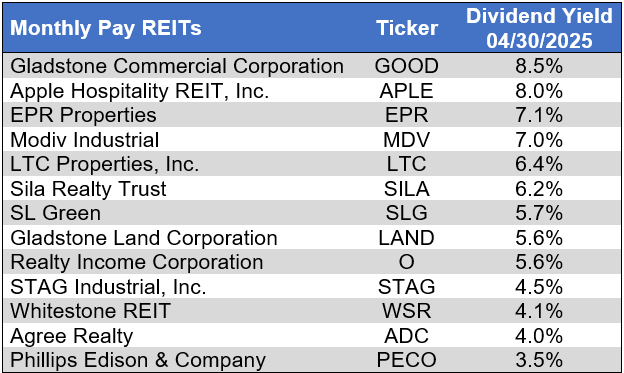
Dividend News
5 REITs announced increases to their dividend in April, 4 of which pay quarterly dividends and 1 of which pays monthly. Tanger (SKT) (+6.4%) announced the largest dividend raise, followed by UMH Properties (UMH) (+4.7%) and Medalist Diversified REIT (MDRR) (+3.8%). In total, 40 REITs increased their dividend during the first four months of 2025.
Source: S&P Global Market Intelligence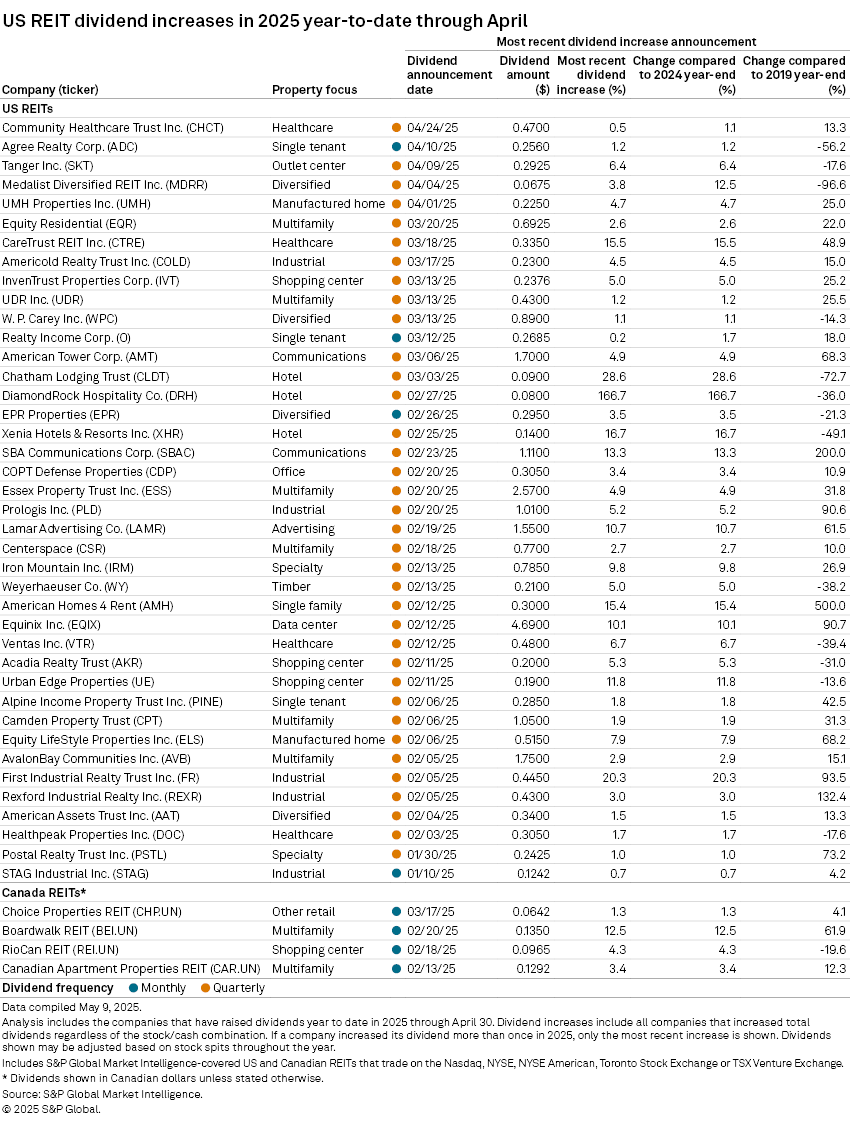
Economic Health
The number of corporate bankruptcies remained elevated and flat month over month in April. There were more filings year-to-date in 2025 than in the first 4 months of any other year since 2010. There have been 19.4% more bankruptcy filings over the first 4 months of 2025 than during the same period in 2024.
Source: S&P Global Market Intelligence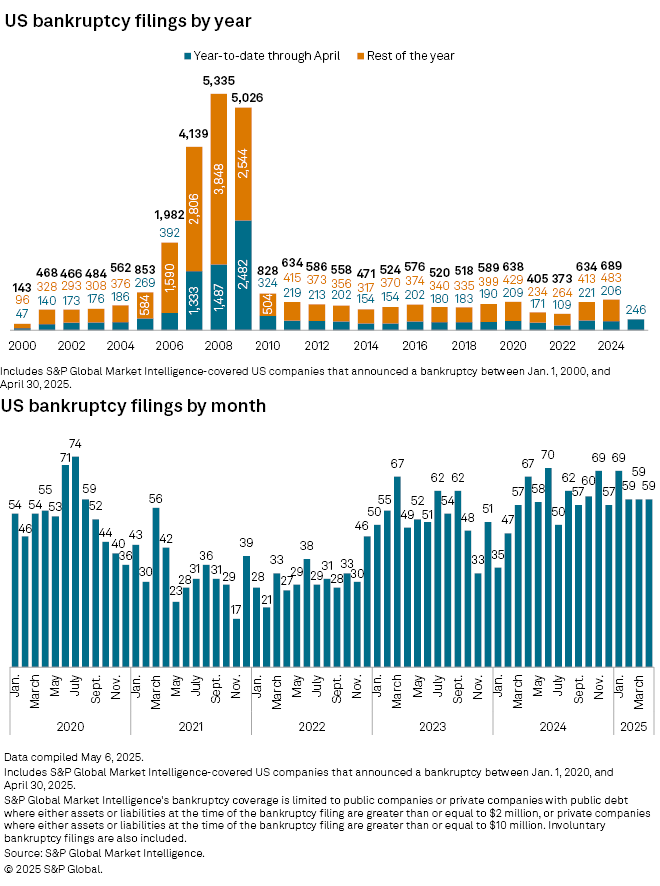
Valuation
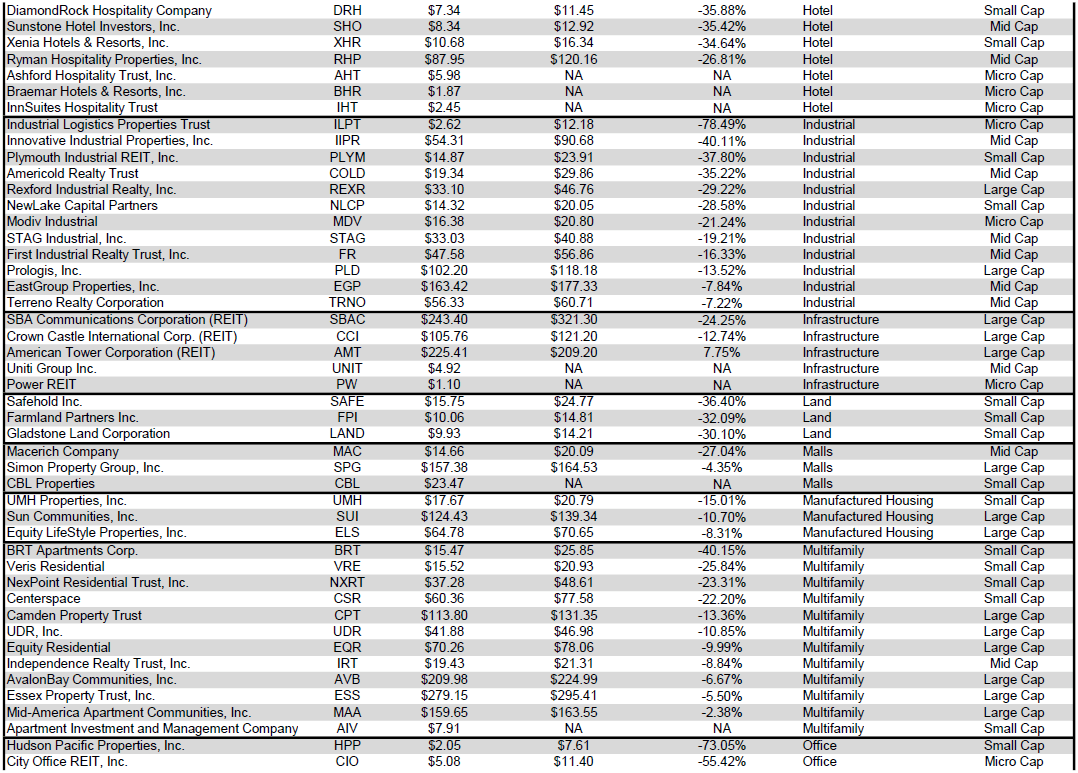
REIT Premium/Discount to NAV by Property Type
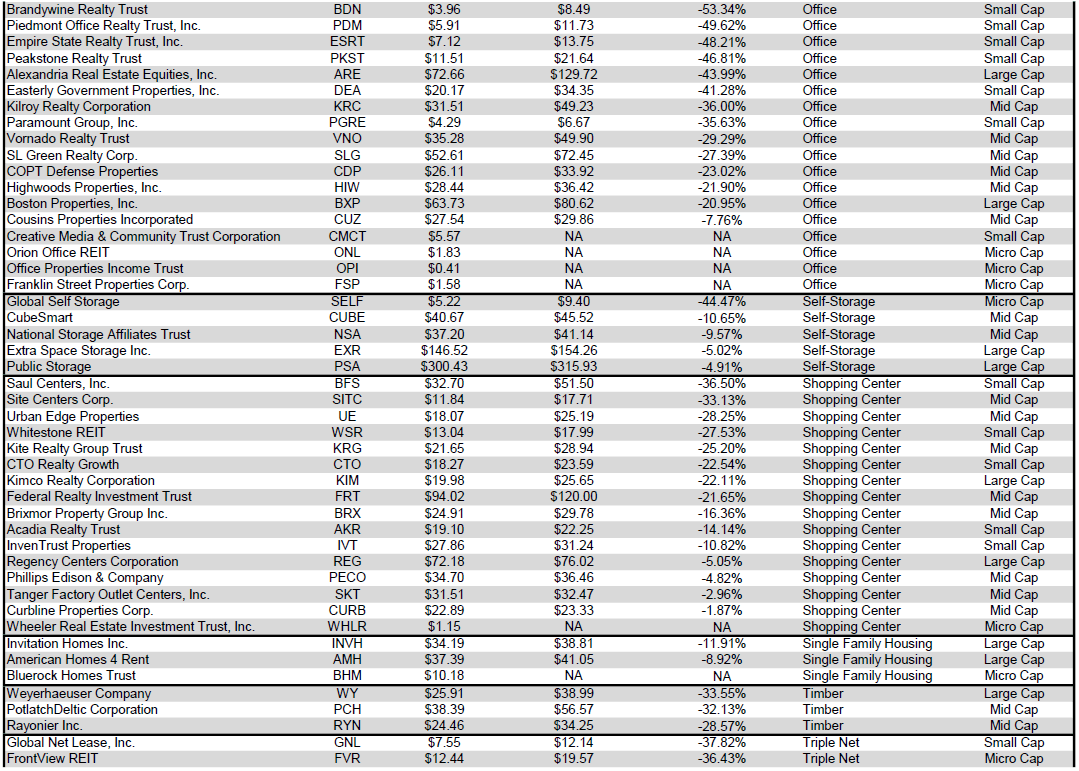
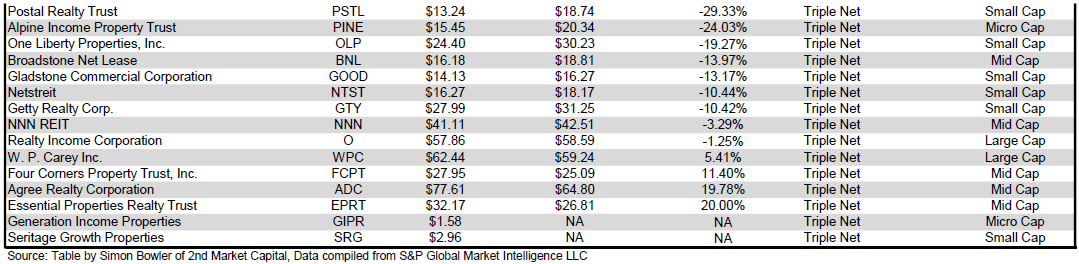
Below is a downloadable data table, which ranks REITs within each property type from the largest discount to the largest premium to NAV. The consensus NAV used for this table is the average of analyst NAV estimates for each REIT. Both the NAV and the share price will change over time, so I will continue to include this table in upcoming issues of The State of REITs with updated consensus NAV estimates for each REIT for which such an estimate is available.
For the convenience of reading this table in a larger font, the table below is available as a PDF as well.
Source: Table by Simon Bowler of 2nd Market Capital, Data compiled from S&P Global Market Intelligence LLC. See important notes and disclosures at the end of this article Source: Table by Simon Bowler of 2nd Market Capital, Data compiled from S&P Global Market Intelligence LLC. See important notes and disclosures at the end of this article Source: Table by Simon Bowler of 2nd Market Capital, Data compiled from S&P Global Market Intelligence LLC. See important notes and disclosures at the end of this article Source: Table by Simon Bowler of 2nd Market Capital, Data compiled from S&P Global Market Intelligence LLC. See important notes and disclosures at the end of this article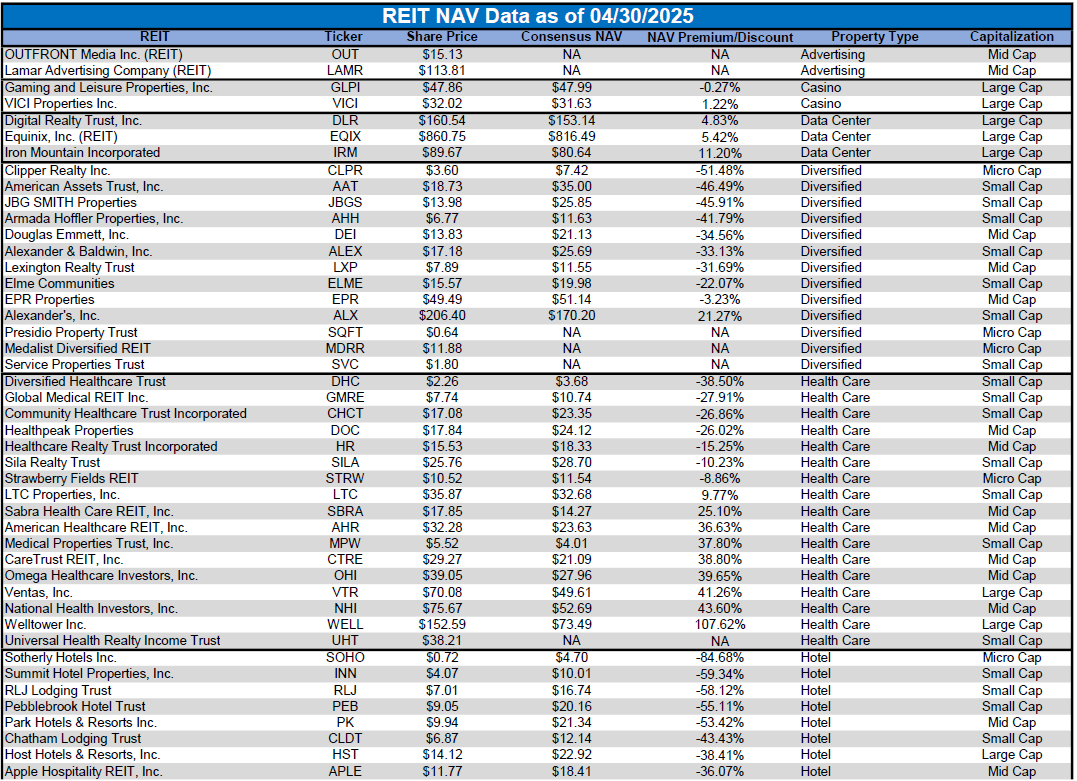
Takeaway
The large-cap REIT premium (relative to small cap REITs) narrowed in April and investors are now paying on average about 36% more for each dollar of 2025 FFO/share to buy large-cap REITs than small-cap REITs (17.5x/12.9x - 1 = 35.7%). As can be seen in the table below, there is presently a strong positive correlation between market cap and FFO multiple.
Source: Table by Simon Bowler of 2nd Market Capital, Data compiled from S&P Global Market Intelligence LLC. See important notes and disclosures at the end of this article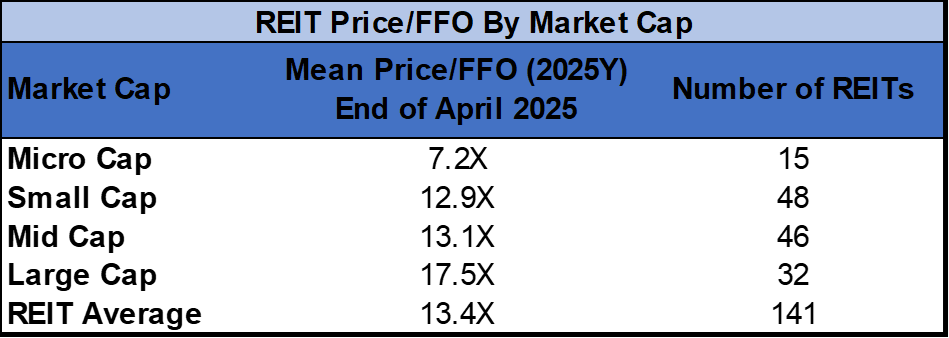
The table below shows the average NAV premium/discount of REITs of each market cap bucket. This data, much like the data for price/FFO, shows a strong, positive correlation between market cap and Price/NAV. The average large-cap REIT (-5.88%) trades at a single-digit discount to NAV, and mid-cap REITs (-12.60%) trade at a low double-digit discount. Small cap REITs (-30.04%) trade at just over 2/3 of NAV while micro caps (-45.01%) trade slightly north of half of their respective NAVs.
Source: Table by Simon Bowler of 2nd Market Capital, Data compiled from S&P Global Market Intelligence LLC. See important notes and disclosures at the end of this article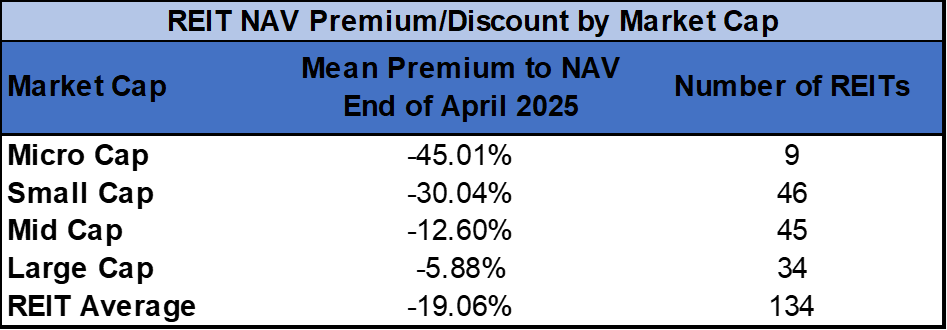
Much of the REIT Sector Has Still Not Fully Recovered from the Impact of Covid-19 and Lockdowns
Although the entire economy was impacted by Covid-19 and the corresponding government-imposed lockdowns, multiple real estate property types got hit particularly hard. Most notably, hotels were impacted by reduced travel and canceled events, office leasing was dealt a devastating blow by the shift to work-from-home and some retail was even banned from opening their doors to customers for a period of time.
Source: S&P Global Market Intelligence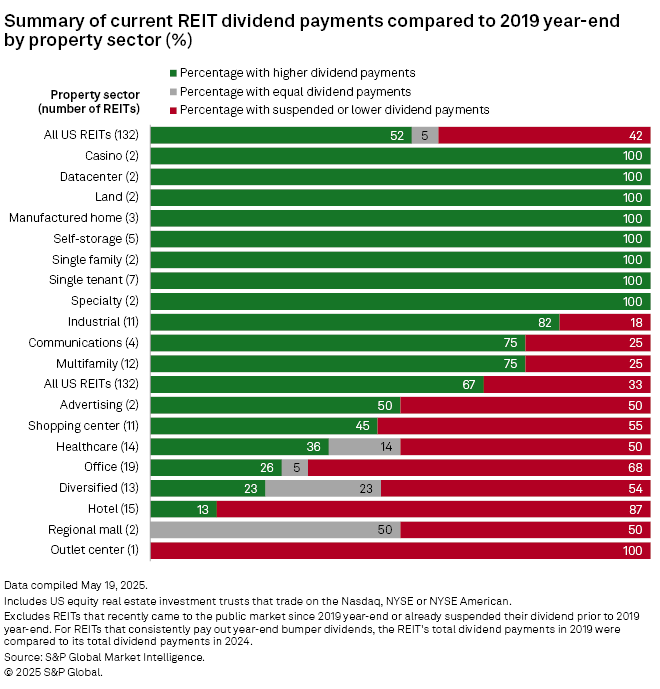
One of the most direct victims of the economic hit REITs took was dividend payments. Even after multiple years of post-lockdown recovery, 42% of REITs still pay a lower dividend than they did pre-Covid and in some cases still have a suspended dividend. 50% or more of REITs still have a lower or suspended dividend in Hotels, Malls, Diversified, Office, Healthcare, Shopping Centers, and Advertising.
Source: S&P Global Market Intelligence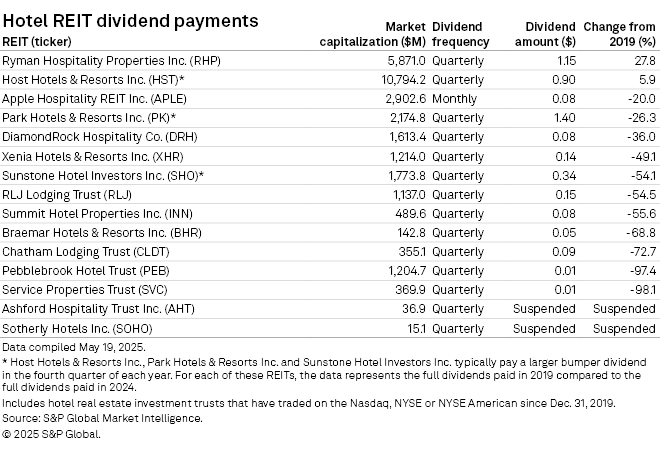
Only 2 hotel REITs have raised their dividend payments to greater than the level they were in 2019, Ryman Hospitality Properties (RHP) (+27.8%) and Host Hotels & Resorts (HST) (+5.9%). Others have cut their dividends by 20% - 98.1% or, in the case of Sotherly Hotels (SOHO) and Ashford Hospitality Trust (AHT), have suspended and not yet reinstated their dividends.
Source: S&P Global Market Intelligence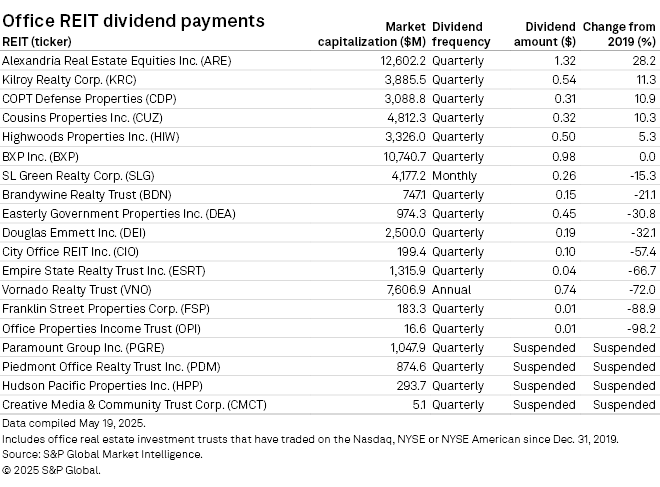
4 office REITs have suspended and not yet reinstated their dividends: Paramount Group (PGRE), Piedmont Office Realty Trust (PDM), Hudson Pacific Properties (HPP), and Creative Media & Community Trust (CMCT). Other Office REITs have cut their dividends anywhere from 15.3% to 98.2%. Not all Office REITs are the same, however, as Alexandria Real Estate Equities (ARE), which focuses on high-quality life science office space, has steadily increased earnings and raised their dividend by 28.2% over that same period.
Source: S&P Global Market Intelligence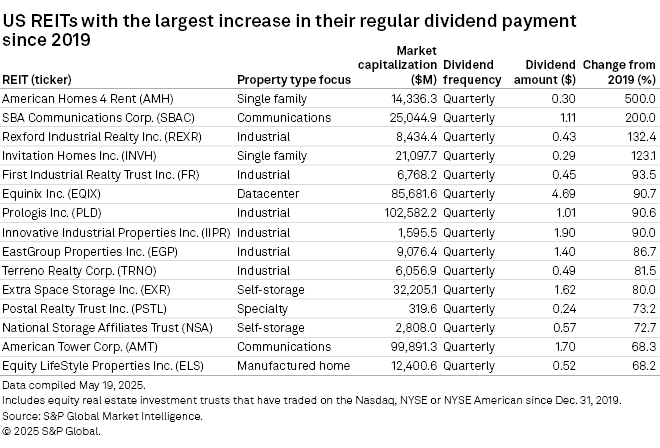
Not all REITs have struggled to maintain their dividends, however, with many able to aggressively increase their dividends over the same period. The largest dividend hikes came from American Homes 4 Rent (AMH) (+500%), SBA Communications (SBAC) (+200%), and Rexford Industrial Realty (REXR) (+132.4%). Industrial accounts for 6 of the 10 REITs with the greatest dividend expansion since the end of 2019.
Source: S&P Global Market Intelligence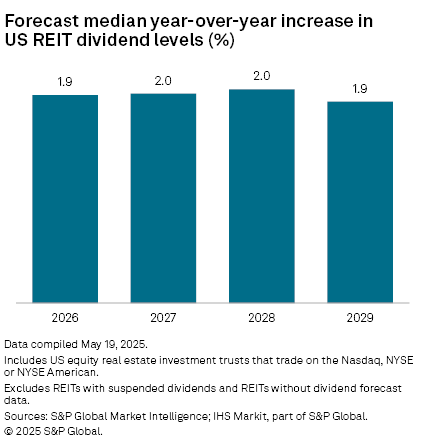
Equity REITs that currently pay a dividend are forecast by S&P Global Market Intelligence dividend analysts to increase their dividends steadily through 2029. This stable dividend growth is projected to be within a range of 1.9%-2.0% per year. Steady dividend growth can have a snowball effect, building income in a portfolio. Active investors have the opportunity to potentially achieve higher portfolio income growth, however, with heavier weightings in higher dividend growth REITs.
Editor's Note: This article covers one or more microcap stocks. Please be aware of the risks associated with these stocks.
Dividends are scarce, we provide the solution

For everything you need to build a growing stream of dividend income, please consider joining Portfolio Income Solutions. As a member you will get:
- Access to a curated Real Money REIT Portfolio
- Continuous market and single stock analysis
- Data sets on every REIT
You will benefit from our team’s decades of collective experience in REIT investing. On Portfolio Income Solutions, we don’t only share our ideas, we also discuss best trading practices and help you become a better investor.