Implied market volatility (as measured by VIX) is determined by a reflexive loop between the derivative and underlying markets based on future estimate of realized volatility of the underlying + characteristic movements of the underlying. There are of course many more factors that affect the VIX--such as skew of implied volatility curve, day of the week, holidays in a given month, upcoming events that could impact the market--just to name a few.
Ok, I apologize if I am losing the interest of the readers with confusing terminology or definitions. I will keep it as simple as possible from hereon. In a nutshell, an investor could get a good sense of whether VIX is cheap or expensive based on simple analysis of 1) Various GARCH model estimates and 2) Median Curve of VIX dependent on (SPY) prices in relation to its various moving averages. Please allow me to walk you through this process.
The first step involves looking at estimates of future realized volatility. V-Lab is an excellent website to get up-to-date estimates on the S&P500 Index based on various GARCH models (the second link is to Wikipedia for technical definitions of GARCH). In V-Lab, click on SPX, and several analyses of S&P500 Index will show. I like to look at EGARCH return series (just a personal preference). The graph below is from V-Lab, and shows EGARCH vol prediction for future realized volatility of the S&P500 Index. As of July 4, 2012, the value was 15.68%.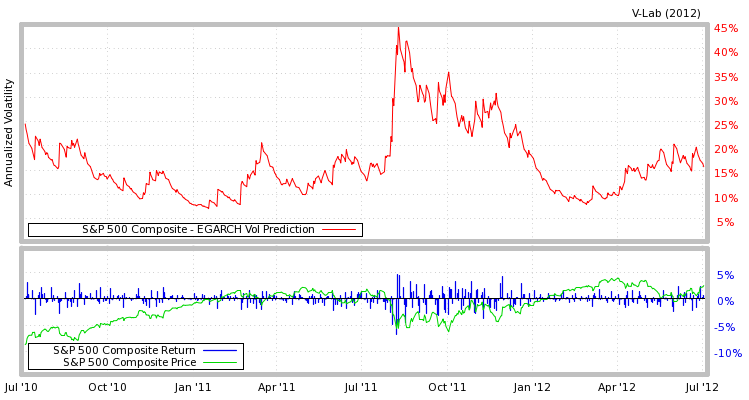
One should then compare this number to the At-The-Money [ATM] implied volatility level of July/August S&P500 Index options, depending on number of days to go before expiration. Since we are about half way though July month expiration, we could average July ATM implied volatility of 14% and August ATM implied volatility of 15% to get 14.5%. ATM implied volatility numbers can be found