Contributor Since 2014
I began my journey in the financial markets at the peak of the financial market, just before the collapse of the market. I was there at the peak of the market. Then, I started where most undergraduates start: fundamental analysis. Although I took up some business and finance modules, my knowledge of the finance and fundamental analysis came from extensive reading. I probably read all the classics of fundamental analysis, yes, including the bible of FA, "Security Analysis" by David Dodds and Benjamin Graham.
Along the way, I also study technical analysis and also read through the TA Bible "Technical Analysis of Stock Trends". After a few months, I realised that, in terms of methodology, I tend towards TA, however, I still feel that something is missing in the formula.
My first venture into the professional trading world happens just after graduation and I was fortunate enough to land myself a trading internship opportunity with Singapore's then biggest and probably most successful Macro hedge fund, Asia Genesis Asset Management. It was there that I was able to fill in some gaps in my understanding of TA from the senior traders and how to filter news and formulate macro view from the managing director. However, I still feel that something is missing but there are clues lying around.
"Market Wizards" is a required reading in the hedge fund and we also did the Van Tharp Trader Test. I was categorized as a "Strategic Trader" and the representing trader is Paul Tudor Jones - who is a market wizard. I read his interview more than 10 times over the years and from it, one thing stood out for me: he recommended Robert Prechter - and this became my first exposure to Elliott Waves. It was 2009, and I did nothing about it.
Somewhere in 2010, I found "Elliott Waves Principles" in Kinokuniya Books Stores but it was selling for more than S$100 (or US$80). I took the plunge and bought it but found that it was quite a hard read and even went to our National Library video section to watch a very old video on an EW presentation. This video filled another crucial gap: the concept of alternate counts. I did not manage to finish the book even though I know somehow that I have to in order to complete myself as a trader.
On and off through the years, I restarted reading it but never got down to finish it. Year 2016, I pick up "Bloomberg Visual Guide to Elliott Waves" and it was this book that really enables me to count waves effectively from price action alone. After this, I was able to go back to Elliott Waves Principles and found myself able to follow what was written inside easily. I completed it and I think completes 90% of the hard skill of wave counting.
I began to spend more effort to find out more and purchased books from EW International and thus educated myself to the theory behind EW (Socionomics). I began applying my knowledge much more confidently.
Another part of the puzzle that I didn't realise I was missing came to me in 2017 when my trader colleague in SLC introduces me to videos presentations of the Taiwan Wave Master who specialises in Fibonacci Time counting.
Now EW is the primary technique that I used analyse charts, trade, and manage risk.
Over the years, I have to learn and unlearn many things before I eventually found the one technique that resonates with me. However, like all the different techniques out there, no matter which one you use, their uses have limits and should be applied only to where they are supposed to be used for. If you have doubts, given that I have studied and tried most known techniques out there, you can give message me if you seek clarifications and I will try my best to help.
Copper had a good run up over the past few weeks and for those people who had been trying to catch the top, including me, life hasn't been good at all. However, Friday's action seems to have finally capped the base metal move and as such, I can finally put an end to copper upward price movement.
Following to the updated chart of copper. Note that even though we have ended the uptrend on a supercycle scale, shorting it with size is still dangerous for the stop loss is still 14 cents away. That means if you are trading the futures, it is 14 *20 = 280 ticks away. With each future tick amount at US$10, that is US$2800 for the stop loss.
Over here, I present the Copper EW counts on a weekly and 4hourly basis before going into the 15m.
Copper Supercycle EW counts Weekly 9th Sep 2017
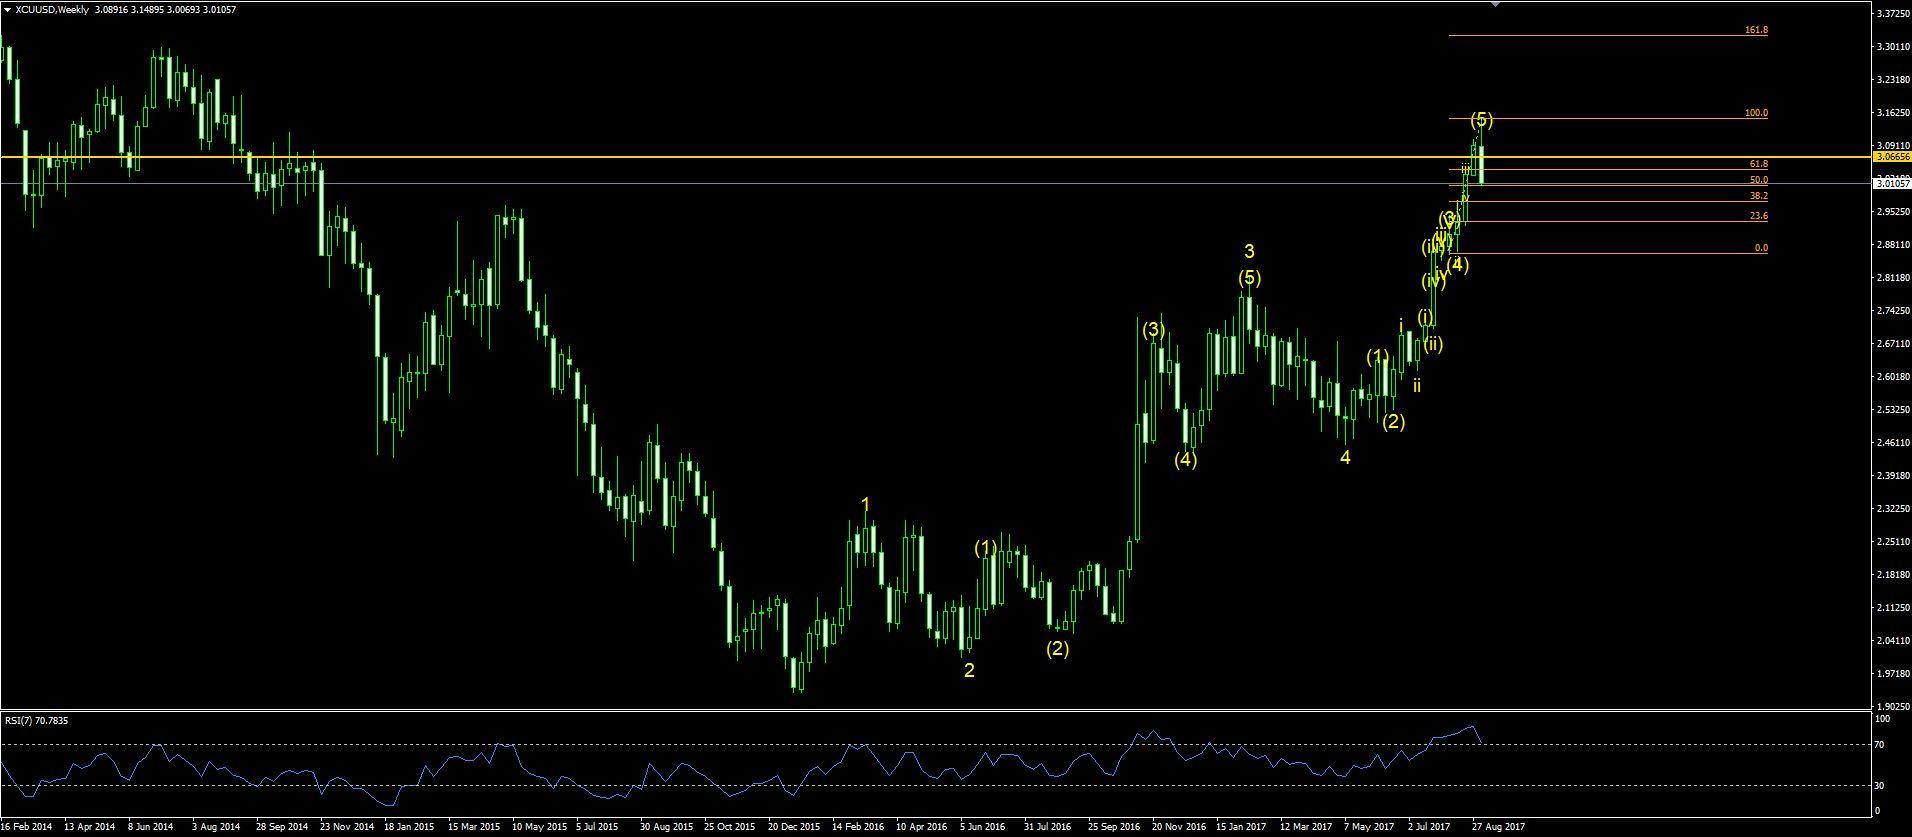
Copper Supercycle EW counts 4hourly 9th Sep 2017
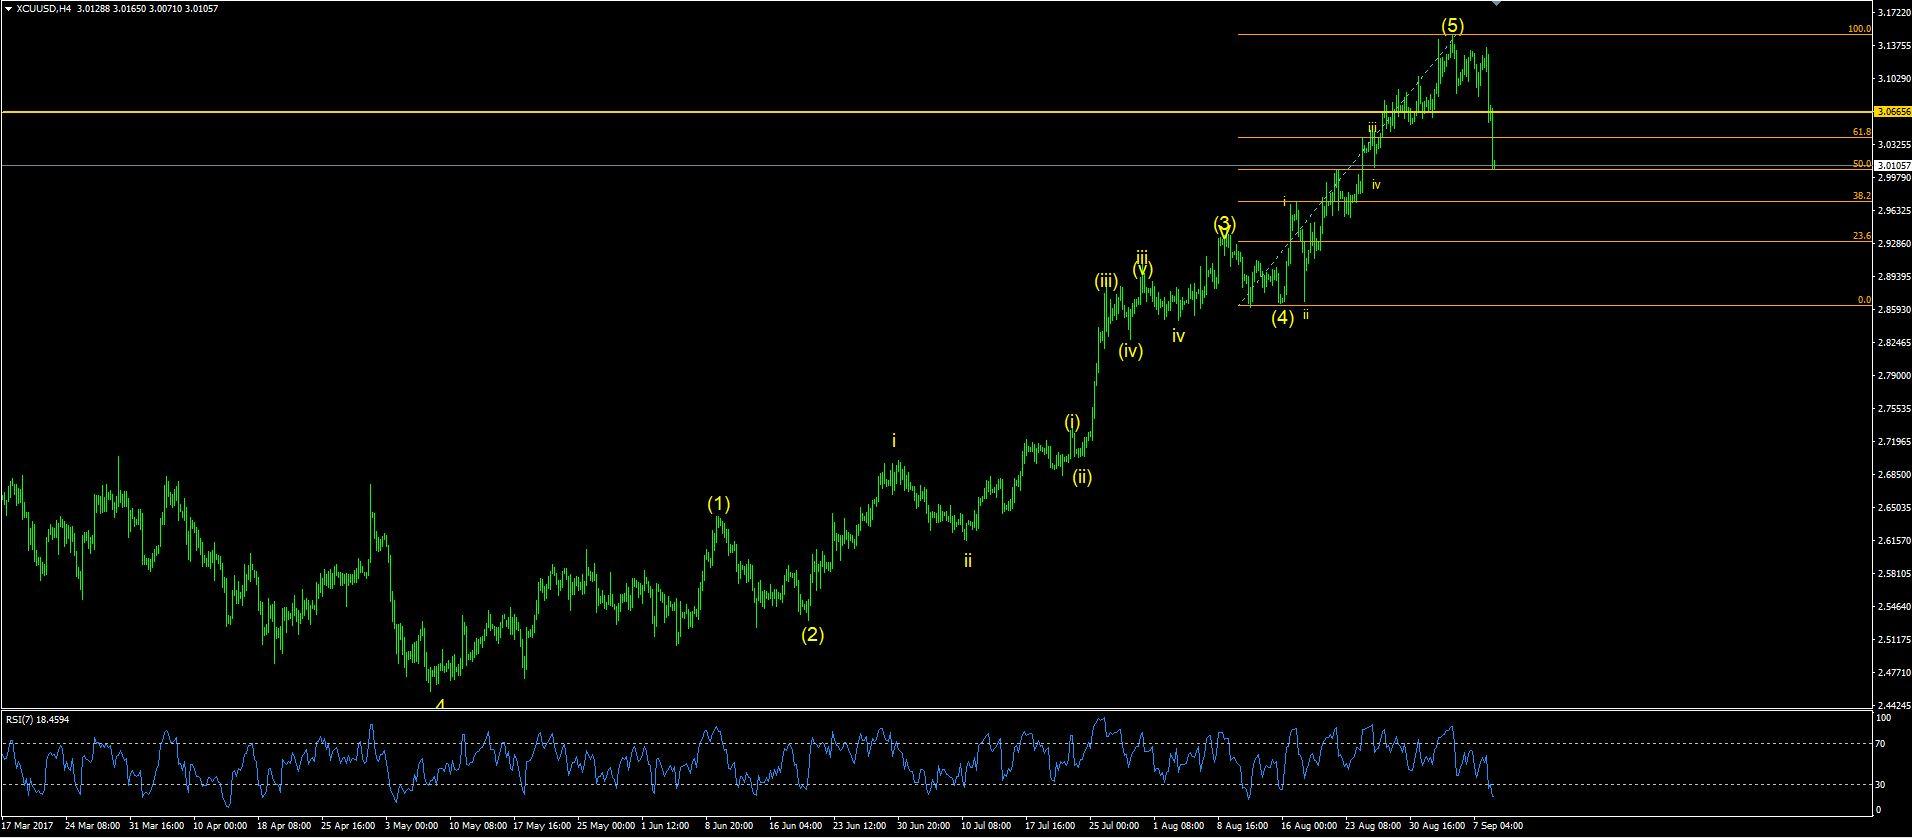
Copper Supercycle EW counts 15m 9th Sep 2017
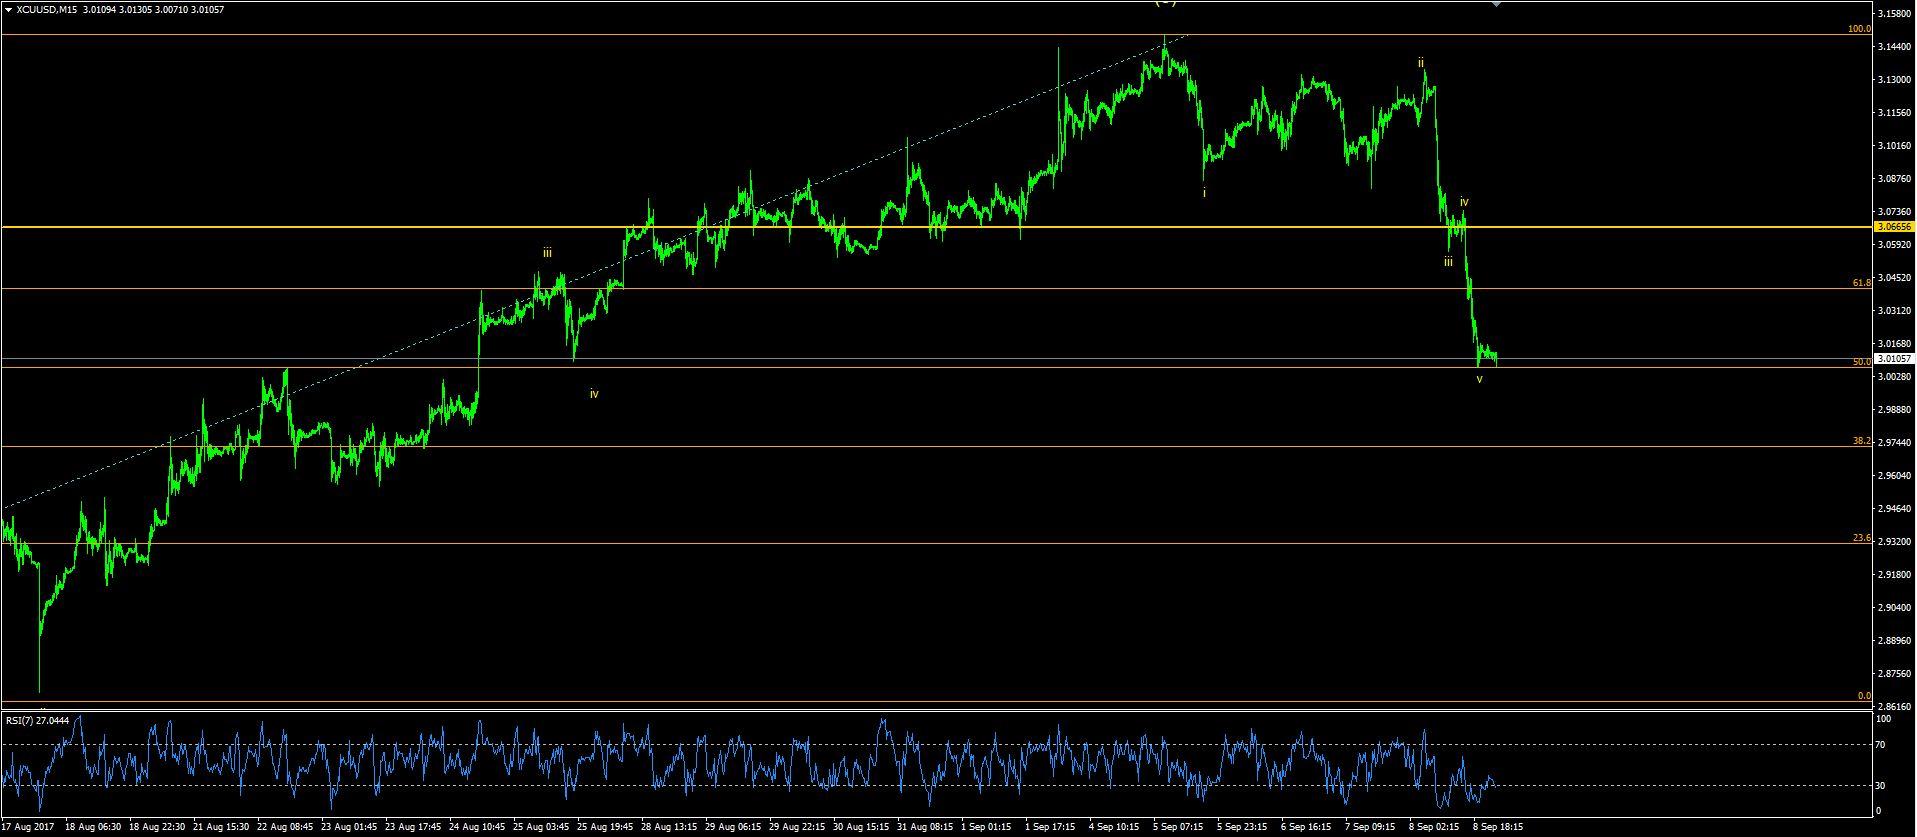
Note that the current price level that we have for copper really is the base of the previous wave wave 4. According to EW guideline, this is where price should stop and potentially reverse. Also, we have noted a potential 5 waves down structure for Copper on the 15m timeframe. If this count is correct (no extension), that means we are expecting a wave 2 corrective upwave. According to yet another EW guideline, wave 2 usually corrects strongly. My personal experience with various commodities (silver, gold, natural gas, soybean oil, etc.) had been that wave 2 correction can, and frequently do, correct almost the entire length of wave 1.
Another point to consider is that while we may plot a 5-wave structure down on the 15m timeframe, these waves disappears when we move higher up the timeframe (see 4 hourly for example). That means that what we expect to be the end of a down move may yet extend on the lower degree. Take note that EW accuracy and waveform rules and guidelines starts becoming more erratic and even breaks down the lower the time frame we go (mainly due to noise).
Thus, I would caution against initiating any position until we can get a clearer picture. i.e. When the corrective waveform is more or less formed. But for now, trading should be restricted to the short side - at least until a recent high is breached.
Disclosure: I am/we are short HG.
Additional disclosure: I am currently short copper futures (HG)