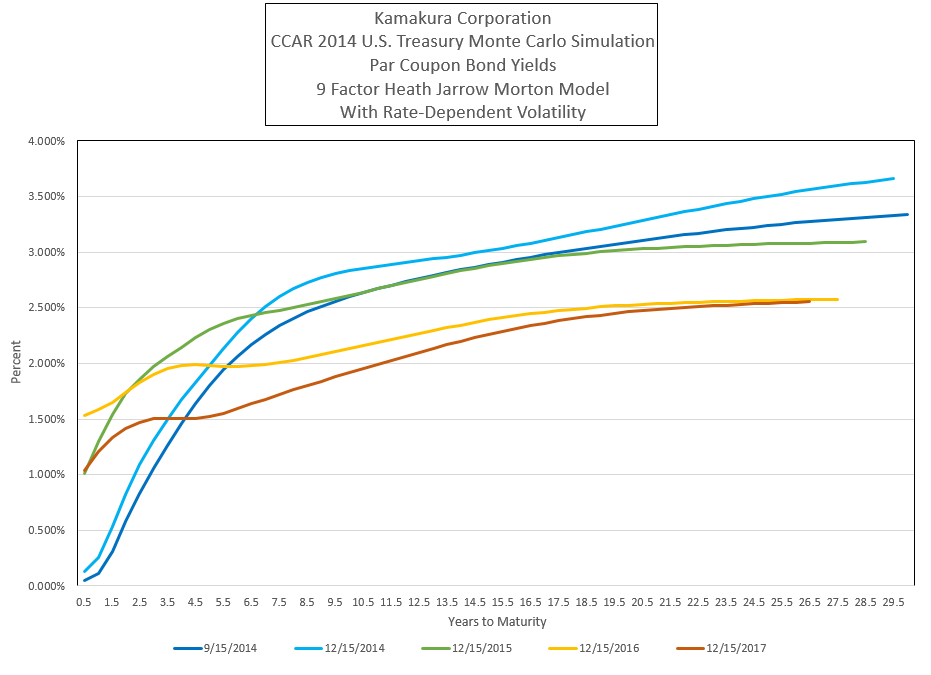
This graph shows the results of a single scenario stress test to the U.S. Treasury yield curve. The simulated yield movements over 13 quarters are generated by a Kamakura Risk Information Services 9 factor Heath Jarrow and Morton model with rate-dependent interest rate volatility. The parameters, which are available from Kamakura Corporation for use in Kamakura Risk Manager, are estimated using quarterly data from 1962 through June 30, 2014. The periodicity (quarterly) and time horizon (13 quarters) matches that of the Federal Reserve 2014 Comprehensive Capital Analysis and Review.
For more information on Kamakura Corporation's world-wide stress testing services using Kamakura Risk Manager, please contact Kamakura Corporation at info@kamakuraco.com.