It's How they make their pile
Their job is to negotiate big-volume stock transactions between “institutional” buyers and sellers at a level which automated “regular way” markets cannot handle. Hundreds to thousands of these “block trades” are arranged each market day. They typically drive day-by-day price changes in actively-traded stocks.
Public knowledge of the presence of these negotiations would immediately cause attempts to “front-run” the transaction, ensuring a gain by knowledge of the price changes likely to result. So they must be arranged quickly, in private, and publicly announced immediately when completed.
The traders and firms initiating these transactions are experienced and well-informed. As a result, it is rare for the MMs to have a “cross” where share volumes for both buyers and sellers can immediately be arranged without searching prospects for a balance. In upwards of 90% of the time, the MM firm is called on to become a principal in the trade to achieve that balance, and “fill” their client’s trade order.
MMs, like everyone, have limits to the capital they may put to work and to risk this way. So they only will “principal” a trade where they can arrange an economical hedging of the potential price-change risk they believe may be present. What they will pay for that price-change protection, and the way it is provided (usually by derivative securities), tells what potential capital damage they fear. Our experience in the MM world allows us to convert those hedging transactions into explicit price change expectation limits.
Those fears are well-informed in a MM community of over 100,000 employees world-wide, watching markets around the globe 24x7 and keeping the MM HQ’s analysts and evaluators instantly up to date on developments. Competition in that community is keen.
Score can be kept on how well the MMs appear to evaluate the price prospects for each stock in which they “facilitate” volume transactions. But a one-figure average covering their forecasts under all circumstances of coming conditions would be useless in an investing strategy designed to take advantage of changing prospects.
So we keep scores, stock by stock, at each level of the imbalance between upside and downside prospective price changes. The imbalances are recorded daily as Range Index [RI] measures of the percentage of the entire price range forecast which lies below the issue’s market quote at the time of the forecast. A 50 RI has as large an upside change (in size) as downside, and a 25 RI has 3 times as much upside prospect as down.
RIs can be useful by seeing what price change “norms” are generated historically in the subsequent 3-4 months following prior forecasts for that stock at the current day’s RI.
One key statistic is to see what proportion of all of its prior (today RI) forecasts had profitable buy outcomes when managed under a standard simple portfolio management strategy.
Experience suggests that “Win Odds” of less than 80 out of 100 may not produce outcomes with satisfying aggregate results. Even at 100 out of 100 history, there will likely be some disappointments. These are risk decisions being made under uncertainty.
To provide perspective, here are some Range Index measures of our forecast population numbering over 2,600 equities made at points in time of market index ordinary extremes. One is of lows back in mid-2016 and the other of highs in 2007.
Figure 1
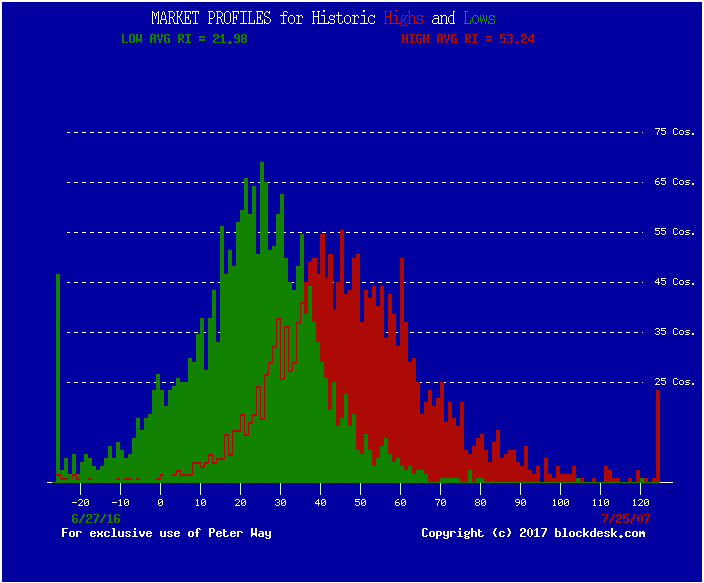
The horizontal scale is of RIs, including instances off its extremes. The population average RI at market extremes was 22 and 53. Few investors seek 50-50 reward-to risk propositions, so an upper risk prospect RI of 50 produces few “green” forecasts, and very few over 66 – a twice-as-much downside as up -- are present at all.
There is a willingness of institutional (and other big, often tax-sheltered) investors to hold securities being regarded in red as overpriced at times of market highs. We see this as a reflection of the inertia created (for several reasons) by a buy&hold investing strategy. It creates considerable opportunity for investors pursuing Active Investment strategies to profit from shorter holding-periods.
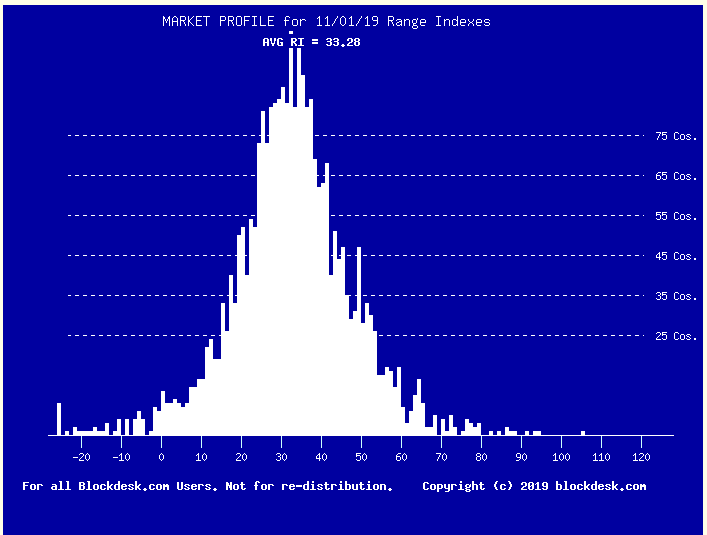
The current MM forecast Market Profile is comfortably near-center of a RI-average range of 22 to 53. It now is at 33. Please see Figure 2.
Figure 2
(used with permission)
Note the concentration now between RIs of 0 and 60, with few outliers below and above those extremes. This suggests a healthy market with upside prospects not immediately verging on fear-based price drawdowns. An average RI above 40 might suggest some caution, and selectivity (of issues currently held) for reduction where the issue’s Win Odds falls below 3 out of 4 (75 / 100) on a current forecast basis.
Seeing a current Market Profile develop like Figure 1’s red “evil twin” would strongly suggest cautionary portfolio measures. But those also call for continued watch for the reversion of the profile towards the green Figure 1 condition.
Figure 3 presents the MM current Reward-Risk tradeoff picture for all cap size ETFs in an effort to be inclusive. Since its focus is entirely on ETFs, the risk-limiting diversity of the security type is evident, and so is their return-generating limitation. This makes direct comparisons with much broader Figures 1 & 2 a bit more difficult since it is in single-issue stocks where both variations in price-change Reward and Risk are most prevalent.
Figure 3
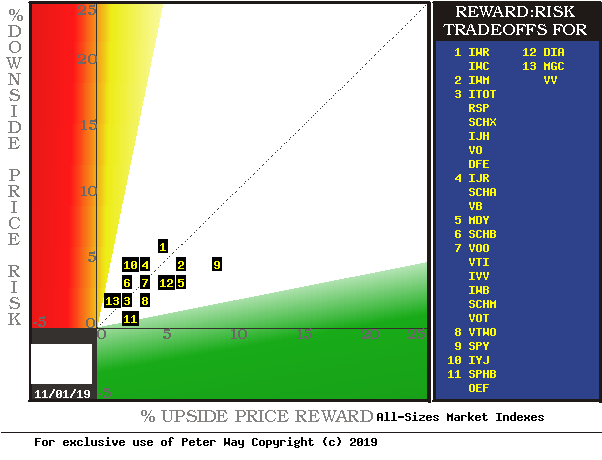
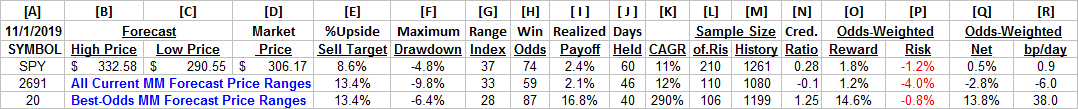
The most advantageous member of this group is SPDR S&P500 Trust ETF (SPY) at location [9]. Right now it appears that there is little opportunity on the buy side for exceptional gains in most of these ETFs. Figure 4 presents the past 6 months trend of daily MM price range FORECASTS for SPY.
Figure 4
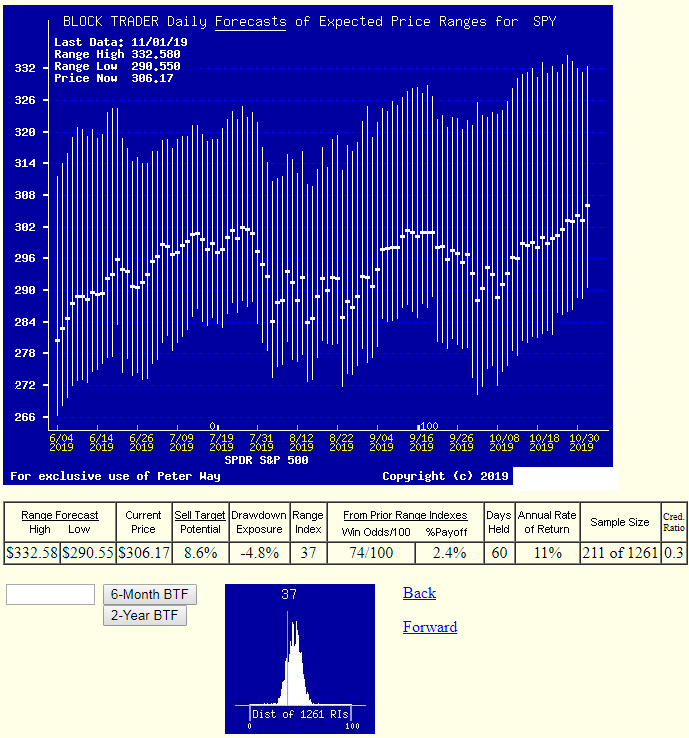
Here there are several examples of the investment-decision supporting history elements like Win Odds referred to in the above discussion of Range Indexes. The vertical lines spanning each market day’s price range forecast and the day’s close price make the upside-downside balance visual.
The small lower picture presents the frequency distribution of SPY’s RIs in the past 5 years’ 1261 market days. Clearly the bulk of those forecasts have been at higher RIs (and higher market prices in most cases).
Figure 5 uses the data row from SPY in Figure 4 to make the comparison between the Market Profile of Figure 2 and specific issue price-change opportunities illustrated by SPY. With a forecast population of some 2,700, and many individual investor portfolios holding 20 or fewer issues, the identification of that many attractive equities is quite possible.
Figure 5
Each day the MM forecast population is evaluated this way and ranked on the basis of each security’s odds-weighted prospect of profitability in the coming 3 months or less. Those potentials are clearly for shorter-term holdings, not the long-term notions on which most investors base their retirement and old-age hopes.
It is unfortunate that many such long-term plans have resulted in likely-to-be inadequate prospects, partly due to increased life expectanties, but also due to under-expected investing performances. Some investing deficiencies are due to inevitable disappointments from decisions which must be made under uncertainty.
But an important part of the problem lies in the widespread acceptance of an investment strategy which worked for a prior-investors generation in the prior century. The problem is “buy&hold”, often “never sell” strategy which denied much opportunity to remedy developing or developed mistakes until, with time gone, it was too late to recoup.
Instead, an Active Investment strategy, of which there are many, provides the needed opportunity to make that third resource – the often ignored and abused one: TIME – a most powerful ally.
It requires a sense of perspective about what potentials exist – within time horizons which actually are forecast-able in today’s increasing technologies and internationally competitive business practices. Those horizons are not measured in multiple years. Sometimes not even in full years, due to market price actions.
Conclusion
The overall equity market is healthy and due to rise further, despite being at or near record levels by some measures. While many stocks are not “cheap” a few we have just identified are, and when bought for objectives likely in a few months, they can be attractive portfolio wealth-builders.
Disclaimer: Peter Way and generations of the Way Family are long-term providers of perspective information, earlier helping professional investors and now individual investors, discriminate between wealth-building opportunities in individual stocks and ETFs. We do not manage money for others outside of the family but do provide pro bono consulting for a limited number of not-for-profit organizations.
We firmly believe investors need to maintain skin in their game by actively initiating commitment choices of capital and time investments in their personal portfolios. So, our information presents for D-I-Y investor guidance what the arguably best-informed professional investors are thinking. Their insights, revealed through their own self-protective hedging actions, tell what they believe is most likely to happen to the prices of specific issues in coming weeks and months. Evidences of how such prior forecasts have worked out are routinely provided in the SA blog of my name.