Today we are going to take a look at Albemarle Corp (NYSE:ALB) through the lens of FAST Graphs, fundamentals analyzer software tool. Headquartered in Baton Rouge, Louisiana, Albemarle Corporation, is a leading global developer, manufacturer, and marketer of highly-engineered specialty chemicals.
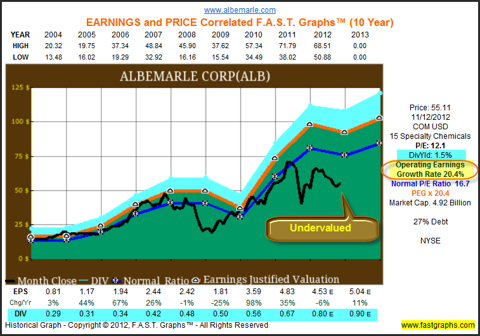
A quick review of the 10-year historical graph shows Albemarle Corp to be undervalued based on historical earnings growth. Analysts are forecasting Albemarle Corp to grow at 12% with a current dividend of 1.5%. This may be a good time for prudent investors to take a closer look at this company by conducting their own due diligence.
Earnings Determine Market Price: The following earnings and price correlated FAST Graphs clearly illustrates the importance of earnings. The Earnings Growth Rate Line or True Worth Line (orange line with white triangles) is correlated with the historical stock price line. On graph after graph the lines will move in tandem. If the stock price strays away from the earnings line (over or under), inevitably it will come back to earnings.
Earnings & Price Correlated Fundamentals-at-a-Glance
A quick glance at the historical earnings and price correlated FAST Graphs on Albemarle Corp shows a picture of undervaluation based upon the historical earnings growth rate of 20.4% and a current P/E of 12.1. Analysts are forecasting the earnings growth to continue at about 12%, and when you look at the forecasting graph below, the stock appears undervalued (it's inside of the value corridor of the five orange lines - based on future growth).
Albemarle Corp: Historical Earnings, Price, Dividends and Normal P/E Since 2004
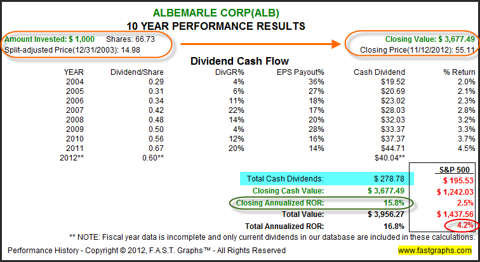
Performance Table Albemarle Corp
The associated performance results with the earnings and price correlated graph, validates the principles regarding the two components of total return: capital appreciation and dividend income. Dividends are included in the total return calculation and are assumed paid, but not reinvested.
When presented separately like this, the additional rate of return a dividend paying stock produces for shareholders becomes undeniably evident. In addition to the 15.8% capital appreciation (green circle), long-term shareholders of Albemarle Corp, assuming an initial investment of $1,000, would have received an additional $278.78 in dividends (blue highlighting) that increased their total return from 15.8% to 16.8% per annum versus 4.2% (red circle) in the S&P 500.
The following graph plots the historical P/E ratio (the dark blue line) in conjunction with 10-year Treasury note interest. Notice that the current price earnings ratio on this quality company is as low as it has been since 2004.
A further indication of valuation can be seen by examining a company's current P/S ratio relative to its historical P/S ratio. The current P/S ratio for Albemarle Corp is 1.78 which is historically normal.
Looking to the Future
Extensive research has provided a preponderance of conclusive evidence that future long-term returns are a function of two critical determinants:
1. The rate of change (growth rate) of the company's earnings
2. The price or valuation you pay to buy those earnings
Forecasting future earnings growth, bought at sound valuations, is the key to safe, sound and profitable performance.
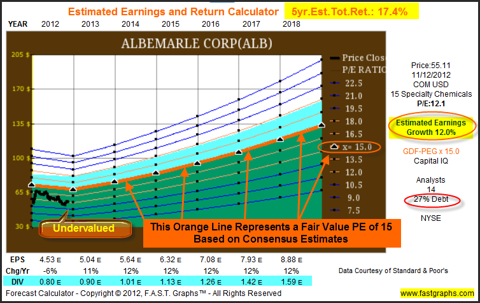
The Estimated Earnings and Return Calculator Tool is a simple yet powerful resource that empowers the user to calculate and run various investing scenarios that generate precise rate of return potentialities. Thinking the investment through to its logical conclusion is an important component towards making sound and prudent commonsense investing decisions.
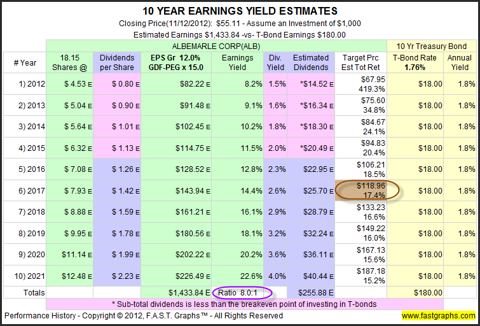
The consensus of 14 leading analysts reporting to Capital IQ forecast Albemarle Corp's long-term earnings growth at 12% (orange circle). Albemarle Corp has medium long-term debt at 27% of capital (red circle). Albemarle Corp is currently trading at a P/E of 12.1, which is inside the value corridor (defined by the five orange lines) of a maximum P/E of 18. If the earnings materialize as forecast, based upon forecasted earnings growth of 12%, Albemarle Corp's share price would $118.96 at the end of 2018 (brown circle on EYE Chart), which would represent a 17.4% annual rate of total return which includes dividends paid (yellow highlighting).
Earnings Yield Estimates
Discounted Future Cash Flows: All companies derive their value from the future cash flows (earnings) they are capable of generating for their stakeholders over time. Therefore, because Earnings Determine Market Price in the long run, we expect the future earnings of a company to justify the price we pay.
Since all investments potentially compete with all other investments, it is useful to compare investing in any prospective company to that of a comparable investment in low risk Treasury bonds. Comparing an investment in Albemarle Corp to an equal investment in 10-year Treasury bonds illustrates that Albemarle Corp's expected earnings would be 8 (purple circle) times that of the 10-year T-bond interest (see EYE chart below). This is the essence of the importance of proper valuation as a critical investing component.
Summary & Conclusions
This report presented essential "fundamentals at a glance" illustrating the past and present valuation based on earnings achievements as reported. Future forecasts for earnings growth are based on the consensus of leading analysts. Although with just a quick glance you can know a lot about the company, it's imperative that the reader conducts their own due diligence in order to validate whether the consensus estimates seem reasonable or not.
Disclosure: I have no positions in any stocks mentioned, and no plans to initiate any positions within the next 72 hours. I wrote this article myself, and it expresses my own opinions. I am not receiving compensation for it. I have no business relationship with any company whose stock is mentioned in this article.
Disclaimer: The opinions in this document are for informational and educational purposes only and should not be construed as a recommendation to buy or sell the stocks mentioned or to solicit transactions or clients. Past performance of the companies discussed may not continue and the companies may not achieve the earnings growth as predicted. The information in this document is believed to be accurate, but under no circumstances should a person act upon the information contained within. We do not recommend that anyone act upon any investment information without first consulting an investment advisor as to the suitability of such investments for his specific situation. A comprehensive due diligence effort is recommended.


