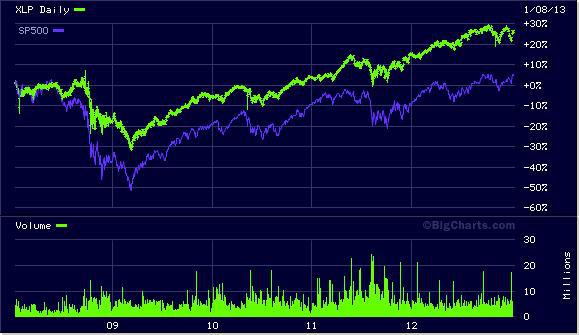
For the past five years the Consumer Staples Select Sector SPDR (NYSEARCA:XLP) has outperformed the SPDR S&P 500 (SPY). Consumer staples stocks are typically considered conservative dividend paying companies. This just shows how the so called boring stocks can actually turn out to be pretty exciting in terms of actual performance.
The XLP ETF pays a respectable dividend of 3% and has a low expense ratio of 0.18%. The fund is comprised of a collection of about 44 companies. The companies in the fund sell the products that consumers routinely use on a daily basis. These products include: food and beverages, household products, tobacco, and personal products.
The XLP fund had a return of 8.54% annually for the past 10 years, while SPY had a return of 6.27% annually over the same period. For the past five years, XLP returned 7.13% annually, while SPY returned only 1.26% annually. This shows how effective an investment in consumer staples stocks can be. Trying to beat the market has left many fund managers trading in vein, as some of them underperform the market and many merely match the market's performance. The XLP fund allows investors to beat the market with a diverse basket of stocks under just one ticker.
To understand the XLP, it would be wise to dig into the details, taking a look at the composition of the ETF. The top holding in XLP is Procter and Gamble (PG), which comprises 13.55% of the fund. P&G produces many famous brands that are household names: Braun, Head & Shoulders, Olay, Pantene, Gillette, Crest, Oral-B, Charmin, Pampers, etc.
The next largest holding is Philip Morris (PM) which comprises 10.4% of the fund. The company provides cigarettes and other tobacco products under famous names such as Marlboro, Virginia Slims, Parliament, etc. The company thrives on the nicotine addiction of millions of smokers.
The third largest holding in the fund is Warren Buffett's largest holding, Coca Cola (KO). Coca Cola comprises 10.39% of XLP. The company is more than just the product bearing its name. It represents about 89 beverage brands throughout the world. Its beverages include soda, flavored water, sports drinks, teas, water, fruit drinks, energy drinks, etc. Coca Cola is the company that hydrates the world.
The number four company in the fund is the low-cost retailer, Wal-Mart (WMT). Wal-Mart comprises 8.26% of the fund. The company's stores have been frequented by many price-conscience consumers looking to save money on regularly purchased groceries, health and beauty products, household goods, clothing, and more.
CVS Caremark (CVS) is the fifth largest holding in XLP, comprising 4.63% of the fund. This neighborhood pharmacy health care service provider allows consumers to fill their prescriptions, purchase a wide variety of convenient items, print photographs, get flu shots, and get diagnosed at minute clinics. It also provides pharmacy benefit management services, Medicare Part D services, discount drug purchase arrangements, etc.
Here's a glance at the top ten holdings in the fund:
Forward P/E Ratio | PEG Ratio | Price to Book Ratio | Operating Cash Flow | 5-Year Annual Expected Earnings Growth | |
Procter & Gamble | 16.11 | 2.16 | 2.98 | $13.89 Billion | 8.04% |
Philip Morris | 15.02 | 1.55 | N/A | $8.73 Billion | 10.63% |
Coca Cola | 16.95 | 2.33 | 5.00 | $10.51 Billion | 7.94% |
Wal-Mart | 12.71 | 1.52 | 3.12 | $27.25 Billion | 9.2% |
CVS Caremark | 13 | 1.1 | 1.7 | $5.76 Billion | 13.3% |
Pepsico | 16.06 | 4 | 5.04 | $8.23 Billion | 4.3% |
Altria Group | 13.74 | 1.93 | 16.70 | $3.17 Billion | 7.63% |
Colgate Palmolive | 18.23 | 2.31 | 20 | $2.97 Billion | 8.6% |
Costco | 20.11 | 1.78 | 3.48 | $3.5 Billion | 12.66% |
Mondelez | 17.28 | 1.56 | 1.32 | $5.03 Billion | 12.14% |
We can see from the table above that most of the top ten holdings are fairly valued. Since the businesses of consumer staples companies remain relatively consistent and stable, there are few surprises that would cause their stock prices to deviate from a fair valuation.
The operating cash flow of these companies remains robust, which allows for increases in dividend payments year-over-year. This contributes to XLP's dividend of 3% as compared to SPY's yield of 2%.
The average annual 3 to 5 year estimated earnings growth for the 44 companies in the XLP ETF is 9.49%. This is slightly higher than the expected annual earnings growth for the S&P 500 of 9.09%. The slight edge in earnings growth and yield give the XLP the advantage in outperforming the market. Although the phrase 'consumer staples' may invoke yawns, the sector's outperformance over the S&P 500 actually makes it quite exciting for investors.
Disclosure: I have no positions in any stocks mentioned, and no plans to initiate any positions within the next 72 hours. I wrote this article myself, and it expresses my own opinions. I am not receiving compensation for it (other than from Seeking Alpha). I have no business relationship with any company whose stock is mentioned in this article.