First things first: what about emphasis on AMZN vs. FB
We’ll get to some of the broader strategic questions above later in separate articles. For now the focus is on portfolio wealth-building or capital gain choices between Amazon.com, inc. (NASDAQ:AMZN) and Facebook, Inc. (FB).
Our perspective, as usual, draws on the actions of the Market-Making community [MMs] as they seek to provide transaction liquidity for major institutional-investor funds typically managing Billion-dollar equity portfolios. Particularly in times like these their desires to make volume adjustments to their holdings takes on an additional sense of urgency.
In ordinary times their size precludes participating in ordinary “regular-way” auction markets. They live in a “deal” world where “other side” of their desired trade gets lined up by the MMs in private negotiations with other like-sized players so the entire “block” trade gets executed at one price, at one time, for all participants.
Usually a “cross” of instantly-balanced sellers and buyers is not available. So, the MM faced with the big-bucks trade order may stop being just a sales agent, and become a principal by “filling” the imbalance and thus putting their own MM firm capital at risk of unwanted market price moves. That will only happen (and most often does) when a separate hedging deal in separate derivatives markets transfers that risk to other willing speculators. Those often are proprietary-trade desks of other MM firms.
The cost of that equity-market liquidity is borne by the trade-initiating institution, in a part of the spread between what was initially sought as a transaction price, and what can actually be done of the moment. Their acceptance acknowledges the reality of what has been negotiated (but not yet closed) between the MM buyer and the prop-trade seller of the price insurance.
Once the block trade is consummated, its price is posted on the public “regular way” markets to maintain transaction transparency. For stocks and ETFs thus involved, it is the “deal” markets run by the investors with big money muscles that lead the price parade, and the public investors simply follow along.
The hedge price-change insurance deal’s terms define the extremes of prices likely to occur during the lives of the derivatives contracts involved. In turn, prior experience with earlier, similarly proportioned forecasts provide a present perspective on what may be coming for prices in next near-term (3-6 months) markets.
Here in Figure 1 is what those forecasts for FB have been showing, daily, during the past 6 months. All materials presented here have been approved by blockdesk.com.
Figure 1
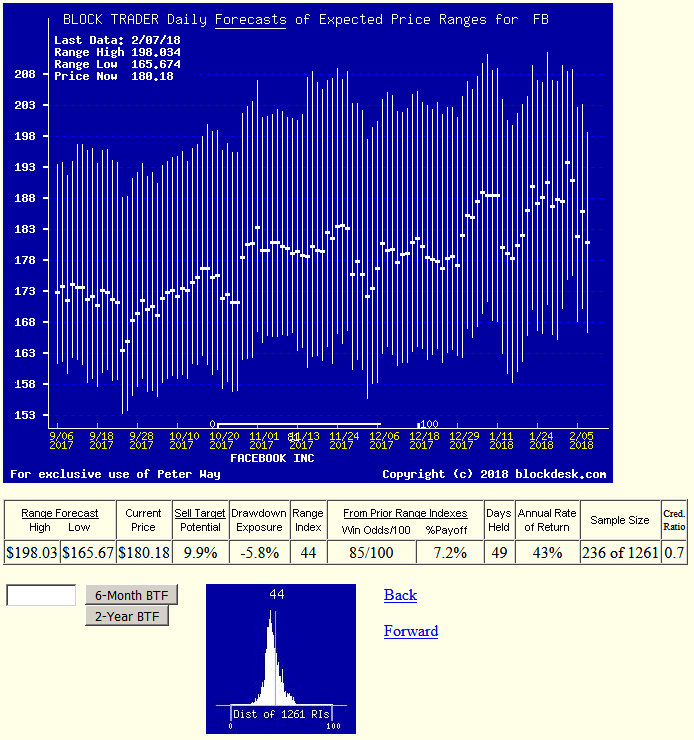
Note: This is not a conventional price history “chart”. It is a record of MM live-date forecasts of the stock’s near-term (3-4 coming months) range of likely prices. Forecasts were made on the dates indicated, not after the fact. The vertical price-range forecast lines of Figure 1 are split into upside and downside prospects by the heavy-dot end-of-day market quote for the issue on the day of the forecast.
A measure of the imbalance between up and down possible price change implications is the Range Index [RI], which tells what percentage proportion of the entire forecast range lies below the current price. The thumbnail picture at the bottom of Figure 1 presents the distribution of RIs for the stock seen in the past 5 years.
FB’s current RI of 44 is part of its central set of experiences, suggesting that for the stock to look more attractive in comparison to its own history it might need to see RI values in the mid- to low- 20’s. They could occur either from continued expectations of rising price ranges while the price stood still, or from price pullbacks not followed by expectations of coming price ranges.
What has actually happened to FB’s price following 236 of its past 5 year’s MM forecasts having RIs like today's is shown in the row of data between the two pictures of Figure 1.
The first 3 items in that row make price-explicit the proportions of the last-right vertical of the upper picture. The upside Sell Target Potential is the % difference between the High Forecast and the Current Price.
Following the portfolio management discipline of TERMD (explained here) the 236 prior 44 RIs of FB had net position closeout payoffs of +7.2% in average holding periods of 49 market days (1 day short of 10 weeks), producing a compound annual gain rate [CAGR] of +43%.
During the holding periods seeking the upside sell targets of the prior forecasts the worst price drawdown experience in each case averaged -5.8%. Only 15% of the 236 forecasts at the end of the 3-month time limit on holding under TERMD were still below their entry costs. The other 85% (very good) recovered and were profitable, more than offsetting the losses of the 15%. The resulting +7.2% gives a credibility ratio of 0.73 to the current upside sell target forecast of +9.9%.
Let’s see how well all that compares to what the MMs think their clients are likely to do with AMZN’s price in the same coming time forecast. Figure 2 will tell of that.
Figure 2
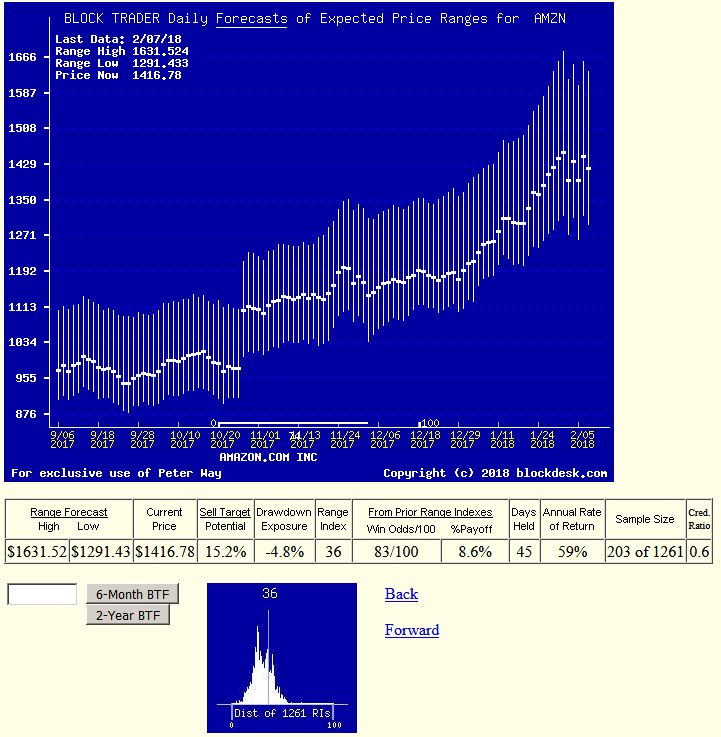
AMZN’s past 6 months of daily MM forecasts show a more distinct upward trend than those of FB. And an upside prospect of +15.2% offers larger gain potentials than FB’s +9.9%, with a smaller interim price drawdown exposure of -4.8%. The Win Odds of 83 out of each 100 is slightly less than that of FB’s outstanding 85 of 100.
The current Range Index for AMZN of 36 is lower (more upside potential) than the 44 of FB, but a check of their past 5-year histories shows that in terms of prior RI experiences, the present positions are not all that different. AMZN has a bit broader array of RI experiences, suggesting that there are wider evaluation opportunities here (in each direction) than in the case of FB.
One dimension where AMZN has had an advantage over FB is in terms of its “speed” of prior accomplished % payoffs at current RI levels. FB positions took almost ten weeks to “hatch”, while AMZN’s brood did it in only 9, or 45 market days. That improvement shows up in a way not well illustrated by Figures 1 and 2, but is expanded upon in Figure 3.
Figure 3
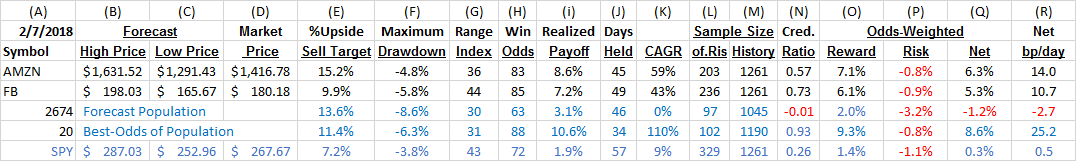
The data in Figure 3 for AMZN and FB in columns A through N is directly from Figures 1 and 2, positioned for easier comparability.
Columns O and P use the decimal fractions of Win Odds in column H and its complement (1.00 – H) to weight the Realized Payoffs of column I and the Drawdowns of column F. Then column Q sums O and P to get a net Reward minus Risk tradeoff figure.
To make the comparisons complete, the ability to compound the results of column Q needs to reflect the “speed” of each row’s accomplishment by including the data of column J – the average days held -- to accomplish the net of Q.
That is what is shown in column R, expressed in the terms frequently used in financial circles: basis points per day. A basis point is 1/100th of a percent. For reference, 19 basis points sustained for 365 days produces a double of the capital or subject of attention. This is the "magic" of compounding.
With the heroic assumption that the future will be matched by the data of the past, there now is a common basis of comparison for many complex processes. Like investing performances.
Used this way, AMZN has significant desirability over FB as a today-choice if only one could be used.
But on a broader field, other comparisons are offered by Figure 3.
A plain-vanilla S&P500 market-index investment via SPDR S&P500 Index ETF (SPY) offers up a weak ½ bp/day. FB is 21 times better than that. The average of over 2700 stocks and ETFs for which we have acceptable data inputs offers the potential for net loss of capital if swallowed whole, blindly.
Careful selection of the 20 likely most productive choices from the 2731 (the top not-quite 1%) boast an average CAGR of over 100%, the equivalent of +25.2 bp/day. The accumulated performance of the daily selections of top 20 issues since 12/31/2015 are shown in this article and on my SA blog, following TERMD portfolio management discipline, in comparison with buy&hold of SPY.
Addendum: Market Decline Impact of 2/8/2018
As originally prepared this article reflected on the market situation of 2/7/2018, but was not through the editing process before the -3% to -4% declines on 2/8/18 of market indexes and individual stock quotes became available. Those changes provide some important considerations, and are reflected in Figure 4.
Figure 4
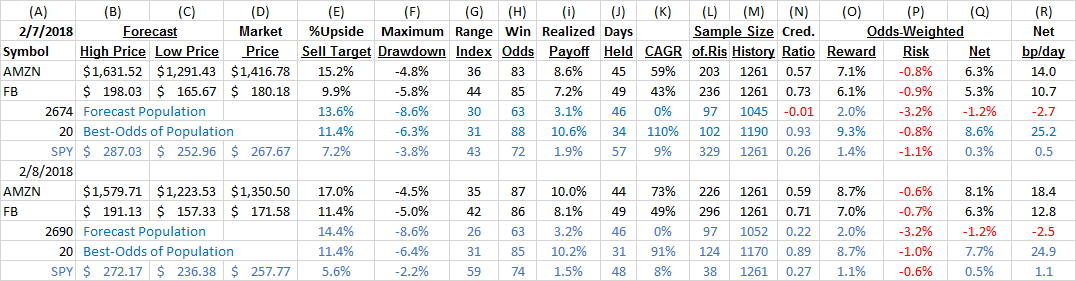 Market declines may impact specific stocks or ETFs quite differently. FB and AMZN currently have been enjoying strong forward-looking price prospects, as seen in column E of both Figures 3 and 4. Figure 4 repeats the entire content of 3 for convenience, and updates it completely.
The day's events reduced market prices and coming price expectations for both FB and AMZN, but reduced forecast price expectations by less than prices. This expanded the upside prospects for both stocks from their new market quotes; from +15.2% to +17% for AMZN, and from +9.9% to +11.4% for FB.
This was not the case for SPY, which saw MM community forecasts drop ~$15 while its market price declined only -$10. That cut its % Upside price change potential from a +7.2% on 2/7 to only a +5.6% on 2/8. The SPY Range Index (column G) rose from 43 to 59. Instead of having a somewhat larger upside than downside yesterday, it now has an even larger downside than upside.
In short, the two stocks have been helped in the day's revaluations, while the most-followed market-index ETF has been injured. Does this bode ill for the overall market outlook?
We think not, because every day we compile a distribution of Range Indexes for our entire forecast-able population, now of 2,690 stocks and ETFs. It shows how market professionals are evaluating this extensive collection of the most widely-held and actively-traded equity securities.
Major market-price changes in these issues, like happened today (2/8/2018), may be accompanied by changes in the implied price forecasts of the equities. If the forecasts decline more than the securities prices, the Range Indexes will rise, indicating a building apprehension in the institutional community over what may be coming.
That has not happened for the bulk of equity securities, like FB and AMZN, whose RIs have declined slightly. Figure 5 shows the market's RI Profile at the close today, 2/8/2018.
Figure 5
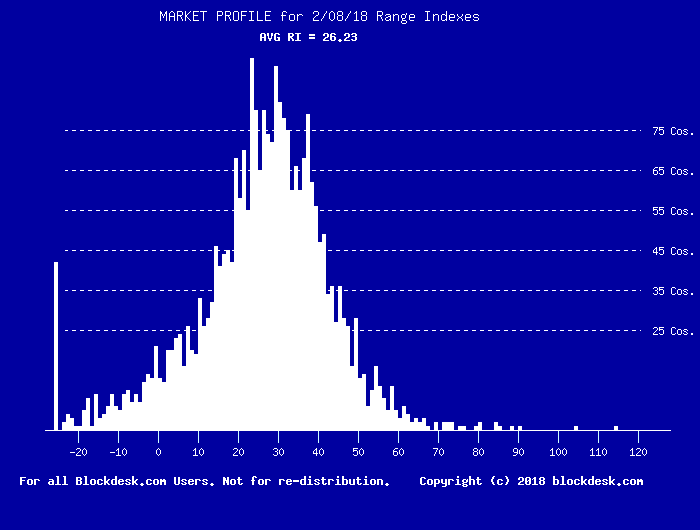 For comparison, here is what the Market Profile looked like a few weeks ago, when SPY was @279.16, 8.3% higher.
Figure 6
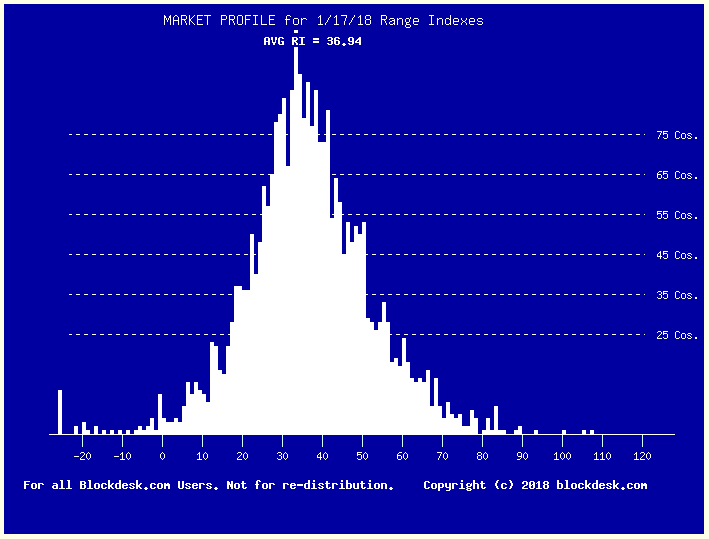 As prices of the forecast population declined by more than 8%, their price forecasts declined less, so their Range Indexes shifted from an average of ~37 to now an average of ~26.
Please note in the earlier-dated profile (figure 6) the presence of many more issues with RIs of 50 or more, ones where the outlook was as great or greater for downside price changes than upside change.
Compare that now with their scarcity in Figure 5.
At the opposite extreme (of potential opportunity) note in Figure 6 the limited number of securities with negative RIs, where the current price is actually below the range of prices indicated as justifiable in coming months.
The Figure 5 comparison shows a profusion of these potential bargains, including the spike of those so under-priced they run off the scale at the left.
Conclusion
The market may continue a limited fear-driven decline further, but unless there is a major shift in expectations from the big-money institutional investors now being evidenced by the Market Profile, the current decline appears to be a buying opportunity for wealth-building investors.
For wealth-building investors, or those needing capital gains to augment insufficient portfolio dividend income, the choice between FB and AMZN currently favors AMZN. But when compared to broad market investment alternatives like SPY, FB is a very desirable next choice after AMZN.
These pictured forecast histories were regularly produced by competent, involved market professionals, reinforced by MM internally-employed evaluators, and following the lead of big-money institutional portfolio-manager trade orders.
Please remember this is a near-term evaluation, suggesting CAGR price gain opportunities far above multi-year trendline price growth street estimates for the group. What may appear as more attractive in a few months, providing future price-compounding capital growth opportunities may be very different from the then less attractively-priced current investment competitors. An updating follow-up visit to the group is advisable.
Additional disclosure: Peter Way and generations of the Way Family are long-term providers of perspective information, earlier helping professional investors and now individual investors, discriminate between wealth-building opportunities in individual stocks and ETFs. We do not manage money for others outside of the family but do provide pro bono consulting for a limited number of not-for-profit organizations.
We firmly believe investors need to maintain skin in their game by actively initiating commitment choices of capital and time investments in their personal portfolios. So our information presents for D-I-Y investor guidance what the arguably best-informed professional investors are thinking. Their insights, revealed through their own self-protective hedging actions, tell what they believe is most likely to happen to the prices of specific issues in coming weeks and months. Evidences of how such prior forecasts have worked out are routinely provided.