Apple's (NASDAQ:AAPL) stock has rallied by nearly 20% since its Jan. 3 lows. Now the technical chart suggests that the stock can continue to recover to as high as $182. The company delivered first quarter results that were in line with its lowered guidance. However, more important was that fiscal second quarter revenue guidance was only 3.5% below analysts' consensus estimates, not the disaster the stock was indicating.
On Jan. 16, I wrote an article noting that Apple's stock was witnessing bullish momentum due to a bullish chart and options activity. Since that time, the stock has risen by 10%.
Bullish Chart
Now the chart suggests the stock continues to rise to as high as $182, an increase of an additional 7% from the current price of roughly $170 on Feb. 4. The chart shows that the stock has broken above a critical level of technical resistance at $164 and is now heading toward its next level of technical resistance at $182.
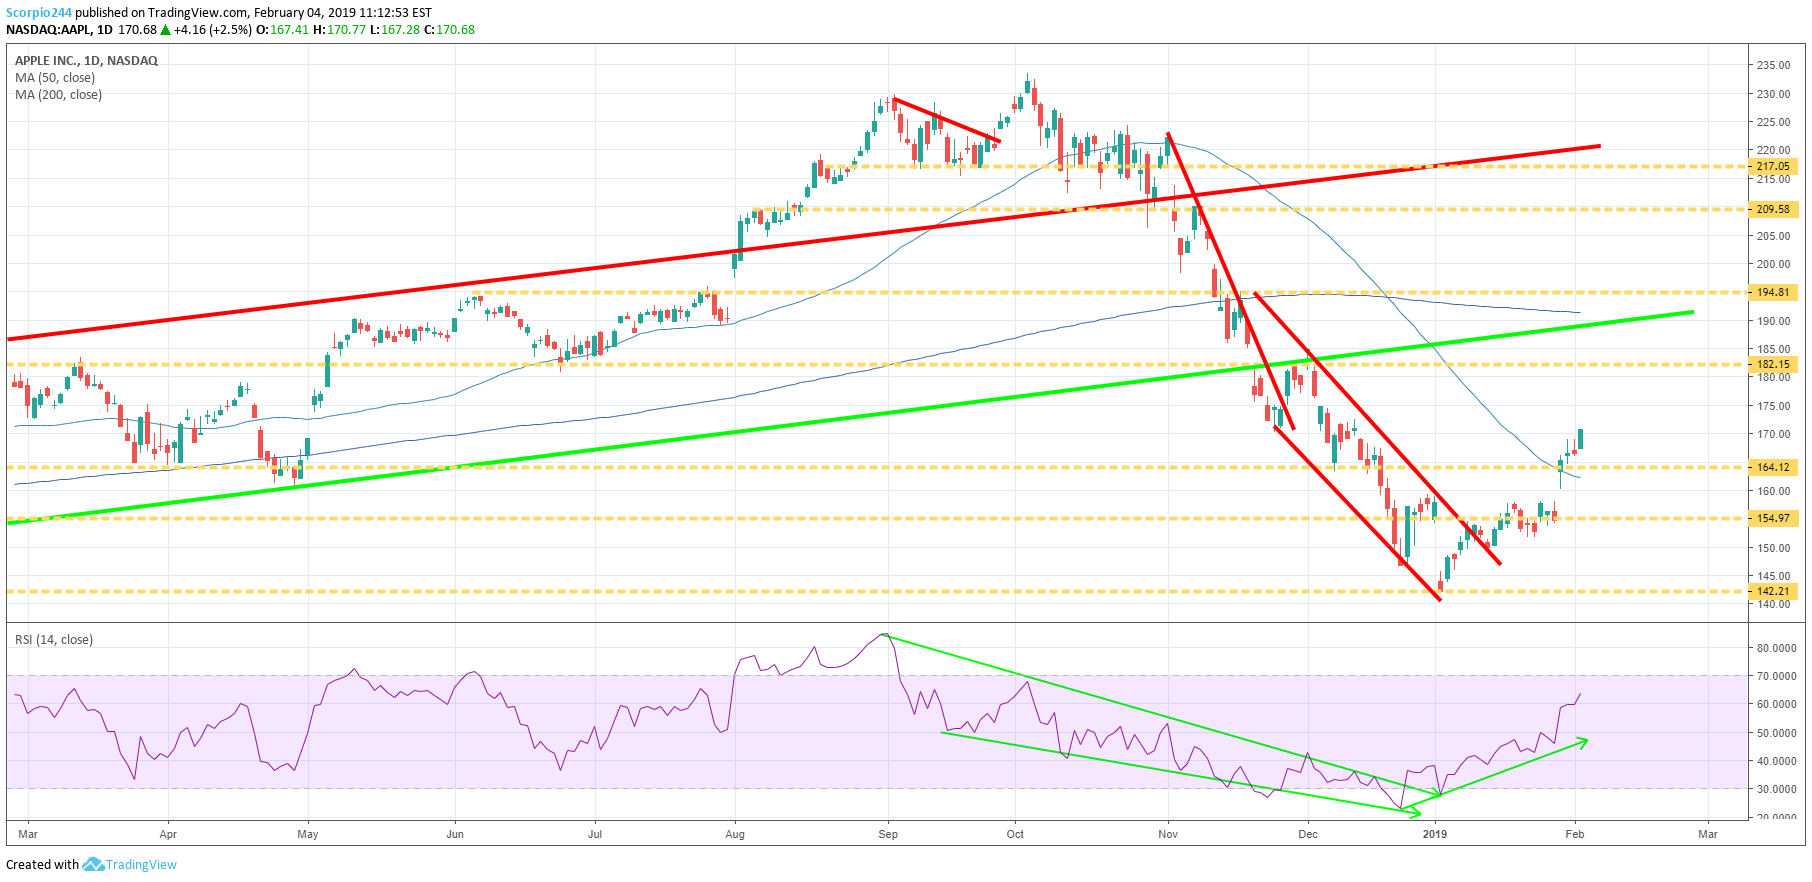
Additionally, the relative strength index has broken out of a vicious downtrend at the end of 2018. Now the RSI is trending sharply higher and is currently around 60. It would have to rise to 70 or higher before being considered overbought. It too would suggest that the stock has further to increase.
Strong ex-China
The company results were strong outside of China. The Americas saw robust growth in the quarter, rising 5% to $36.9 billion versus last year. Revenue in Japan and Europe fell 4.5% and 3%, respectively. However, China revenue fell a stunning 27%.
When digging a bit further into those results, we find that it was only the iPhone that saw revenue contract in the quarter, falling 15.5% to $51.9 billion from $61.5 billion every other segment of revenue grew. Wearables had the largest growth rising 33% to $7.3 billion and is now just a hair behind Mac in sales of $7.4 billion. Wearables could be the company's third-largest business segment by the end of the second quarter if its current pace of growth continues.
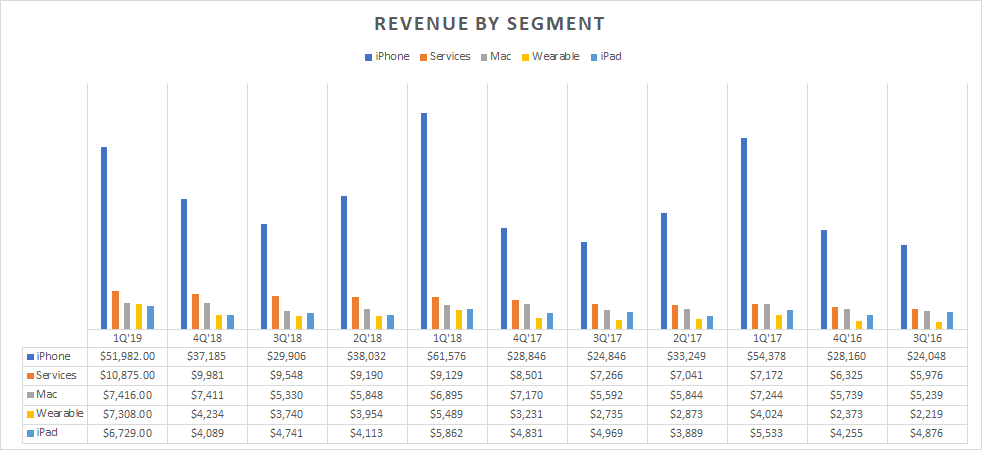
(Mott Capital, Data compiled from Apple)
Batteries
Outside of the trade war being one of the primary reasons for the weak iPhone sales, the company noted on the conference call one reason why consumers were holding on to their iPhones longer was due to the battery replacement program Apple put in place last year. We noted in our previous article that the number of battery replacements might have been as high as 11 million users.
Results Not as Bad as Expected
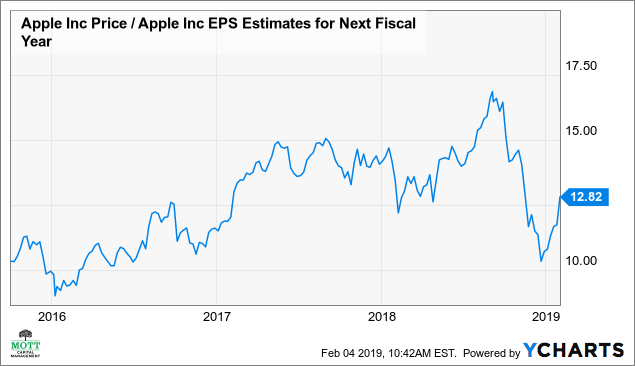
Investors appeared to be betting that Apple's results and the slowdown would be far worst. We can support that claim by using the stock's valuation as a barometer. The one-year forward PE ratio hit its lowest levels since June 2016. Should the stock's valuation return to its historical levels of the past two years of about 14, the shares could rise to around $182, using consensus earnings estimates of $12.99 in 2020. That's the same price that the technical chart suggests.
Risks
Apple's stock may continue to see bullish momentum, but should the stock pause or pull back, it's likely to fall to around $164, back to technical support. Additionally, should the trade war between the US and China intensify, there's a chance that Apple's iPhone could be subject to tariffs, a cost that the company would either have to pass on to its consumers hurting sales further, or a cost the company would need to take on, hurting margins and earnings.
Continue to Rise
For now, momentum in the shares continues to be positive and appears to have gotten to levels that were far too low. Should the trade war between the US and China finally be settled and iPhone sales in China improve, then the stock can likely rise well beyond the $182 the chart is suggesting.
Mott Capital Management, LLC is a registered investment adviser. Information presented is for educational purposes only and does not intend to make an offer or solicitation for the sale or purchase of any specific securities, investments, or investment strategies. Investments involve risk and unless otherwise stated are not guaranteed. Be sure to first consult with a qualified financial adviser and/or tax professional before implementing any strategy discussed herein. Upon request, the advisor will provide a list of all recommendations made during the past twelve months. Past performance is not indicative of future results.