Welcome to my monthly update for my dividend growth portfolio. This article series covers my investing journey as a father of two towards my eventual retirement. Any specific stocks or amounts are particular to my self-directed 401(k) plan.
The goal of my portfolio is to generate a growing income stream for me and my wife during our golden years. The aim is to live off dividends without touching the principal. Dividend growth stocks are the chosen vehicle to meet that goal. At 33, I have approximately 26 years before I can (safely) touch any of this money.
For anyone interested in seeing changes in real time, I have my portfolio and dividends tracked on Dividend Derek. I also have a trimmed version that you can freely take for yourself if you wish, found here.
I've received some questions in the past, so you can save off a copy by selecting "File" -> "Make A Copy."
Change Log
With a tome over 5,000 words it can be easy to miss things as they change from month to month. I decided to include a high level change log to point you the relevant non-data changes. Things like dividends collected, dividend increases and charts will all change each month regardless.
- Created a change log
- Fleshed out my "Target Portfolio" and "Actual Portfolio" reasoning
- Updated my forward looking goal
- Added additional buy criteria (using investment framework questions)
- Added additional sell criteria (regarding over-valuation)
- Added an ETF correlation chart and commentary
- Added a section for any options trades
Commentary
February saw the continued rally in equity markets with the S&P cresting over 2,800 by March 1. Several of my stocks continue to cruise to either all-time highs or back to their 52 week highs (CSCO, ABT, SBUX and NKE to name a few).
While it's always great seeing my portfolio return to levels last seen at the end of September, I'm not feeling particularly bullish. That's not to say I'm not participating in the 2019 gains, maybe what I mean to more aptly say is I don't trust this rally.
There's plenty of arguments on both sides as to why the market will or won't do X next. On one side, the Fed has stopped plans of raising rates and reducing the balance sheet. A trade breakthrough with China could be coming quite soon.
On the other hand, what weakness is the Fed seeing that caused them to shift their plans? Trade talks stalling once again or even impeachment proceedings could derail all of this. Another point not being given enough light is the real possibility of an earnings recession.
The point being, it's important to be vigilant and be aware of where we are at all times. Valuations are high once more and it will take continued earnings growth to push the indices higher.
I'll cover it below but I have taken steps to pull back on domestic equity exposure should we fail to push higher. I've also been adding into different asset classes than just domestic large cap stocks.
Target Portfolio
I covered in January my desire to calculate what I see as my target portfolio. This would be how I allocate money across different equity (not asset) classes. I'm an equity guy and things like commodities, currencies or bonds don't really interest me.
As a sample, I whipped up what a target may look like for me. I have decades to go so I have a healthy 20% portion allocated to growth stocks. This scratches my itch for having shares in Berkshire (BRK.A) and the FANGs of the world. I'm also optimistic that at least some will be the dividend growers of the future (I'm looking at you Alphabet (GOOG)).
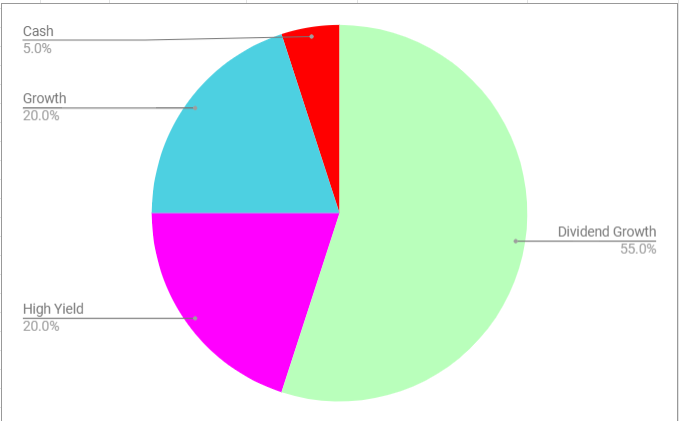
Next is an equal part of high yielding stocks. Another 20% is allocated here. These are the high yielders that will function as the income portion of my dividend machine. Dividends will not be reinvested but will be tactically allocated to the best investment idea at the time. Consider it "active compounding". It also helps me shore up my "balance sheet" by having more cash being generated alongside my regular 401(K) contributions.
The main portion of the portfolio at 55% is core dividend growth. This is where I am to pick names that I expect to surpass the high yielders decades down the road. I would consider names like Apple (AAPL), Nike (NKE) or Home Depot (HD) to be generational winners.
Lastly, I moved the goalpost this month and added in a dedicated 5% cash slice. I think for any "active" investor there must be some cash on the sidelines at all times for opportunities that present themselves. Frequently these opportunities may only last a day and with no cash available either leads to a missed opportunity or a need to scramble to sell something else.
Another way to view the core portfolio would be through a Venn diagram across the three equity categories.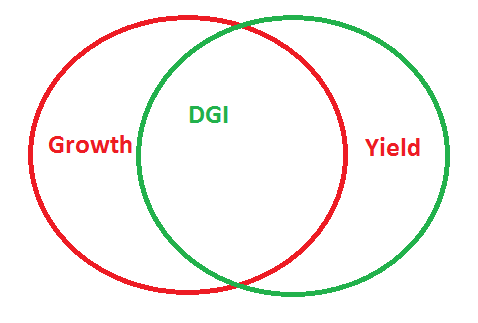
For illustrative purposes I specifically have the circles overlapping most of the area to highlight the main focus on dividend growth stocks.
Actual Portfolio
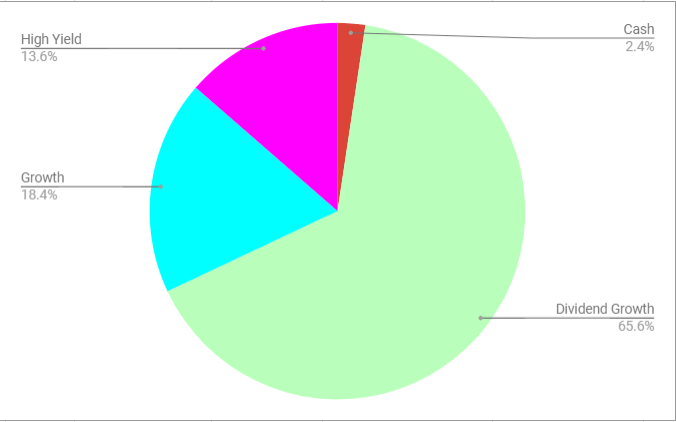
The original version of the "actual" pie chart was close to my target; high yield was only 9% and growth was at 18%. Cash made up about 6% of the portfolio.
In February I took about 3.5% of my cash and added it directly to the high yield slice. I'll cover the specific transactions below. I also removed the "former Dividend Growth" slice that only contained CVS. At the time of purchase it did fall into the Dividend Growth basket so that's where it will remain, current frozen dividend status notwithstanding.
The classifications are completely subjective but here is how I grouped them. One example of the subjective nature is Altria (MO) is pegged as a dividend growth stock but AT&T (T) is high yield. Their current yields are about the same but the growth rate of T's dividend is barely beating the rate of inflation, if at all.
| Ticker | Classification |
| AAPL | Dividend Growth |
| ABBV | Dividend Growth |
| ABT | Dividend Growth |
| AMP | Dividend Growth |
| AMZN | Growth |
| APLE | High Yield |
| BRK.B | Growth |
| CMI | Dividend Growth |
| CSCO | Dividend Growth |
| CVS | Dividend Growth |
| DIS | Dividend Growth |
| EFAS | High Yield |
| FB | Growth |
| GLW | Dividend Growth |
| GOOG | Growth |
| HD | Dividend Growth |
| IQ | Growth |
| ITW | Dividend Growth |
| JNJ | Dividend Growth |
| JPM | Dividend Growth |
| KWEB | Growth |
| MA | Dividend Growth |
| MDT | Dividend Growth |
| MLPA | High Yield |
| MMM | Dividend Growth |
| MO | Dividend Growth |
| NKE | Dividend Growth |
| PCEF | High Yield |
| PRU | Dividend Growth |
| SBUX | Dividend Growth |
| SCHB | Growth |
| SCHD | Dividend Growth |
| SDEM | High Yield |
| SDIV | High Yield |
| SKT | High Yield |
| SQ | Growth |
| SRET | High Yield |
| STAG | High Yield |
| SWK | Dividend Growth |
| T | High Yield |
| TROW | Dividend Growth |
| TRV | Dividend Growth |
| UTX | Dividend Growth |
| V | Dividend Growth |
| WPC | High Yield |
Additionally, I've been researching higher yielding ETFs to expand my exposure into areas such as BDCs, mREITs and CEFs. I may eventually cherry-pick a few names to have as individual holdings. Right now, I'm not where I want to be with my knowledge.
To quote myself from last month, this is precisely what I did in February. We'll cover the transactions but I added several yield ETFs.
2019 Goals
- I want my dividend growth holdings to have an average dividend growth rate of at least 7%.
- By the end of 2019, I want to have a projected dividend income of at least $9,000 (was $7,900). Changed in February.
- I want to suffer no dividend cuts.
I suspect that the dividend growth hype of 2018 will not completely carry over to 2019. Yes, profitability is still up from the tax plan but I expect increases to be a little more muted. I'm going to keep my goal at 7%.
I want to clarify the growth rate target, which has to exclude what I'm classifying as "high yield." I'm not buying a REIT with any expectation that it will grow its dividend 7% per year.
Currently the growth rate is 11.2% after a fat month of dividend increases, most notably by Home Depot.
I calculated my target income by assuming my existing projected income ($6,450) grows by 7% organically. That would take the income to $6,900. Additionally, I am assuming that all new contributions (mine and company match) buy an initial yield of 3%. Adding $720 to $6,900 gives me about $7,600.
After February my forward looking income is $7,934. This already eclipses my goal that I set at the beginning of the year. I'm going to upward revise my goal to $9,000. At the time I created my goals having a defined high yield section was not a reality (though I had been pondering on the idea for much of December).
I also noticed that my overall portfolio yield was quite low at the time (about 2.3%), taking my projected income divided into my overall portfolio value. I did bump up the yield to just about 2.7% which many will note is still low. It is higher than what the S&P is offering however. That includes the growth portion of the portfolio however, backing that out the yield jumps to about 3.3%.
I haven't gone so far as to define a target portfolio yield but perhaps I should explore that idea some.
Lastly, no dividend cuts! There have been many notable dividend cuts lately most recently with Kraft Heinz getting investors the trifecta of a major write-down, downward guidance and dividend cut.
Portfolio Strategy
Buying Criteria
These are the general guidelines I will review to see if something is worthy of adding to my dividend portfolio or whether I will add to an existing position.
- Being a member of David Fish's Dividend Champion, Challenger and Contender list, obviously, a longer streak is preferred.
- Dividend yield + 5 year dividend growth rate > 8% (Chowder rule). Telecoms, REITs and utilities can get a pass due to their higher initial starting yield. Investments in these areas I want to have an additional "kicker," stocks near a 52-week low or some other way they may generate alpha over a short- to medium-term horizon. This will be highlighted as part of my thesis. The kicker may be better defined as a low-P/E stock that has not yet reverted to its mean.
- Investment grade holdings >BBB+ should generate 95% of the portfolio's dividend income.
- Review my investing framework questions:
- What is the opportunity here?
- Am I excited about the business?
- What are expected returns?
- What are the risks and downside?
- How does this fit into my portfolio?
- Does it offer something materially different than an equivalent ETF?
- Can I sell a cash secured put to lock in a stock at a particular price I want?
- Simple example: Company X trades at $10/sh. I'm willing to buy it at $8. I sell a put with an expiration for $8 and collect some premium up front. It may never reach $8 but I get to keep the premium. Alternatively it does and my cost basis becomes $8 - premium per share.
- I want to see steady earnings growth over time; this will generally remove commodity-based companies.
- I like cash cows. Good profit margins (> 10%) are appreciated, though not required. A company with a moat should be analyzed to see how easily its moat can be disrupted.
- I like to see shareholder-friendly management. This manifests in a healthy and rising dividend and a willingness to buy back shares. Often buybacks aren't always done at opportune times. Additionally, they are frequently established to just buy back stock options for employees. A good metric to look into is the "total shareholder yield." This aggregates net dividends, buybacks and debt reduction.
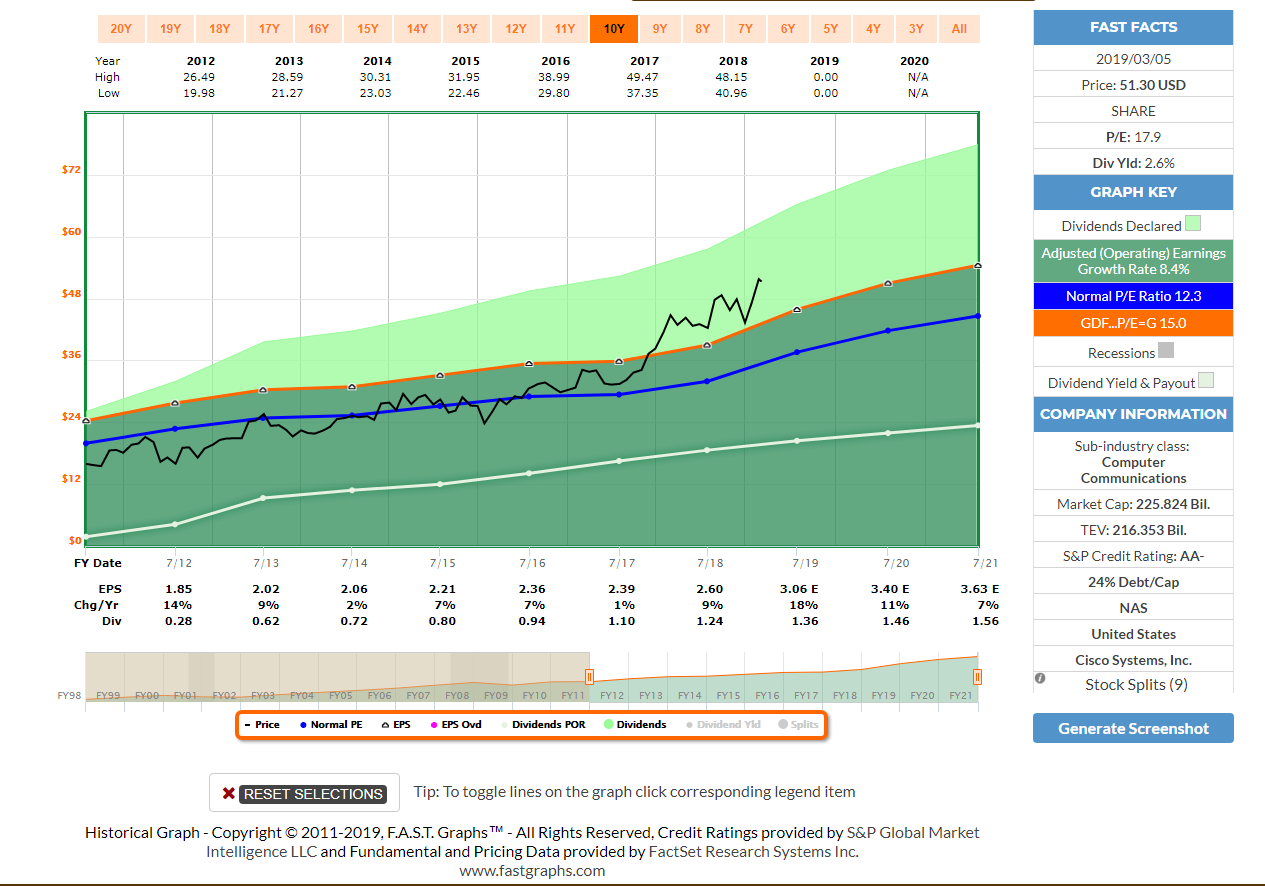
- Perhaps most importantly, the valuation needs to be right per F.A.S.T. Graphs. The stock should be trading at fair value or better for an appropriate timeline (13+ years, if possible). With a longer time frame, I can see how shares fared during the Great Recession, and this also removes some of the recency bias that can come from only analyzing valuation during this extended bull market.
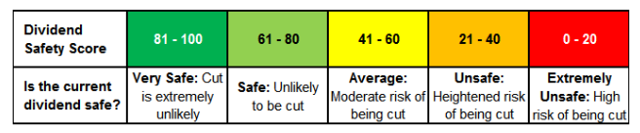
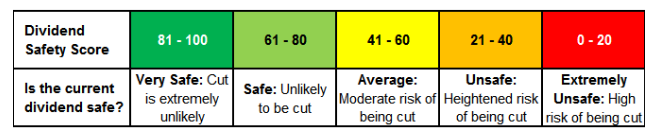
- I will also use Simply Safe Dividends and the information provided by Brian on his site. Among a plethora of information available, he has a dividend scorecard where companies are ranked in terms of dividend safety, growth and yield. I aim to pick companies that are in the 80+ safety range.
Selling Criteria
There are only a few reasons I'll sell a stock, though none of these events is a guarantee I'll do so.
- Dividend cut
- Company degradation - This could be things like deteriorating balance sheets, loss of competitive advantage and loss of credit ratings. These factors may come to light before a dividend cut manifests. This may also appear in a streak of less-than-expected dividend increases. The dividend increase is the more visible outward sign of a company's success. A paltry increase or two may underscore problems below the surface.
- Wild overvaluation - This becomes a bigger factor if there is something at a fair valuation that I wish to purchase with the proceeds. I will admit that several things I have sold have continued to defy financial gravity, so I am more becoming of the mind of just ignoring overvaluation if the underlying business continues to operate well.
- I may put in a limit order to sell, tailing a stock upwards until financial gravity kicks in.
- I may write an out-of-the-money covered call.
- I just don't want to own it. When I pull this card, I will more fully explain my reasoning. Part of the beauty of owning individual companies is choosing where I put my money. I can opt to not support companies, products, management, etc. that I do not agree with. An example of this could be companies with management issues or criminal/unethical business practices.
- Based on known information, capital is better passively invested or focused into better ideas.
Timing
One tactic I've used is buying shares prior to the ex-dividend date after the company has announced its yearly increase (this also works for ETFs). The increase in amount gives a quick, "at a glance" look into how management thinks the company is operating. With a fat increase, it could be a good time to jump in. This can be confirmation that the investment thesis is indeed working well. Sometimes, the reverse can be true too - being snubbed with a "bad raise" can be a red flag that things are not as they seem and it's time to research what's up. I've done this several times already with Altria Group, Inc., Starbucks (SBUX), Corning (GLW), Prudential Financial (PRU), Home Depot, Johnson & Johnson (JNJ) and Illinois Tool Works (ITW).
Most importantly, this was not done to chase dividends but to strategically add to a position that was worthy of being added to. Trees don't grow to the sky, and neither do dividend yields. A quality company that has a nice dividend increase should see its stock price rise by a similar amount over the course of the year, readjusting to the new and higher dividend amount. By jumping the gun, you can speed up the compounding process.
If this sounds interesting to you, you should check out my weekly article, where I give the full list of these companies. I also have upcoming ex-dividend functionality on my site Custom Stock Alerts to help me keep tabs on these increases.
Dividend Reinvestment
Reinvestment is off for all of my holdings except for Visa and MasterCard. The amounts they pay are so low that I'm OK with very slowly accumulating more shares of these generational dividend growth stories.
Other than that, I am of the mindset that I'll take the cash and figure out where to deploy it. This is especially useful if I go below my 5% cash target. The cash machine portion of my portfolio can throw off cash to restore my balances.
(Source)
I think a lot of people have a similar sort of plan where they'd collect dividends, possibly until $1,000 and then invest them to save on fees as a percentage of the investment amount.
At the end of 2018 when the market was rapidly unwinding I did not have enough deployable cash. Rather than ignoring what happened I learned the lesson that I was quite unhappy not being able to take advantage as much as I would have wanted. My only option at the time was to sell existing holdings at non-optimal prices with most of my portfolio near 52 week lows. I don't have any peer reviewed study to suggest what I am doing is "better." I'm trying it out for me and I'll see how it goes.
Dividend Increases
- Cisco (NASDAQ:CSCO) declares $0.35/share quarterly dividend, 6.1% increase from prior dividend of $0.33.
- TROW increased quarterly dividend by 8.6% to 76 cents per share.
- 3M (NYSE:MMM) declares $1.44/share quarterly dividend, 5.9% increase from prior dividend of $1.36.
- Corning (NYSE:GLW) declares $0.20/share quarterly dividend, 11.1% increase from prior dividend of $0.18.
- Prudential Financial (NYSE:PRU) declares $1.00/share quarterly dividend, 11.1% increase from prior dividend of $0.90.
- Tanger Factory (NYSE:SKT) declares $0.355/share quarterly dividend, 1.4% increase from prior dividend of $0.35.
- Home Depot (NYSE:HD) declares $1.36/share quarterly dividend, 32% increase from prior dividend of $1.03.
Dividend Cuts
- None!
The Portfolio
| Name | Ticker | Percent of Portfolio | CCC Status | S&P Credit Rating |
| Apple | AAPL | 3.84% | Challenger | AA+ |
| AbbVie | ABBV | 1.31% | Challenger | A- |
| Abbott Laboratories | ABT | 2.87% | Challenger | A+ |
| Amerprise Financial | AMP | 2.55% | Challenger | A |
| Apple Hospitality | APLE | 0.56% | None | |
| Cummins | CMI | 1.84% | Contender | A+ |
| Cisco Systems | CSCO | 2.28% | Challenger | AA- |
| CVS Health | CVS | 1.45% | Contender | BBB |
| Walt Disney | DIS | 3.01% | Challenger | A |
| Global X MSCI SuperDividend | EFAS | 1.10% | Challenger | A |
| Corning | GLW | 3.34% | Contender | BBB+ |
| Home Depot | HD | 2.27% | Challenger | A |
| Illinois Tool Works | ITW | 3.04% | Champion | A+ |
| Johnson & Johnson | JNJ | 2.83% | Champion | AAA |
| JPMorgan Chase | JPM | 2.90% | Challenger | A- |
| MasterCard | MA | 2.67% | Challenger | A+ |
| Medtronic | MDT | 2.12% | Champion | A |
| Global X MLP ETF | MLPA | 0.87% | None | |
| 3M | MMM | 1.39% | Champion | AA- |
| Altria | MO | 3.56% | Champion | BBB |
| Nike | NKE | 2.08% | Contender | AA- |
| Invesco CEF Income ETF | PCEF | 0.75% | ||
| Prudential Financial | PRU | 2.53% | Challenger | A |
| Starbucks | SBUX | 2.76% | Challenger | BBB+ |
| Schwab US Broad Market ETF | SCHB | 2.29% | ||
| Schwab US Dividend ETF | SCHD | 3.51% | ||
| Global X MSCI SuperDividend Emerging | SDEM | 0.97% | ||
| Global X SuperDividend® ETF | SDIV | 1.24% | ||
| Tanger Factory Outlets | SKT | 1.49% | Contender | BBB+ |
| Global X SuperDividend REIT | SRET | 0.99% | ||
| STAG Industrial | STAG | 1.43% | Challenger | N/R |
| Stanley Black & Decker | SWK | 2.63% | Champion | A |
| AT&T | T | 3.32% | Champion | BBB |
| T. Rowe Price | TROW | 1.41% | Champion | A+ |
| Travelers Companies | TRV | 2.59% | Contender | A |
| United Technologies Corporation | UTX | 1.94% | Contender | A- |
| Visa | V | 2.76% | Contender | AA- |
| W.P. Carey | WPC | 0.89% | Contender | BBB |
Here are the values behind the "CCC Status" category:
- King: 50+ years
- Champion/Aristocrat: 25+ years
- Contender: 10-24 years
- Challenger: 5+ years
Performance
| Ticker | Owned Since | Versus S&P | Benchmark | Versus Benchmark |
| AAPL | 4/13/2015 | 4.38% | SPY | 4.38% |
| ABBV | 1/28/2019 | -3.03% | SPY | -3.03% |
| ABT | 12/6/2016 | 82.32% | SPY | 82.32% |
| AMP | 9/29/2016 | 6.39% | SPY | 6.39% |
| APLE | 1/28/2019 | 0.45% | VNQ | 2.46% |
| CMI | 10/30/2015 | 23.72% | SPY | 23.72% |
| CSCO | 4/6/2016 | 57.46% | SPY | 57.46% |
| CVS | 10/7/2016 | -67.65% | SPY | -67.65% |
| DIS | 12/28/2015 | -33.06% | SPY | -33.06% |
| EFAS | 2/20/2019 | -0.14% | SPY | -0.14% |
| GLW | 10/14/2015 | 73.42% | SPY | 73.42% |
| HD | 5/3/2016 | 3.14% | SPY | 3.14% |
| ITW | 8/24/2018 | 9.62% | SPY | 9.62% |
| JNJ | 12/9/2015 | 2.88% | SPY | 2.88% |
| JPM | 7/15/2016 | 36.19% | SPY | 36.19% |
| MA | 7/26/2018 | 9.99% | SPY | 9.99% |
| MDT | 11/22/2016 | -1.27% | SPY | -1.27% |
| MLPA | 2/6/2019 | -2.11% | SPY | -2.11% |
| MMM | 5/24/2018 | 1.81% | SPY | 1.81% |
| MO | 10/31/2013 | 0.21% | SPY | 0.21% |
| NKE | 5/3/2016 | 6.81% | SPY | 6.81% |
| PCEF | 2/15/2019 | 0.53% | SPY | 0.53% |
| PRU | 4/7/2016 | 6.33% | SPY | 6.33% |
| SBUX | 12/3/2015 | -17.95% | SPY | -17.95% |
| SCHB | 9/24/2018 | -0.64% | SPY | -0.64% |
| SCHD | 9/24/2018 | 0.85% | SPY | 0.85% |
| SDEM | 2/20/2019 | 1.72% | SPY | 1.72% |
| SDIV | 2/20/2019 | -2.06% | SPY | -2.06% |
| SKT | 7/26/2017 | -31.15% | VNQ | -22.40% |
| SRET | 2/20/2019 | -0.95% | SPY | -0.95% |
| STAG | 5/20/2016 | 14.72% | VNQ | 41.77% |
| SWK | 1/28/2016 | -2.29% | SPY | -2.29% |
| T | 11/3/2015 | -35.72% | SPY | -35.72% |
| TROW | 9/29/2016 | 24.55% | SPY | 24.55% |
| TRV | 4/28/2014 | -0.52% | SPY | -0.52% |
| UTX | 1/28/2016 | 1.43% | SPY | 1.43% |
| V | 7/26/2018 | 5.40% | SPY | 5.40% |
| WPC | 5/15/2017 | 15.20% | VNQ | 23.28% |
Versus S&P: This is a measure of the alpha generated (or not) versus the S&P 500 as a benchmark. This is calculated using the stock return calculator here, and it uses the "Owned Since" column as the starting date. This may not reflect actual results, as multiple purchases would change the figure. I can also set the benchmark at the individual ticker level.This table is how shares have performed since I first purchased them. I am able to compare versus both the S&P and another benchmark for each holding. It's supported by the stock return calculator (there is also API access available) that I built.
The next column allows flexibility to define what my benchmark can be. For example, look at the REITs - I've set their benchmark to be VNQ for an apples-to-apples comparison. A utility could be compared to XLU for example. I need to flesh out what high yield ETF I want to be the benchmark for my high yielding ETFs.
In past editions, I highlighted just how quick these results can change. My former holding of Ventas went from a major laggard of both VNQ and the S&P to beating both of them within a few months. I managed to also sell my shares at the top. At the time of writing my ABT holding is beating the S&P by 82%.
My Sells
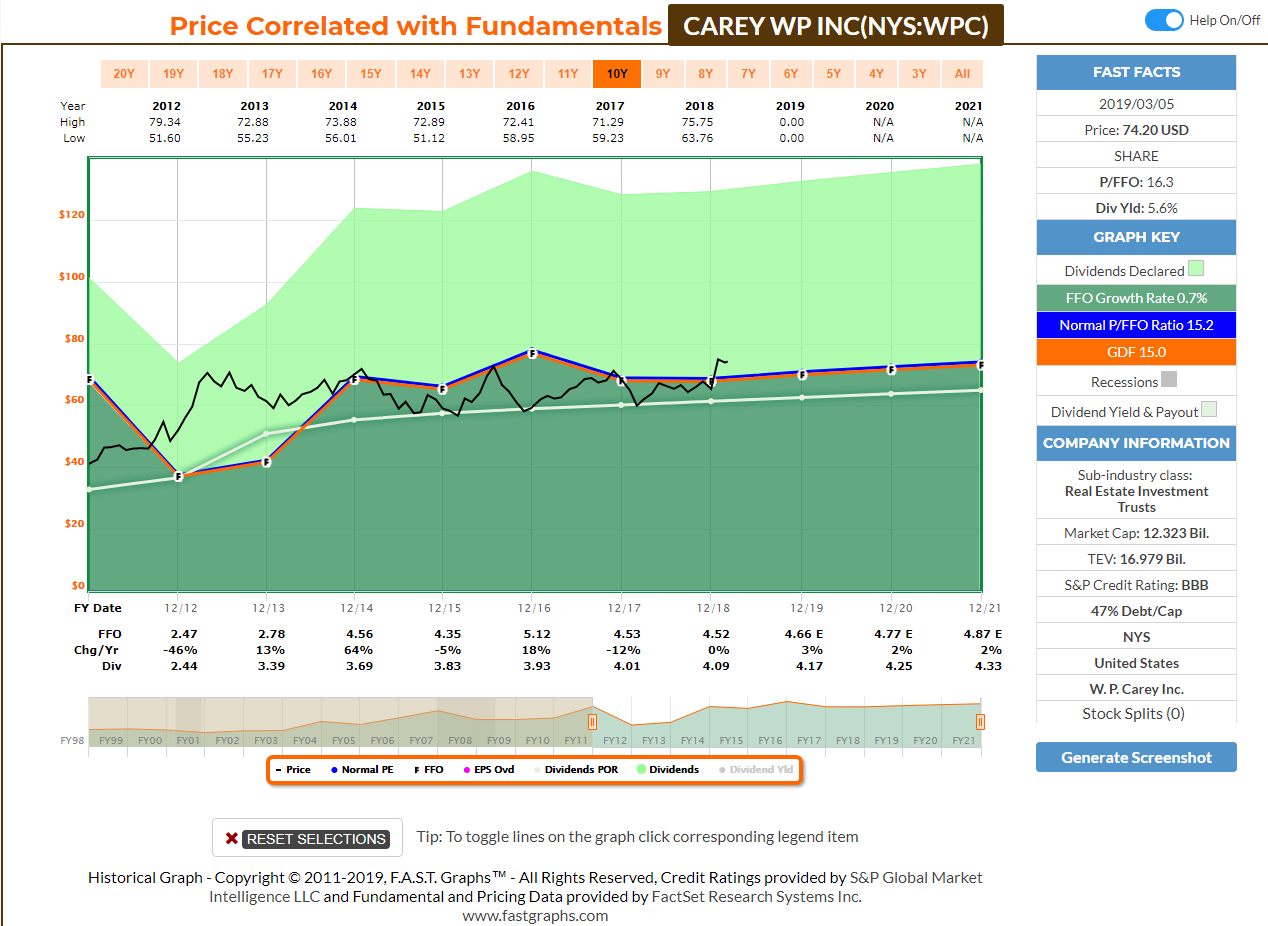
W.P. Carey (trim)
WPC has been on an absolute tear in 2019, jumping $10/sh or 15%. This has the unfortunate side effect of driving the yield down. Growth is expected to be muted this year (AFFO is expected to decline year over year). Solid company just a bit pricey. I tailed this one after it passed $70 with a limit sell order and updated it frequently. I eventually caught it at sold half my stake at $74.51 and used that to actually increase my income with some higher yielding ETFs I'll cover below. If this gets back to yielding 7% I'll jump back in with both feet. On a pleasant note, my remaining stake now has a cost basis of $40.25 and yields me 10.24%.
Starbucks (trim)
Starbucks is another fantastic company with a long runway ahead of it. I just personally think this is another stock that has been on an incredible run coupled with a pricey market.

At 28x adjusted earnings this has attracted quite the multiple. Growth is expected to slow again this year and I think it's just expensive for my tastes. I trimmed 25 shares at $68 which is currently below where the stock is trading. See the options section - the story continues...
My Buys
To preface my purchases, all 6 are new holdings and all have a different correlation from each other and the S&P. I bought across the higher income space of REITs, CEFs, MLPs and high yielding international stocks.
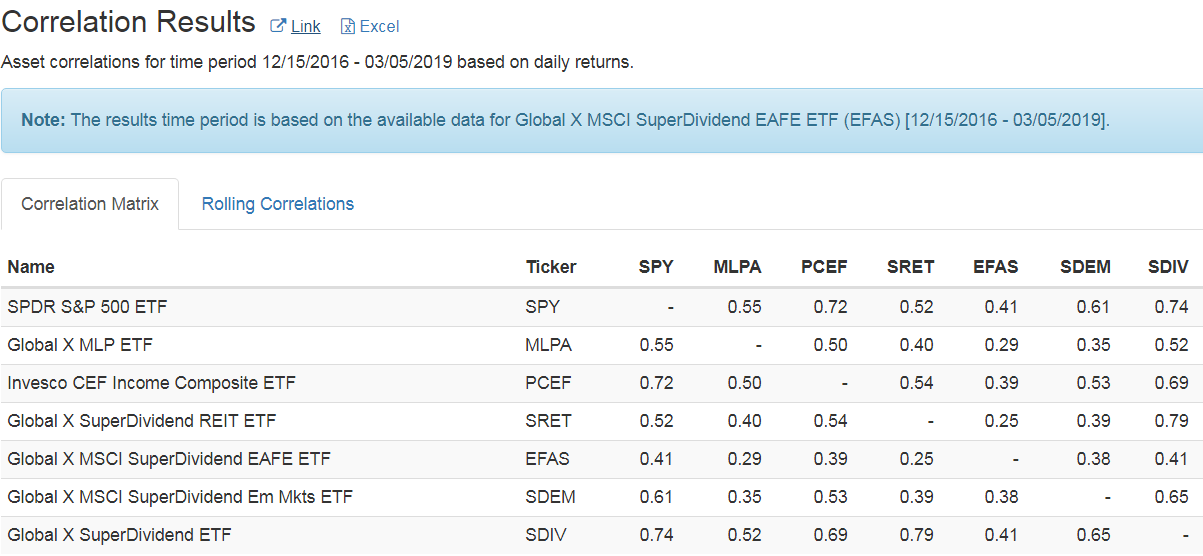
(Source)
As a quick briefer, correlation ranges from -1 to 1 (from two things moving in perfectly opposite directions to moving in perfect lock-step and everything in between). All have a positive correlation of varying degrees to one another. This means that as a whole, they will all move up as the market moves up.
As an example, SDIV and SRET have a 0.79 correlation which is pretty high. This should be quite intuitive when I point out that SDIV targets 100 of the highest yielding equities in the world (with more rules) and SRET targets 30 of the highest yielding REITs in the world.
On the other hand, MLPA (US based MLPs) has fairly low correlation with EFAS and SDEM (international high dividend yielding ETFs).
I also want to point out that these are starter positions in all of these and as prices ebb and flow I can strategically add from here. This is where I use my stock alerts to keep tabs when prices hit an extreme one direction or the other.
Also in reviewing higher yielding ETFs, many of the Global X funds jumped out at me. Most are monthly payers which is a nice bonus. I also bought in even lots to keep my options open.
Global X MLP ETF (MLPA)
I alluded to this purchase in my January article when I hinted at gaining some energy exposure. My portfolio has been lacking any energy exposure but MLPs seem to be quite popular among dividend and income investors. I don't have the chops to pick and choose individual MLPs, especially given some of the tax complications in a retirement account so a broad basket based approach of an ETF was right for me. I actually snagged the first dividend payment by buying my shares right prior to the recent ex-dividend day.
The Global X MLP ETF (MLPA) invests in some of the largest, most liquid midstream Master Limited Partnerships (MLPS). It tracks the Solactive MLP Infrastructure Index.
| Management Fee | 0.45% |
| Other Expenses (Deferred Income Tax & Franchise Tax) | 0.01% |
| Annual Fund Operating Expense | 0.46% |
| Distribution Frequency | Quarterly |
The 300 shares purchased should bring in an estimated $231.
Invesco CEF Income Composite ETF (PCEF)
The only non-Global X fund that was acquired was the Invesco CEF fund (fund of funds). CEFs are another area of income investing that I don't have the chops to pick up my own so I left it the broad basket approach.
The Invesco CEF Income Composite ETF (FUND) is based on the S-Network Composite Closed-End Fund IndexSM (INDEX). The Fund will normally invest at least 90% of its total assets in securities of funds included in the Index. The Fund is a "fund-of-funds," as it invests its assets in the common shares of funds included in the Index rather than in individual securities. The Index currently includes closed-end funds that invest in taxable investment grade fixed-income securities, taxable high yield fixed-income securities and others that utilize an equity option writing (selling) strategy. The Fund and the Index are rebalanced and reconstituted quarterly.
- Management Fee 0.50%
- Acquired Fund Fees & Expenses 1.57%
- Total Expense Ratio 2.07%
- SEC 30 Day Yield 7.52%
- Distribution Rate 8.23%
- 12 Month Distribution Rate 7.47%
The 100 shares purchased should generate an estimated $165 in dividends.
Global X SuperDividend ETF (SDIV)
The Global X SuperDividend® ETF (SDIV) invests in 100 of the highest dividend yielding equity securities in the world. It tracks the Solactive Global SuperDividend Index.
High level stats:
| Management Fee | 0.58% |
| Annual Fund Operating Expense | 0.58% |
| 30-Day SEC Yield | 9.27% |
| 12-month Dividend Yield | 8.56% |
| Distribution Yield | 9.60% |
| Distribution Frequency | Monthly |
I picked up 200 shares which should generate approximately $318 in yearly dividend income.
MSCI SuperDividend Emerging Markets ETF (SDEM)
Next on the list was getting some international exposure of which I have virtually none. I also do not currently have the time or talent to properly analyze foreign listed companies, especially with different accounting rules.
The MSCI SuperDividend® Emerging Markets ETF (SDEM) invests in 50 of the highest dividend yielding equities in the Emerging Markets. It tracks the MSCI Emerging Markets Top 50 Dividend Index.
| Management Fee | 0.65% |
| Other Expenses | 0.02% |
| Annual Fund Operating Expense | 0.67% |
| 30-Day SEC Yield | 6.37% |
| 12-month Dividend Yield | 6.07% |
| Distribution Yield | 6.77% |
| Distribution Frequency | Monthly |
I picked up 200 shares which should generate about $162 in dividends.
Global X MSCI SuperDividend EAFE ETF (EFAS)
The flip side of the emerging markets coin are ex-US developed markets.
The Global X MSCI SuperDividend® EAFE ETF (EFAS) invests in 50 of the highest dividend yielding equity securities from the MSCI EAFE Index, which includes securities from international developed markets across Europe, Australasia, and the Far East. It tracks the MSCI EAFE Top 50 Dividend Index.
| Management Fee | 0.55% |
| Annual Fund Operating Expense | 0.55% |
| 30-Day SEC Yield | 6.60% |
| 12-month Dividend Yield | 6.50% |
| Distribution Yield | 6.65% |
| Distribution Frequency | Monthly |
The 200 shares of EFAS should generate around $202 in dividends.
Global X SuperDividend REIT ETF (SRET)
The Global X SuperDividend® REIT ETF (SRET) invests in 30 of the highest dividend yielding REITs globally. It tracks the Solactive Global SuperDividend REIT Index.
| Management Fee | 0.58% |
| Other Expenses | 0.01% |
| Annual Fund Operating Expense | 0.59% |
| 30-Day SEC Yield | 8.07% |
| 12-month Dividend Yield | 8.27% |
| Distribution Yield | 8.73% |
| Distribution Frequency | Monthly |
I picked up 200 shares of SRET to generate an estimated $232.
Options
This is a new section for me this month. I decided to write two covered call contracts. This is where I can pick a share price (strike) that I'm comfortable with selling my 100 shares at. I also collect a premium in the meantime whether my shares sell or not. I wrote these on names that I felt have had a very large run in an expensive market. They have also been trading at 52 week highs as a kicker.
Cisco
I sold the April 2019 $50 call and received an upfront premium of $1.27/sh. Shares are currently trading right around $51.30 and the price of the call is quite high due to the run up from when I wrote it. I think the share price was at $48 at the time. This one appears it will be called away. If it does, I'll have an effective sell of 100 shares at $51.27 before fees off a cost basis of $25 which would lock in over 100% gain.
Starbucks
After trimming earlier in the month, I wrote a similar covered call on Starbucks. The April 2019 $72.50 strike with an upfront premium of $1.29/sh. Shares need to cross about $73.80 before they would be called away. If it is called away it would lock in a 40% gain off a basis of $52.35.
Charts and Graphs
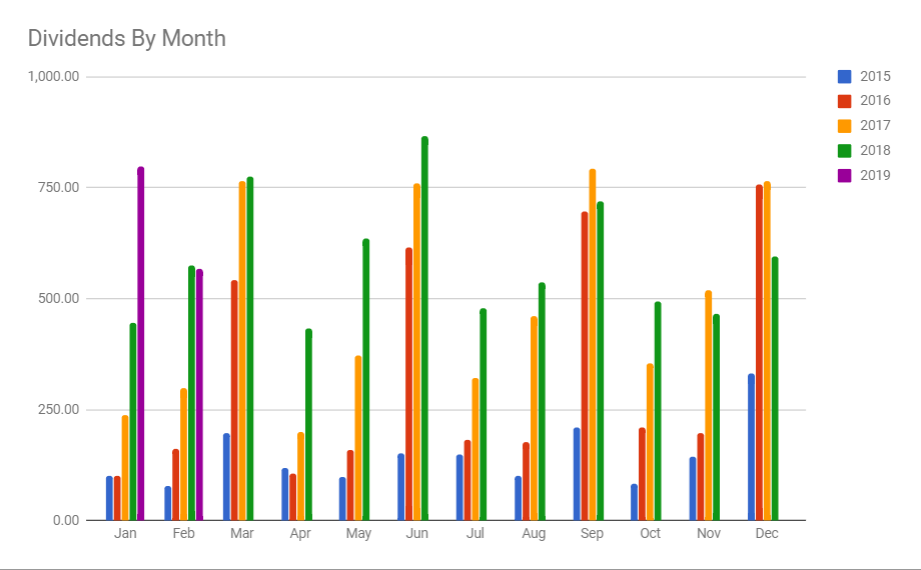
Dividends
The purple bars represent 2019 and you can see that after a monster January, February was just about even with February of last month. I'll cover the payers below.
Notes
- AT&T led the month off with another monster payment. I am overweight T which is part of the reason I've been now collecting the dividends in cash.
- I snuck in before the ex-dividend date for MLPA to receive that dividend. That's quarterly compared to the other 5 ETFs I picked up this month that all pay monthly.
- The payment from PCEF and APLE (a new add from last month) will now join STAG as being monthly payments.
Here's the table of who paid me during the month.

Dividends By Position Size
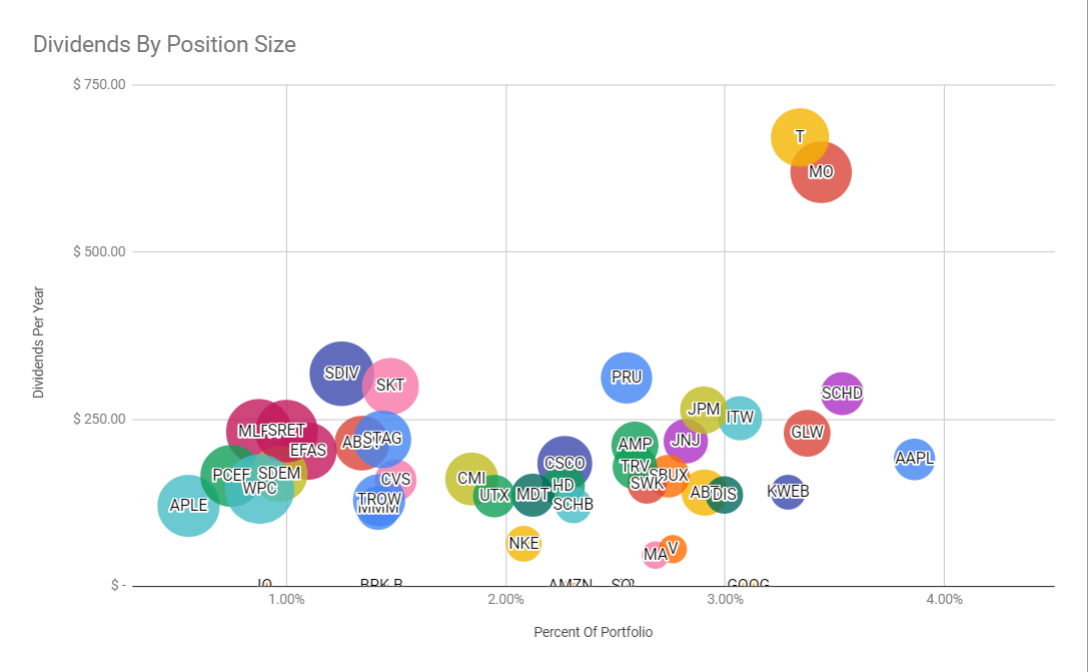
The bubble graph maps expected yearly dividends (y axis) by the percentage in my portfolio (x axis). The third data point, yield on cost, is represented by the size of the bubble.
The bottom left hand corner has been bolstered since I first identified I was lacking exposure to high yielding opportunities. Last month brought APLE and that has now been joined by MLPA, PCEF, SDIV, SDEM, EFAS and SRET.
From there, are circles of various sizes plotted across the board. WPC now has the largest bubble (10%+ yield on cost) after trimming this past month. T and MO continue to sit out in right field as both a large portion of my portfolio and the income they provide.
Growth
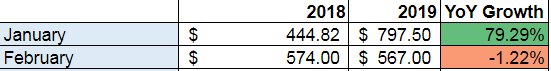
After starting the year with a monster 79% YoY growth rate, February dipped to a slight -1.22% decline. I am still very happy with the $567 that I did collect this month.
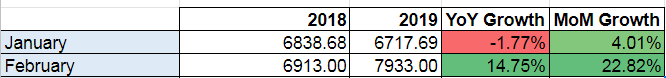
With a massive leapfrog this month, I surpassed my forward looking income from this time last year after starting the year off lagging 2018. The increase represents 14.75% year over year growth and 22.82% monthly growth.
A back of the envelope calculation shows that the $15,000 I invested in monthly dividend ETFs should immediately add $85-$90 in monthly income.
With available cash, cash coming in from 401k contributions and having room to grow my high yield section, achieving $9,000 should be quite possible.
Visualizations
Income By Sector

This month I changed how I include ETFs since I added so many. Historically, I broke down my SCHD holdings into their sectors, weighted it and added it to the sum of my individual holdings of the sector. I did that because an "ETF" is not a sector and attempted to still see through what the ETF was holding. Adding 6 new ETFs, that is a bundle of work I still have to evaluate whether I want to keep doing.
Backing that concept out, I get about 22% of my income from ETFs. This rolls dedicated sector ETFs in, so MLPA and SRET are included even though they are energy and REIT respectively. This gives me a homework assignment to flesh this back out more thoroughly.
Sector Allocations
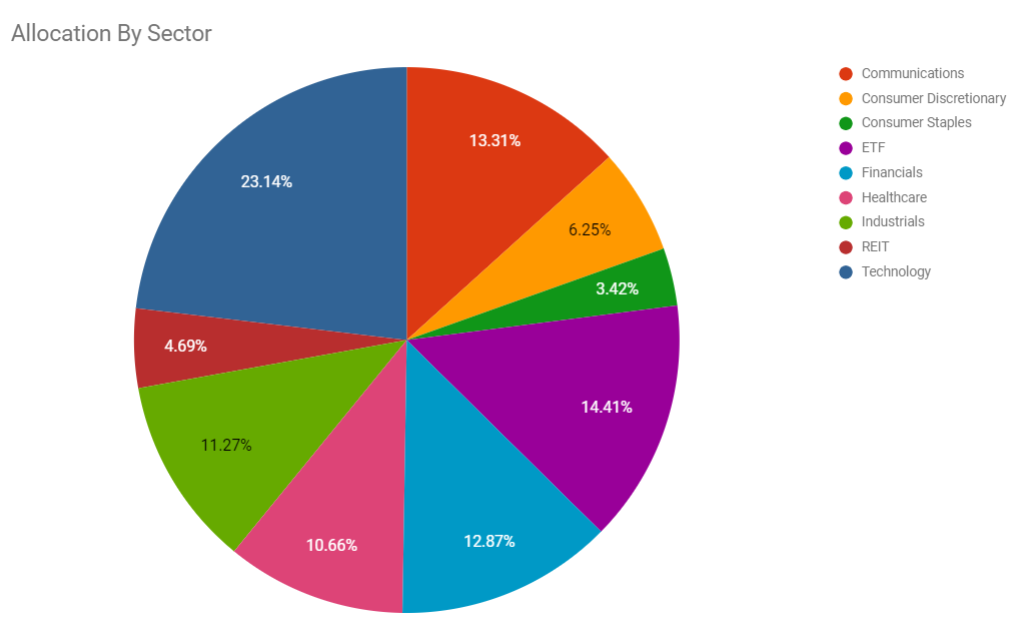
In a similar fashion to the previous pie chart, this one has now gained an "ETF" allocation slice. About 15% of my overall money is invested into an ETF. The rest is split appropriately across the rest of the sectors. Nothing stands out to me that needs to be adjusted because of over-allocation.
Technology and communications are heavily spoken for but these also contain most of my growth stock holdings too.
Champion, Contender, Challenger View
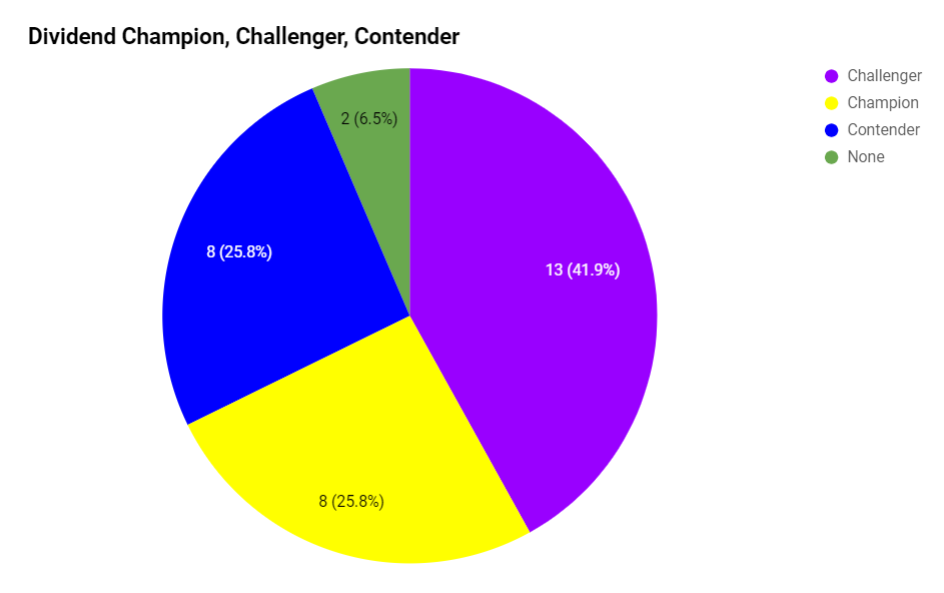
My two "None" holdings are Apple Hospitality (by design) and CVS (not by design). Other than those, I have a nice spread of companies with various dividend growth streaks.
Things Coming Up
I like to run this screener to get some idea generation going again this month, in case it helps anyone out. Here are the filters I start with:
- $10 billion+ in size
- US companies
- Positive dividend yield
- Forward P/E under 20
- Sorted by their 52-week lows
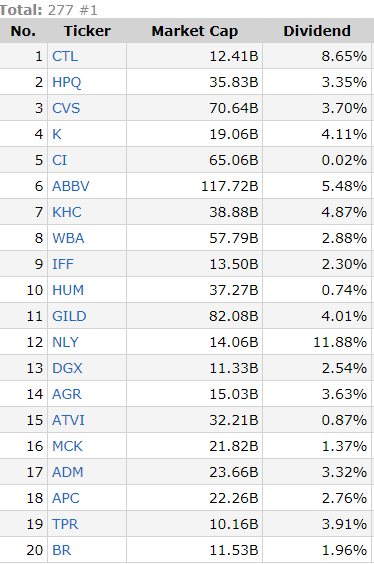
There are definitely some fallen angels here so this is purely a list of starting ideas. CTL and KHC recently cut dividends. CVS continues to lag and recently WBA has joined the party. I might take a look at NLY.
After having 5 companies increase in February I don't have anything in particular that I'm expecting to announce in March.
Conclusion
The $567 collected in February was a slight step back from last year. No worries though, I added over $1,000 of "forward looking" income this month by expanding my high yield portfolio. This will immediately add a steady state of income every month. This also made me eclipse my original target dividend goal for the full year! I revised that goal upwards to capture the fact that I added a lot of high yield income.
I continue to not trust this rally and have positioned myself accordingly. I have used limit sell orders to tail a stock and trim some gains while they are being offered up so freely. Some triggered in February, some are still active. One triggered while writing this article so that will make an appearance next month.
I also expanded my toolset by writing two covered call options. The premiums collected can juice returns and should shares be called away it'll lock in solid market beating returns.
I still have some room to grow the higher yield portion while potentially adding another $1,400 or so in yearly dividends.
My homework is to work on a target portfolio yield as I discovered my actual yield was not much better than the broader market. Eventually I'd also like to target more international exposure, maybe 10% to start. Only 2% of my portfolio I would accurately define as international and those were from the two ETFs (EFAS and SDEM) added this month. I also need to either redefine some of my pie charts or add more cuts of data to work around the ETF issue I highlighted in that section.
Thanks for reading, I hope you've enjoyed reading it as much as I've enjoyed writing it. I encourage you to "follow me" if you don't already!