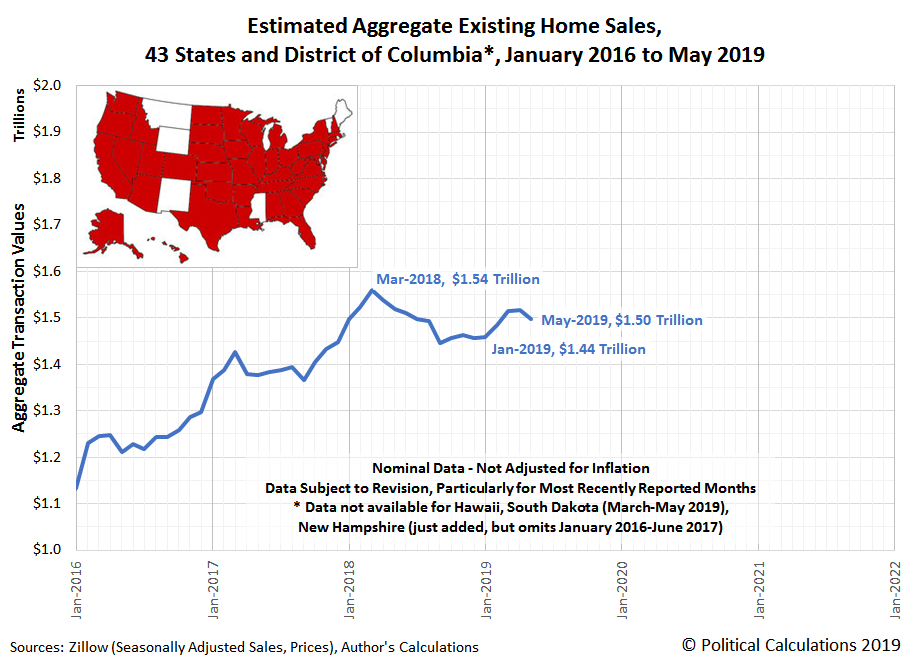
Nationally, the total valuation of aggregate existing home sales have dipped in May 2019 from April 2019's level. Regionally, almost all of that decline was registered in the U.S. Census Bureau's West region.
State-level existing home sales data through May 2019 is now available from Zillow's databases, which now includes data from New Hampshire in the period July 2017 to the present. The following chart illustrates the trends we see for the 43 states for which Zillow provides seasonally adjusted sale prices and volumes for existing homes in 43 states and the District of Columbia.
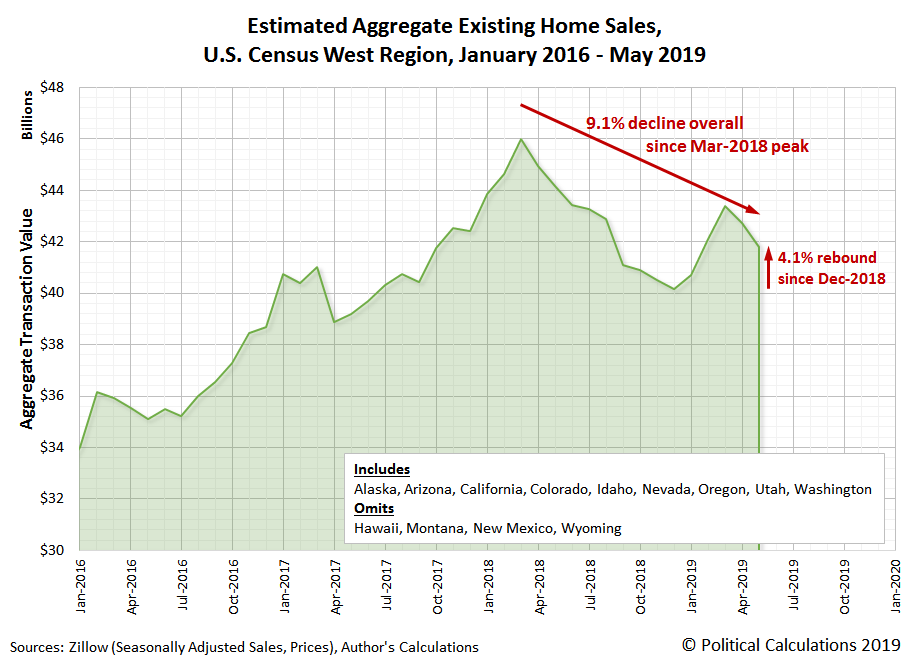
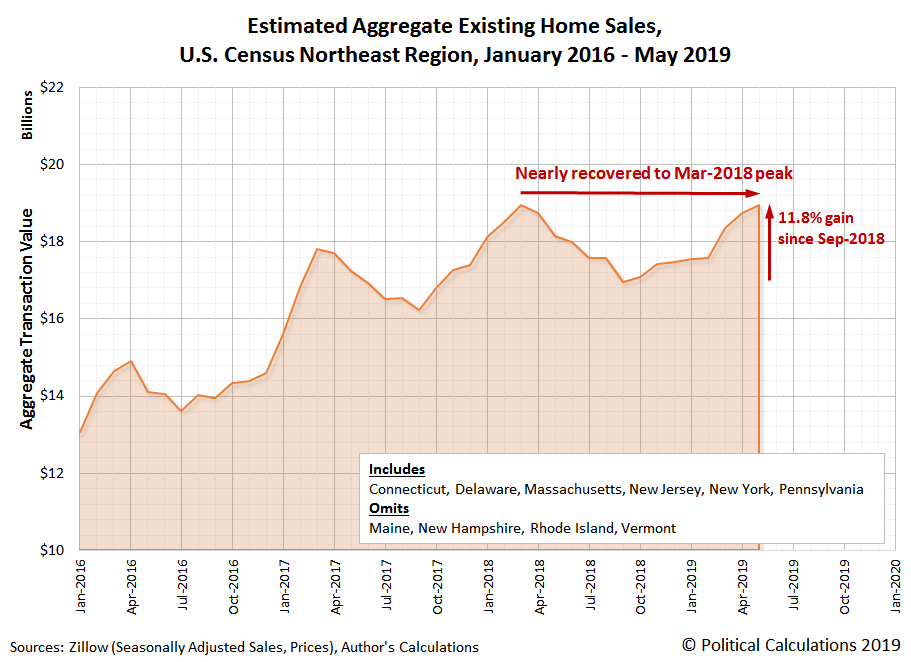
The following charts break the national aggregate existing home sales totals down by U.S. Census Bureau major region from January 2016 through May 2019, where we have omitted states whose available data only covers a portion of that period, which provides an apples-to-apples comparison of trends from one month's data to the next. The first two charts below show the trends for the West and the Northeast, which have respectively been the weakest and strongest regions in the nation over the past several months.
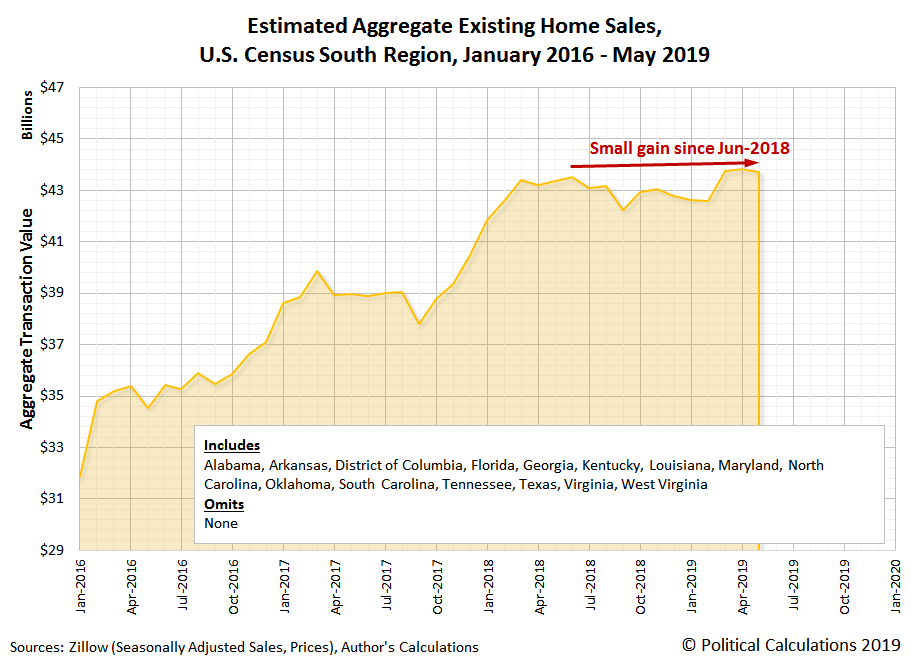
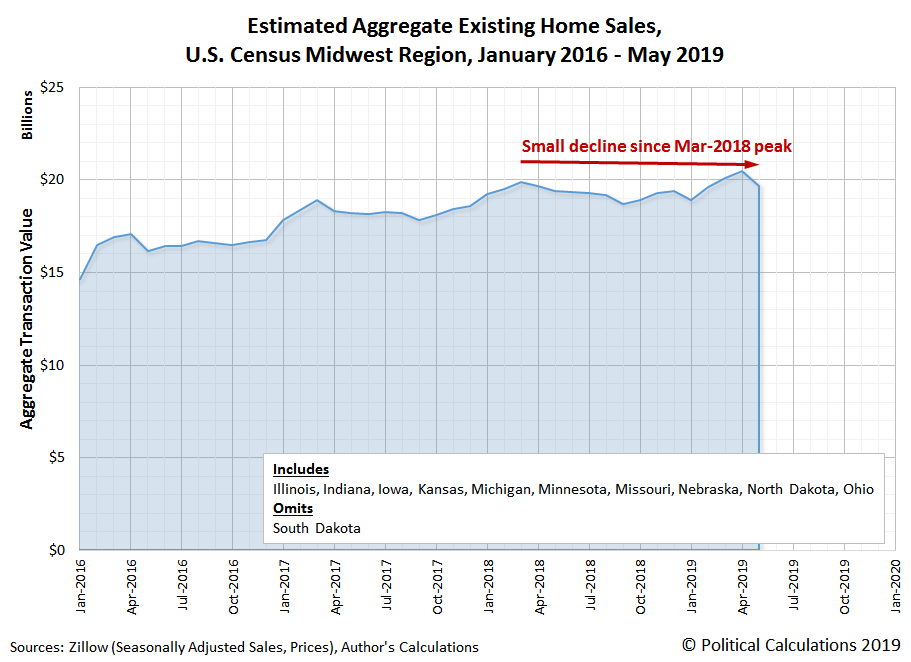
By contrast, the U.S. South and Midwest regions have seen a relatively flat level of aggregate existing home sales since early 2018.
Finally, because we can drill down to state-level data, the final chart shows the recent trends for aggregate existing home sales for each state of the South region.
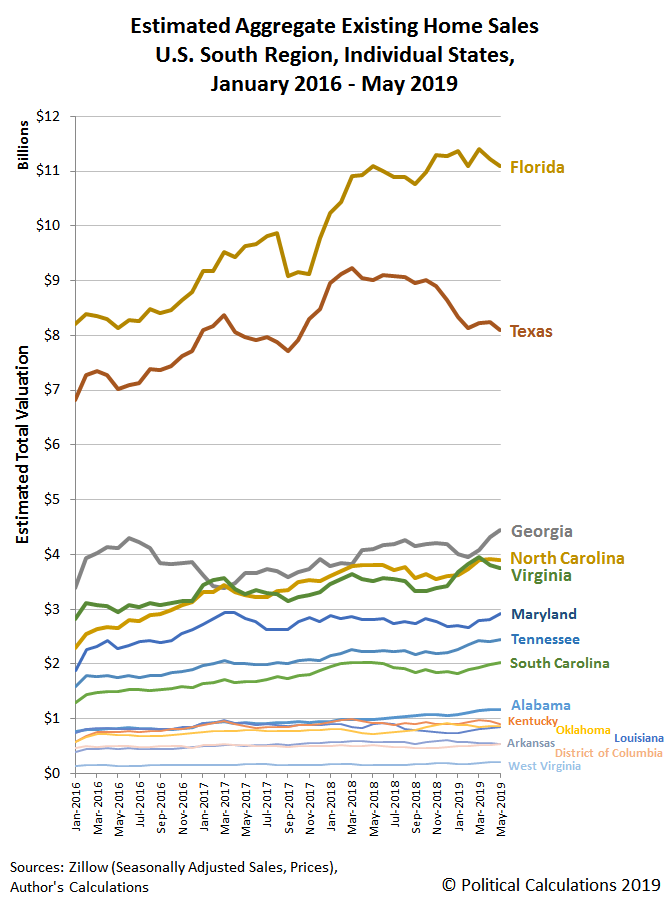
The states that stand out in this region are Texas, Louisiana and Oklahoma, whose aggregate existing home sales have shown relative declines in recent months compared to other states in the region, which coincides with recent distress in the oil & gas industries that make up a large share of these states' economies.
In upcoming weeks, we'll revisit the individual states of the West region, since it is continuing to show weakness compared to other major regions in the U.S.
Editor's Note: The summary bullets for this article were chosen by Seeking Alpha editors.