XLK Weekly: Breakout Higher Early Week Before Price Discovery To 92.29s, New All-Time Highs

Sharedata Futures
1.47K Followers

Summary

  • Price discovery higher to 91.44s in Monday’s auction as last week’s resistance failed.
  • Balance development into Wednesday’s holiday before price discovery higher to 92.29s, new all-time highs into week’s end.
  • Bullish breadth stalls near bullish extreme area.
  • This week’s auction saw buy-side continuation to new all-time highs.

In this article, we examine the significant weekly order flow and market structure developments driving NYSEARCA:XLK price action.

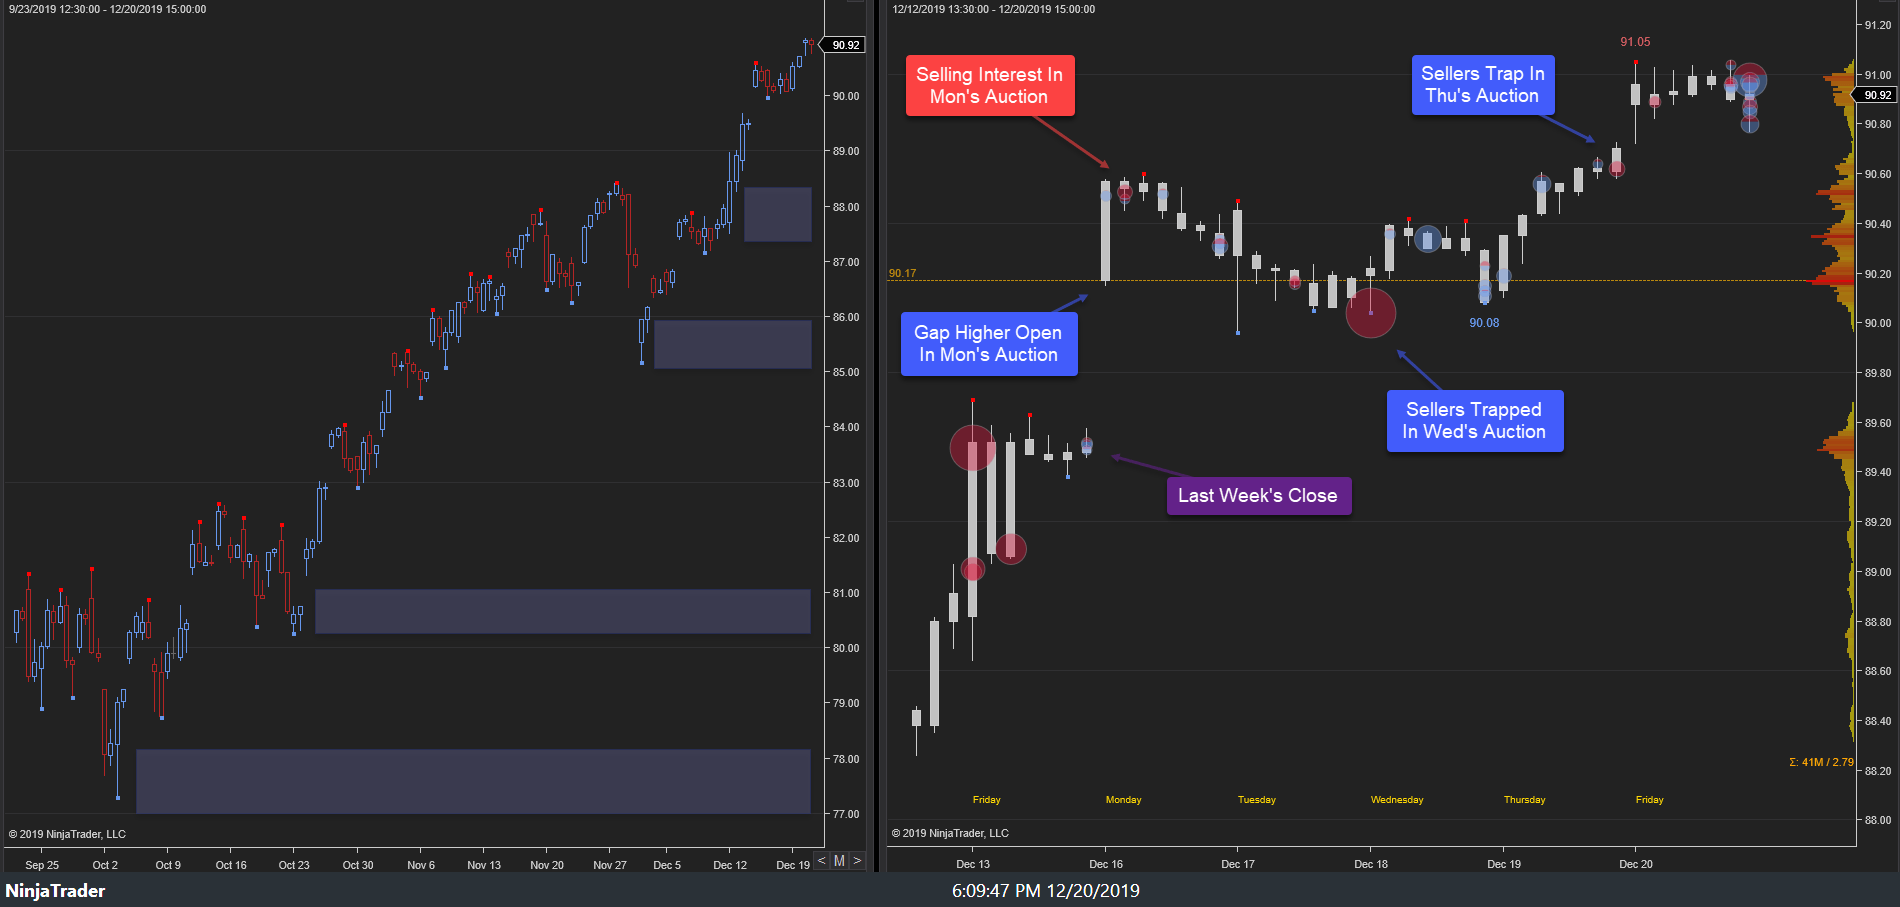
As noted in last week’s XLK Weekly, the highest probability path for this week was for price discovery higher, barring buy-side failure at key support, 89.96s. This primary expectation did play out as minor price discovery higher developed to 91.44s ahead of Wednesday’s holiday. Buy-side continuation developed through Thursday’s trade to 92.29s, new, all-time highs ahead of Friday’s close, settling at 91.91s.

XLK Weekly 20Dec19

23-27 December 2019:

This week’s auction saw price discovery higher in Monday’s auction as last week’s late buyers held the auction, achieving a stopping point, 91.44s. Minor sell excess developed there as balance ensued, 91.44s-91.03s, as the breakout area held as support ahead of Wednesday’s holiday.

A gap higher open developed in Thursday’s trade as price discovery higher continued to 91.94s into Thursday’s close. Price discovery higher continued early in Friday’s trade, achieving the weekly stopping point high, 92.29s. Minor price discovery lower developed to 91.68s ahead of Friday’s close, settling at 91.91s.

XLK Weekly 27Dec19

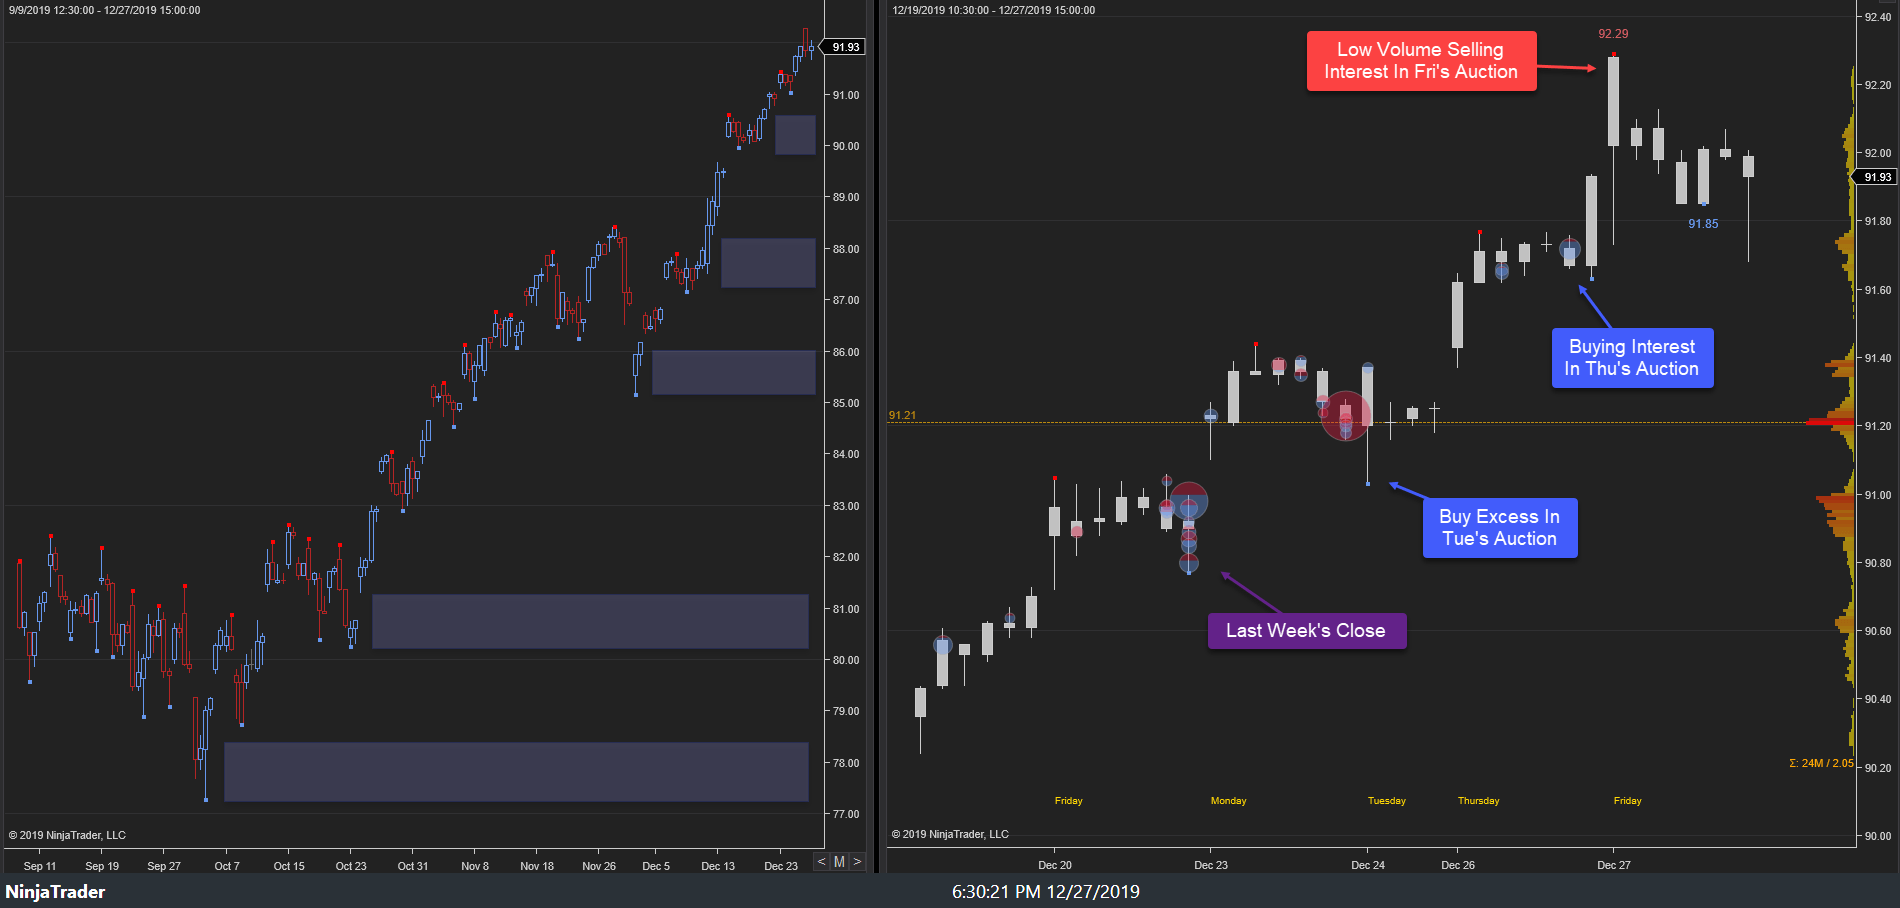
This week’s auction saw a buy-side breakout early week as last week’s resistance failed and price discovery higher continued to 92.29s, new all-time highs. Within the larger context, price discovery higher continues within the bullish bias following the breakout of October 2019.

Looking ahead, the focus into next week’s auction will center upon response to this week’s resistance, 92s-92.29s. Sell-side failure to drive price lower from this key supply would target new all-time highs. Alternatively, buy-side failure at this key supply would target key demand clusters below, 90.40s-90s/88.40s-88s, respectively. From a structural perspective, the highest probability path near-term remains buy-side barring buy-side failure at key support, 91.06s. Within this near-term context, the intermediate term (3-6 month) bias is bullish barring buy-side failure at 85.16s. Next week’s auction may see reduced trade and range amplitude due to the New Year’s holiday.

This article was written by

1.47K Followers
Historical Data Mining & Visualization for NYMEX energy markets. Our experience derives from the proprietary trading world involved in US Index derivatives, commodity ETF derivatives, and exchange-traded NYMEX WTI derivatives.Futures trading contains substantial risk and is not for every investor. An investor could potentially lose all or more than the initial investment. Risk capital is money that can be lost without jeopardizing ones financial security or life style. Only risk capital should be used for trading and only those with sufficient risk capital should consider trading. Past performance is not necessarily indicative of future results.

Analyst’s Disclosure:I/we have no positions in any stocks mentioned, and no plans to initiate any positions within the next 72 hours. I wrote this article myself, and it expresses my own opinions. I am not receiving compensation for it (other than from Seeking Alpha). I have no business relationship with any company whose stock is mentioned in this article.

Seeking Alpha's Disclosure: Past performance is no guarantee of future results. No recommendation or advice is being given as to whether any investment is suitable for a particular investor. Any views or opinions expressed above may not reflect those of Seeking Alpha as a whole. Seeking Alpha is not a licensed securities dealer, broker or US investment adviser or investment bank. Our analysts are third party authors that include both professional investors and individual investors who may not be licensed or certified by any institute or regulatory body.

Recommended For You

About XLK ETF

SymbolLast Price% Chg
Expense Ratio
Div Frequency
Div Rate
Yield
Assets (AUM)
Compare to Peers

More on XLK

Related Stocks

SymbolLast Price% Chg
XLK
--