In my previous article on the USD/CHF currency pair, which is the U.S. dollar expressed in terms of the Swiss franc, I noted that upside will be favored going forward. I did, however, note that we should ideally look for prices under the 0.9770 mark before considering potential long positions. The USD/CHF has now fallen below this level, down to about 0.9742. Further near-term downside risk remains; however, the downside is now likely to be limited.
The daily candlestick chart below illustrates the recent (bearish) price action, while the level of 0.9716 is given attention by the horizontal red line; this might be targeted in the near term.
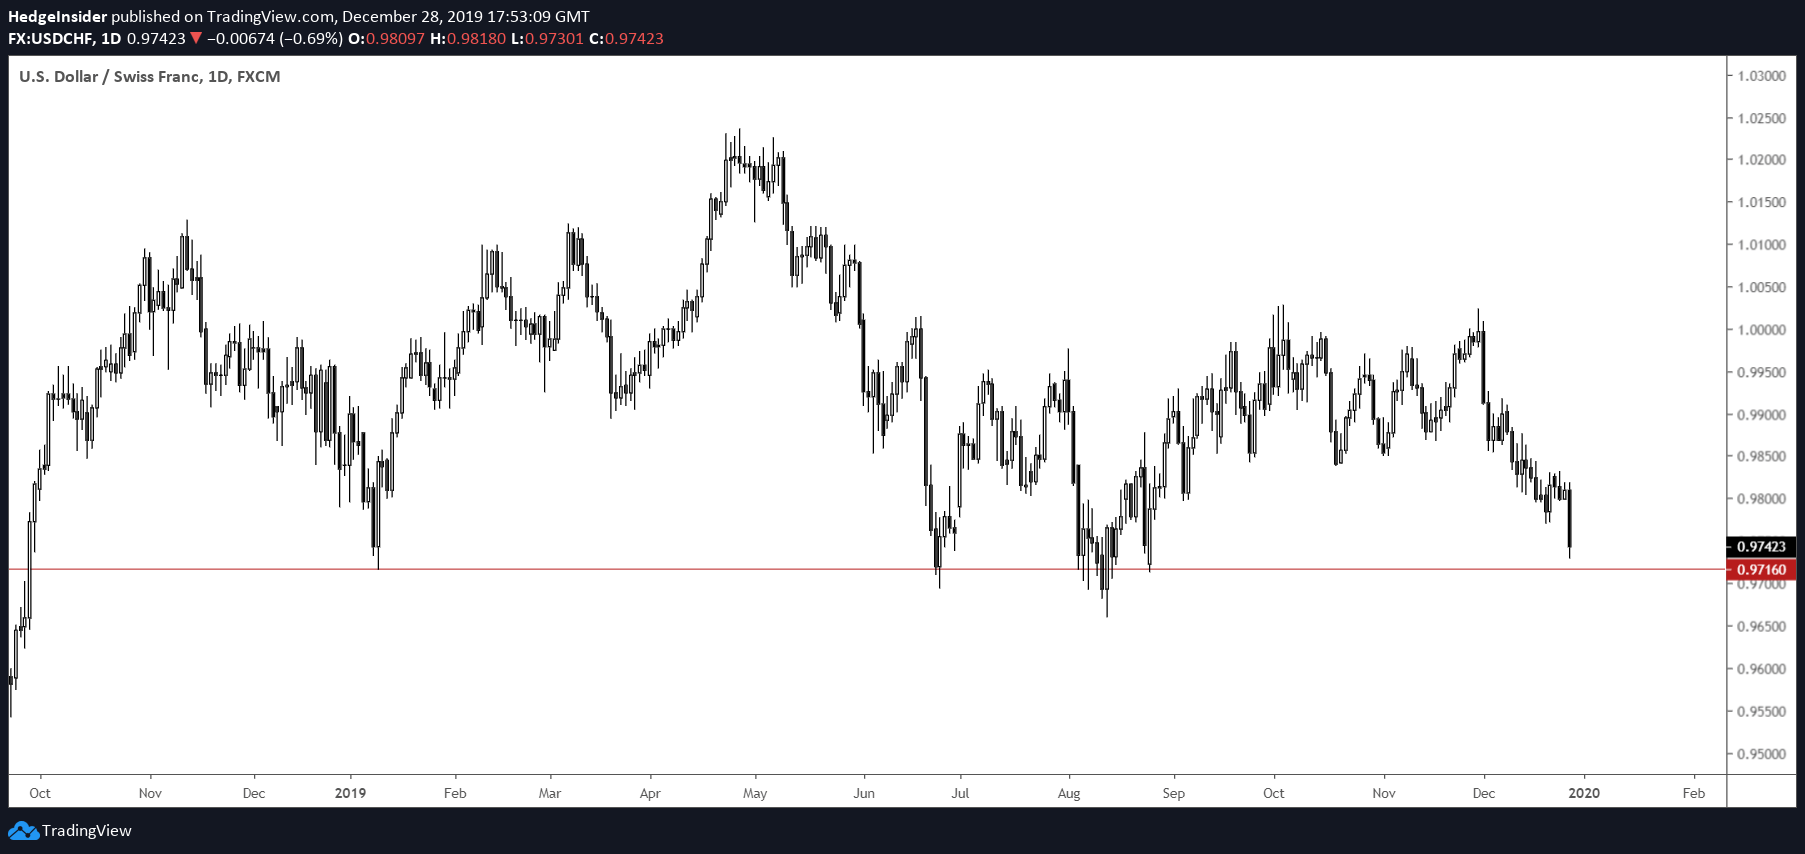
(Chart created by the author using TradingView. The same applies to subsequent candlestick charts presented herein.)
The 0.9716 level was the approximate low during the trading day of January 10, 2019; this can be seen on the chart above. The USD/CHF pair is effectively trading at levels close to the bottom of its longer-term trading range.
Using a fixed-range volume profile tool (using the period from October 1, 2018 to present), we can see the most traded prices for this particular time period. The chart below is an updated version of the first chart, which plots trading volumes using a histogram (shown on the left side of the chart). The bolder red line in the center tells us that the most traded price during this period was roughly 0.9935.
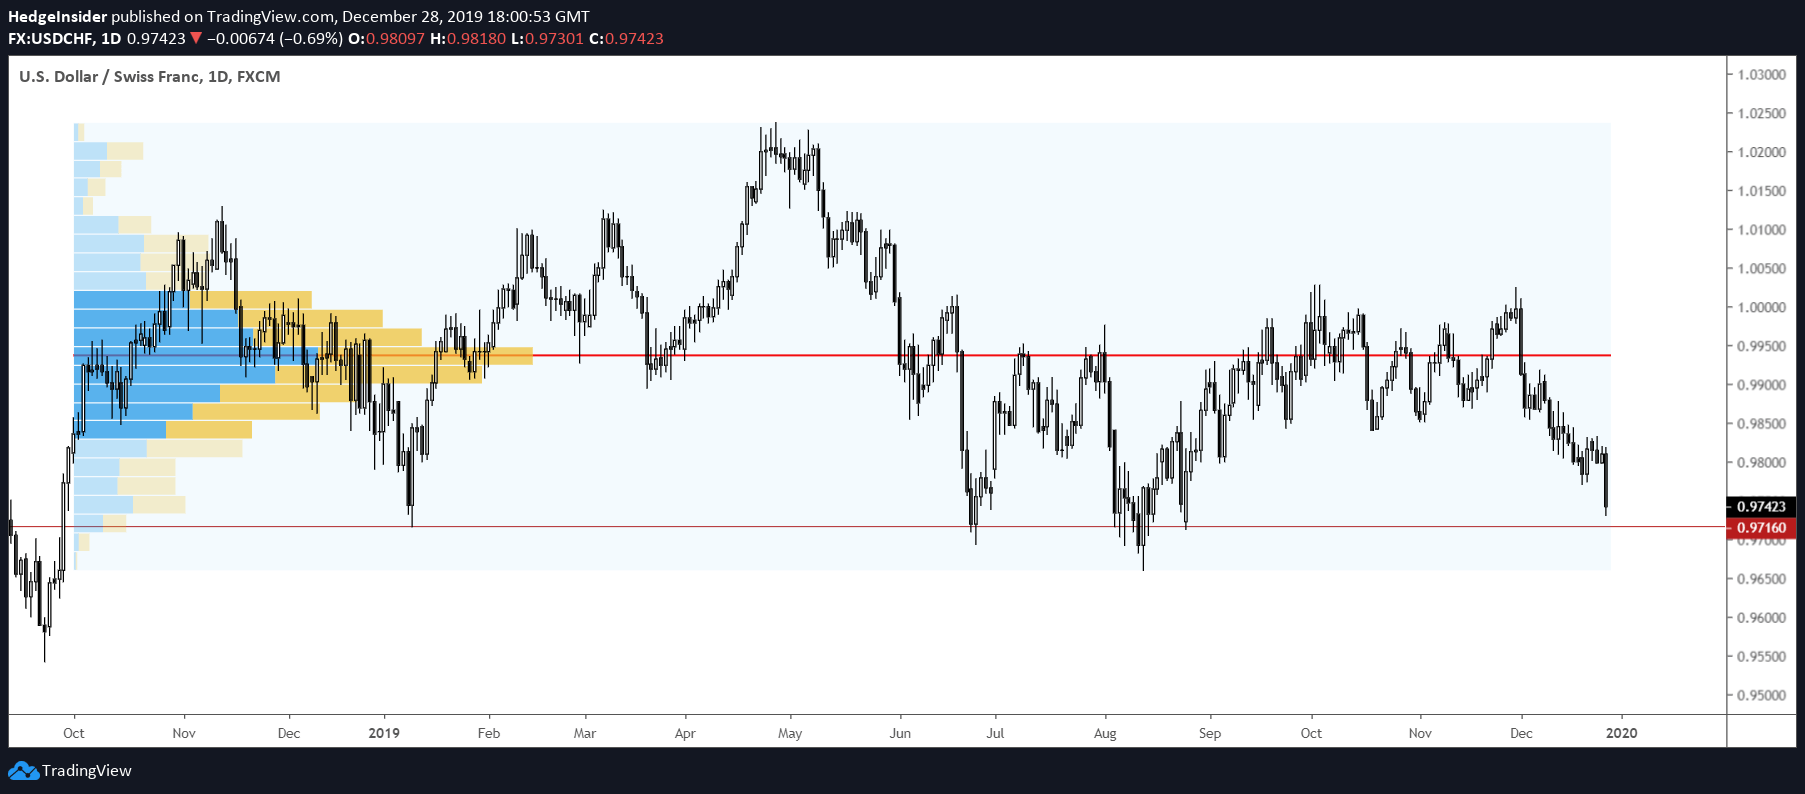
While markets can gravitate to levels that were thinly traded to generate liquidity (outside typical trading areas), generally speaking, we tend to see prices turn back towards more popular levels. Over time, especially in the currency markets where currencies are difficult to 'value' intrinsically, thicker trading levels (such as around 0.9935 for USD/CHF since October 2018, as mentioned) can perhaps be viewed as the market's prevailing perception of a currency pair's 'fair value'.