Summary:
My analysis concludes that JD Digit’s spin-off boosted JD.com's (NASDAQ:JD) operating cash flow, but the risk of receivables securitization might still remain in JD.com. The report analyzes transactions between JD.com and the 'spin-off' JD Digits. JD Digits provides accounts receivable securitization business for JD.com which, in turn, is controlled by JD.com’s CEO Richard Liu. JD.com provides limited information about JD Digits and the transactions between the two entities. It is extremely difficult for investors to determine the nature of the connections and the potential risks. As a result, the balance sheets and the cash flow statements for JD Digits have become of great value. Although neither JD.com nor JD Digits have reported such information, it is possible to reverse-engineer JD Digits' financial statements by comparing JD.com's financial statements before and after the spin-off.
The balance sheet and the cash flow statement of JD Digits suggest that JD.com used to sell only 30% of accounts receivable loans originating in the secondary markets and it held the remaining 70% on its own account. After the spin-off, the legally separated JD Digits held the residual accounts receivable loans and the associated risks, which enabled JD.com to boost operating cash flow. In return, JD.com provides loans to JD Digits through the investing cash flow, and the accounting methods it applies make it very difficult for investors to gauge the real impact.
The boundary between JD Digits and JD.com is blurred, and the risk attached to accounts receivable loans is that they might never truly be spun-off from JD.com. Because of this, investors should discount JD's operating cash flow. Considering that the spin-off accounts receivable businesses to separate legal entities might be a common practice among other e-commerce firms, shareholders of Invesco Golden Dragon China ETF (PGJ), First Trust Chindia ETF (FNI), First Trust International IPO ETF (FPXI), and others, should also be aware.
Background:
JD.com commenced providing supply chain financing services in 2013, and it provided consumer financing services in 2015. JD.com primarily carries the balances of supply chain financing under the "Accounts Payable" item in its balance sheet while it carries consumer financing under the "Accounts Receivable" and the "Loans Receivable" items in its balance sheet. (Source: 6-K Form published on 08/11/2016, page 11 footnotes 1 and 2 link: SEC Filing | JD.Com, Inc.) (Note: The company also carries supply chain financing under "Advances to Suppliers" and consumer financing under "Other Non-Current Assets," but with minimum balances.)
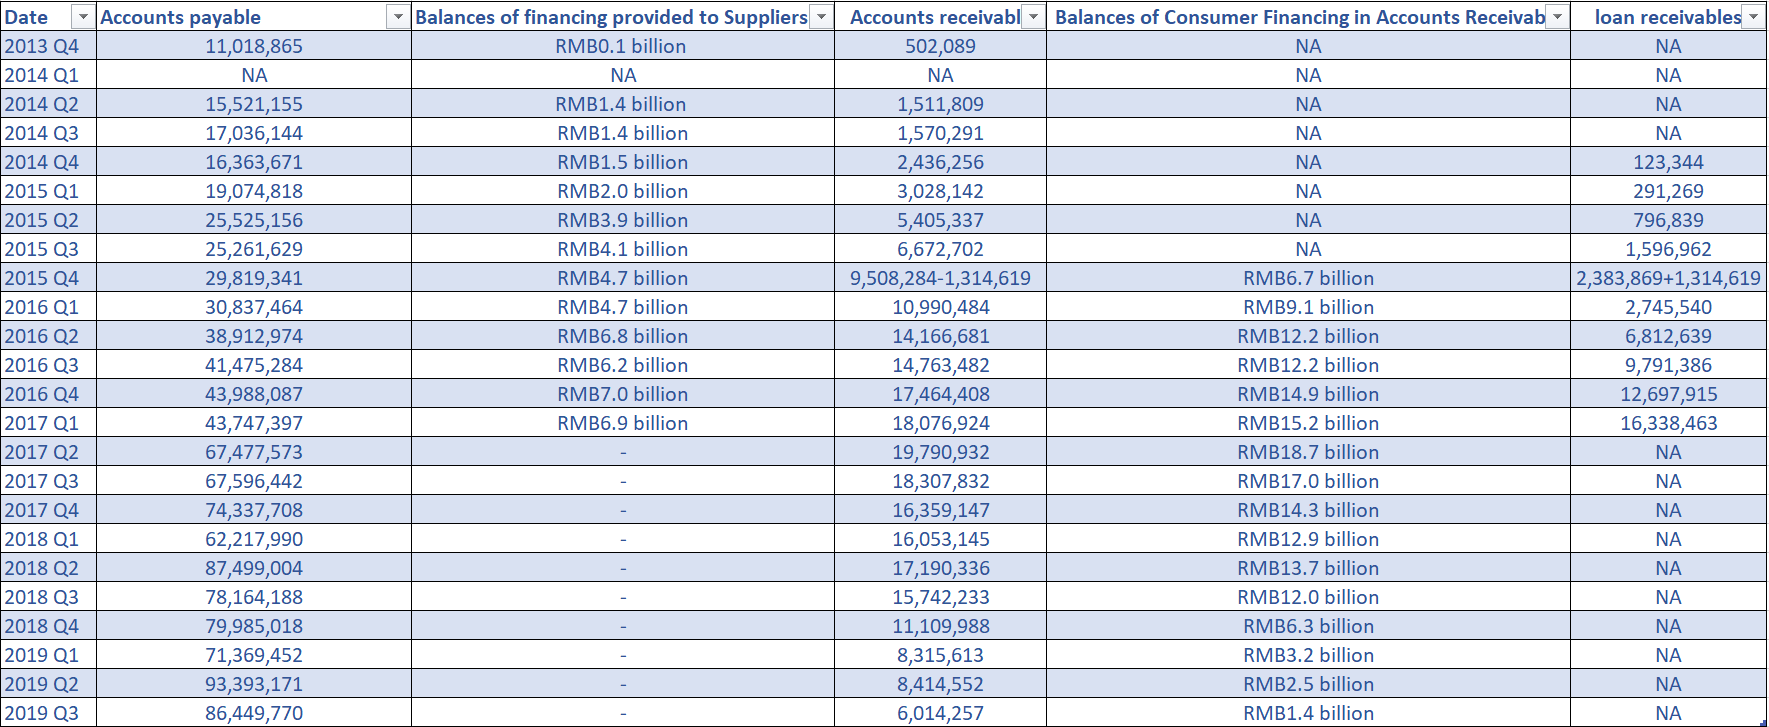
Chart 1: Accounts payable, Accounts receivable, and Loan receivables of JD.com (Sources: Table created by the author with data from JD.com SEC Filing. JD.com reclassified RMB 1.3 billion balance of “accounts receivable” at the end of 2015 into “loans receivable” and reclassified as “loans receivable” from operating activities to investing activities)
The company completed the reorganization of JD Digits (then JD Finance) in the second quarter of 2017 and sold all its equity stakes in the unit for RMB 14.3 billion. As a result, JD.com liquidated all "Loans receivable" from its balance sheet, and stopped revealing the balance of supply chain financing within the "Accounts payable" item (JD.com still carried a 70% balance on its own account – see below) in Q2 2017.
JD.com had legal obligations to continue its involvement in the ABS arrangements until October 2017 and, therefore, it continued carrying on with consumer financing within "Accounts receivable" after the spin-off. After JD.com revised its structural arrangements for the implementation of new ABS plans, the “Accounts Receivable” balance continued to decline and reached RMB 1.4 billion in Q3 2019.
Transactions Between JD.com and JD Digits
JD.com and JD Digits provide limited information about JD Digits and the transactions between the two entities. It is extremely hard for investors to determine the connections and to gauge potential risks. Therefore, the balance sheet and cash flow statements of JD Digits have become of great value. Although JD.com never released the necessary information, it is possible to reverse-engineer these statements through a comparison of JD.com's financial statements before and after the spin-off.
How to Do the Reverse Engineering
In the second quarter of 2017, JD.com completed the reorganization and then reclassified each item in the balance sheet and the cash flow statements at the end of 2016. Items were classified into continuing units (JD.com) and discontinued units (JD Digits) which lay the foundation for the required reverse engineering.
For example, below are Balance Sheets of JD.com in Q1 2017 and in Q2 2017. The balance of "Cash and cash equivalents" as at December 31, 2016, was 19,771,695 in the Q1 statement, and the balance was reclassified to 15,567,036 in the Q2 statement. To match the total asset value, JD.com created two new items "Assets held for sale" and "Liabilities held for sale" in the Q2 statement.
The difference between the two cash balances is 4,204,659, and we can be very confident it was the value of "Cash and cash equivalents" in JD Digits' balance sheet.
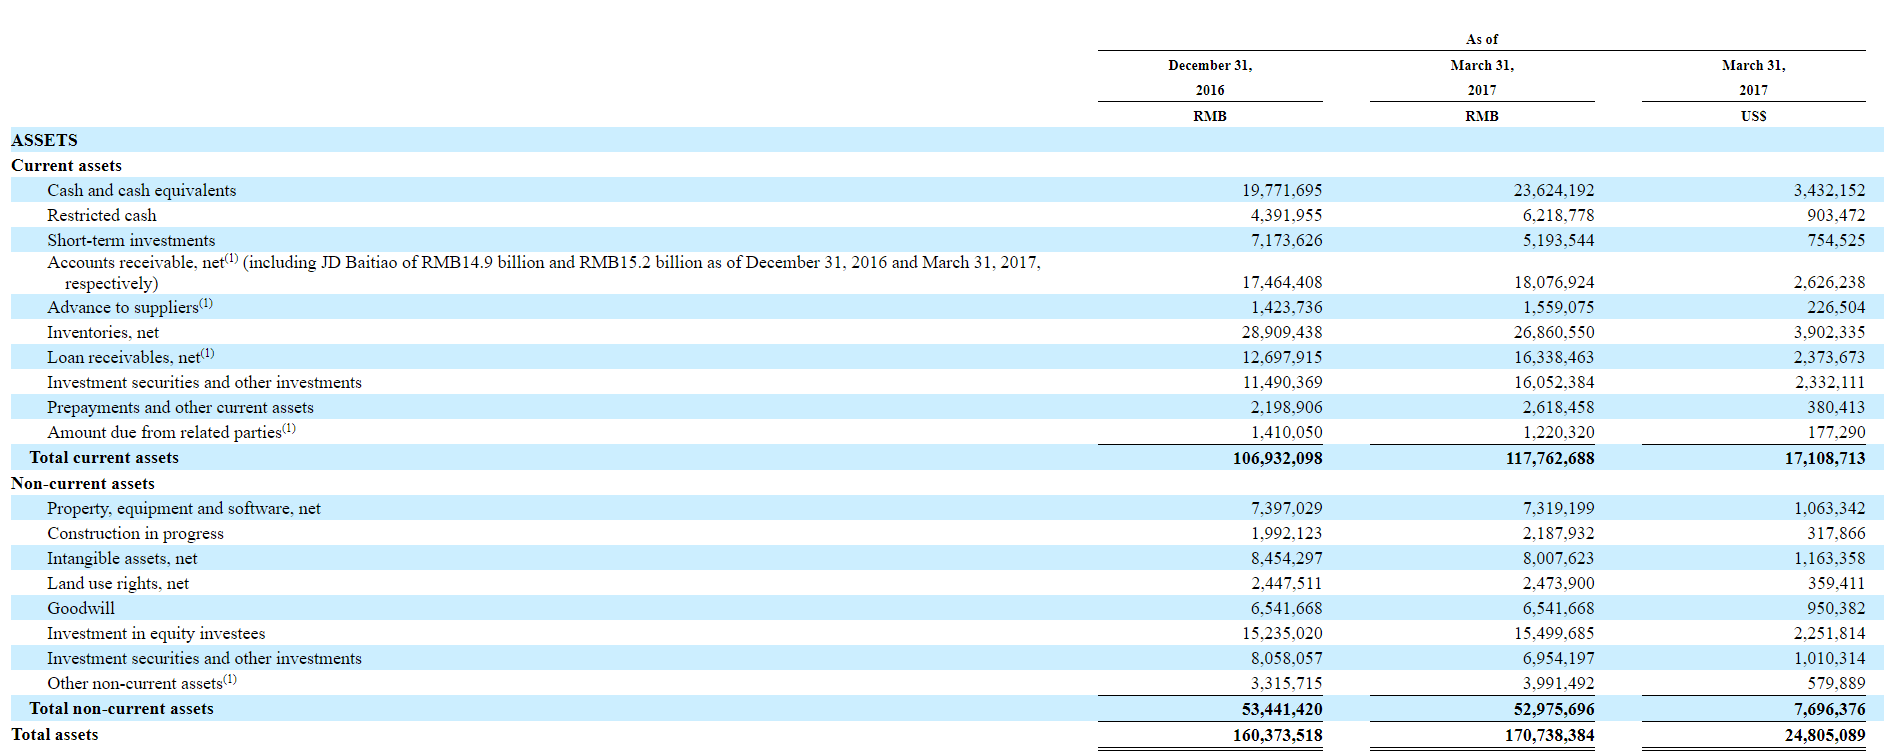
Chart 2: Balance Sheet of JD.com at Q1 2017 (Sources: Table screenshot by the author with data from JD.com SEC Filing)
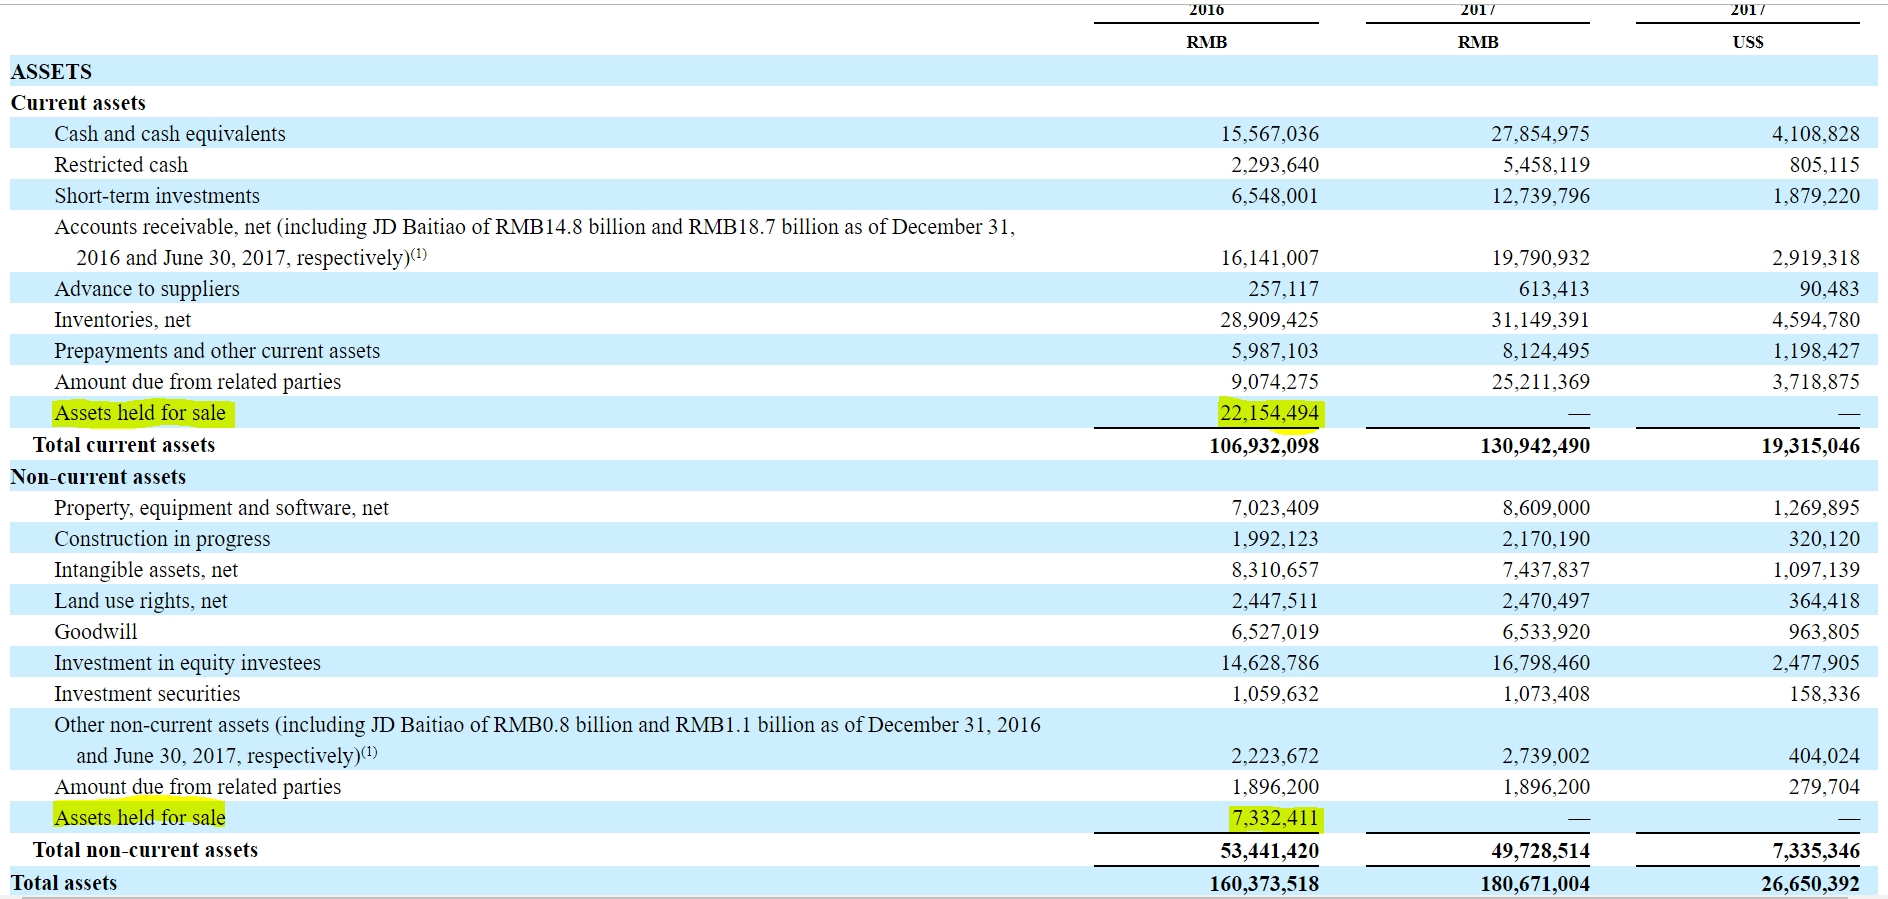
Chart 3: Balance Sheet of JD.com at Q2 2017 (Sources: Table screenshot by the author with data from JD.com SEC Filing)
The reversed-engineered Balance Sheet is shown below:
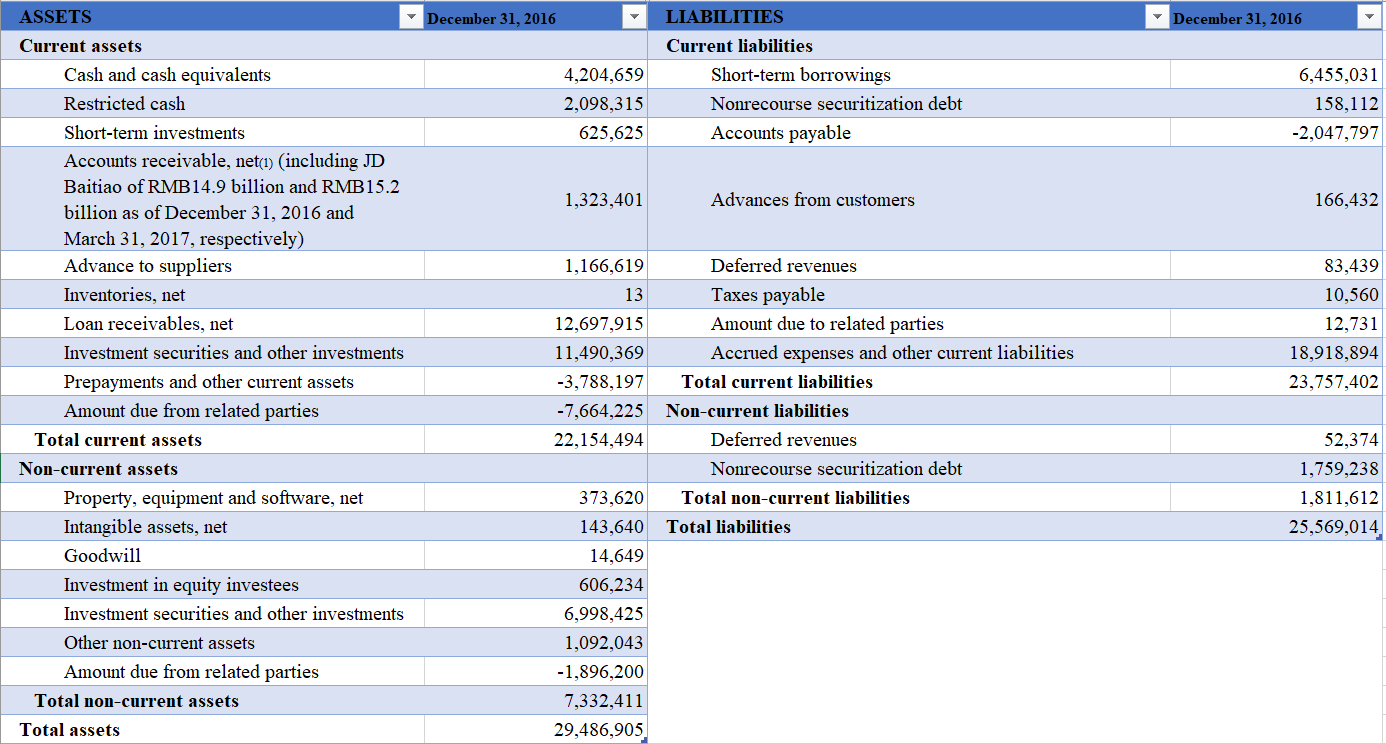
Chart 4: Balance Sheet of JD Digits on December 31, 2016 (Sources: Table created by the author with data from JD.com SEC Filing.) (Note: There is a little difference between the reverse-engineered calculated current liabilities (23,757,402) and current "Liabilities held for sale" (23,757,403), as well as the non-current value (1,811,611 vs 1,811,612). It is due to a mismatch between two 6-K forms. Total current liabilities in Q1 6-K are 104,740,235 versus 104,740,236 in Q2, as well as Total non-current liabilities 14,413,500 versus 14,413,499. (The differences are insignificant so no action is appropriate.)
From JD Digits' balance sheet, we can see that the "loan receivable", "Investment securities and other investments" accounts for the majority of the entity’s assets. "Short-term borrowings" and "Accrued expenses and other current liabilities" account for most of its liabilities.
A question which arises is why does supply chain financing appear on the Liabilities side of the balance sheet, while consumer financing appears on the Assets side? Intuitively, financing creates a receivable which is generally considered to be like an asset, without any exceptions. This is because JD.com netted the "Accounts payable" balance, which incorporates the impacts of supply chain financing and normal accounts payable operation. That is why we saw that the "Accounts payable" in the above chart is abnormal and shows a negative number. It indicates that JD Digits carries an RMB 2 billion balance of the supply chain financing in its assets. I deliberately kept it on the liabilities side with a negative number so that a reader can reverse-engineer the number by themselves. (Note that JD.com reported the total Balance for supply chain financing was RMB 7 billion so that we can calculate that JD.com took the remaining 70%, RMB 5 billion, after the spin-off)
Although JD.com still carries a large balance of supply chain financing, the company no longer reveals details about it after Q2 2017. "Accounts payable" increased to RMB 87 billion in Q3 2019 from RMB 67 billion in Q2 2017, and its impact on operating cash flow is enormous. Even if we believe that the change of accounts payable turnover days is the primary reason for the huge increase in the "account payable", we still want to determine the impact of supply chain financing. Unfortunately, we cannot get enough information from JD.com's financial statements, and the best solution would be to meet with the management team.
In terms of other financial impacts of the spin-off on JD.com, we can see that "Loans receivable" in the reclassified JD.com balance sheet declined to 0 from RMB 12.7 billion. The item "Investment securities and other investments" dropped to RMB 1 billion from RMB 19 billion. The "Amount due from related parties" increased to RMB 9 billion from RMB 1.4 billion. We will return to this item, "Amount due from related party", in later analysis.
After constructing the reverse-engineered balance sheet of JD Digits, we can get JD Digits Cash Flow Statements from 20-F using the same method:
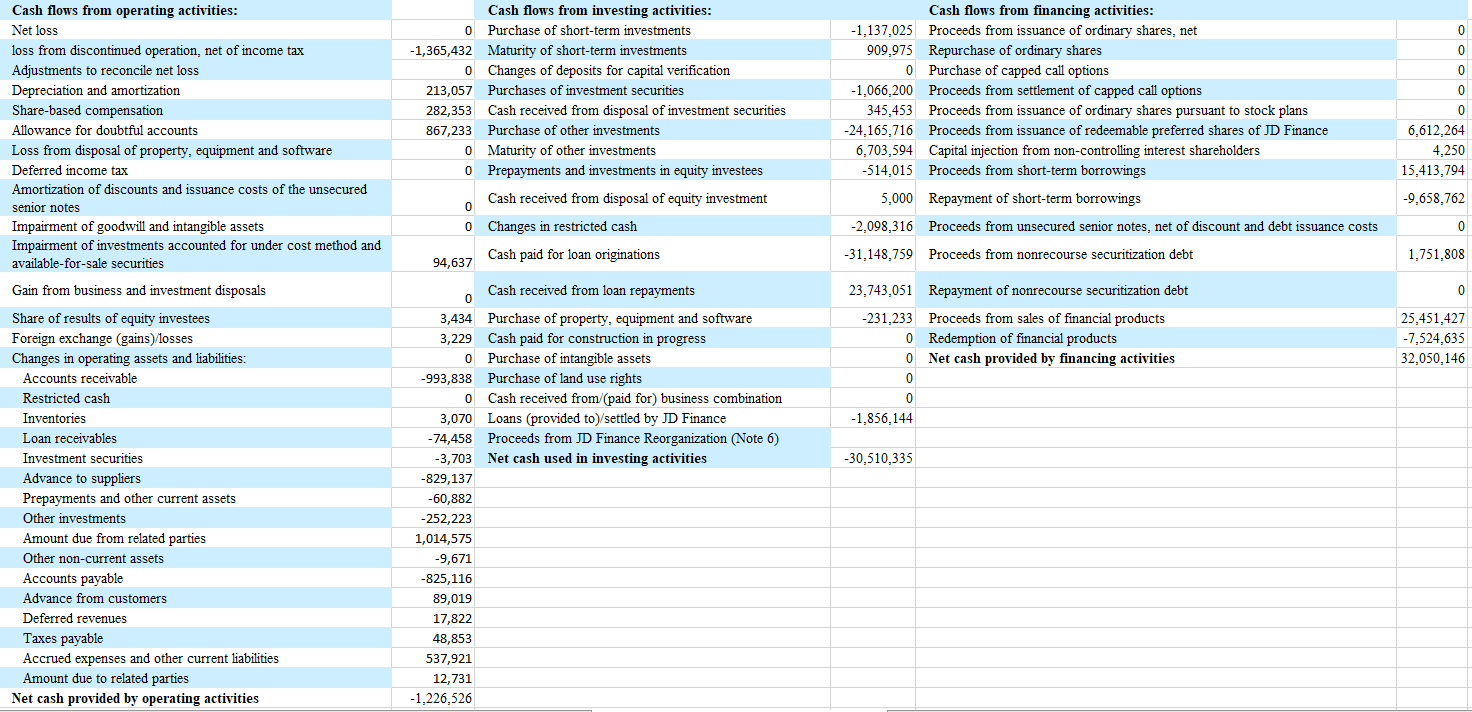
Chart 5: Cash Flow of JD Digits on December 31, 2016 (Sources: Table created by the author with data from JD.com SEC Filing)
From JD Digits' investing cash flow, the company spent RMB 31 billion in the form of loan originations and received RMB 23 billion from loan repayments. The amount of purchases of other investments was RMB 24 billion.
The "cash paid for loan originations" in the reclassified JD.com cash flow statement decreased to RMB 14 billion from RMB 45 billion, and "cash received from loan repayments" decreased to RMB 11 billion from RMB 34 billion.
The amounts of "cash paid for loan originations" and "cash received from loan repayments" are substantial, and JD.com does not reveal how it calculates these two numbers.
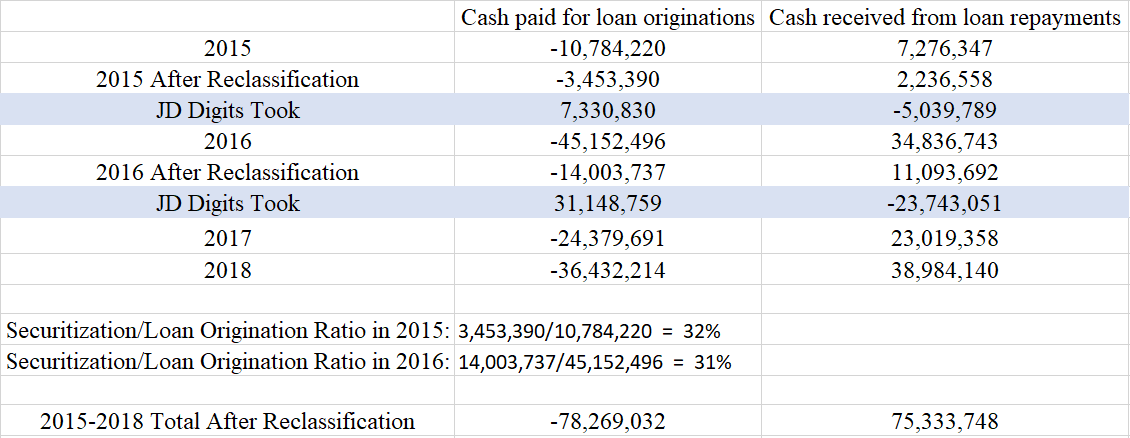
Chart 6: “cash paid for loan originations” and “cash received from loan repayments” of JD.com (Sources: Table created by the author with data from JD.com SEC Filing)
However, we might be able to find clues from JD.com’s ABS issuance records.
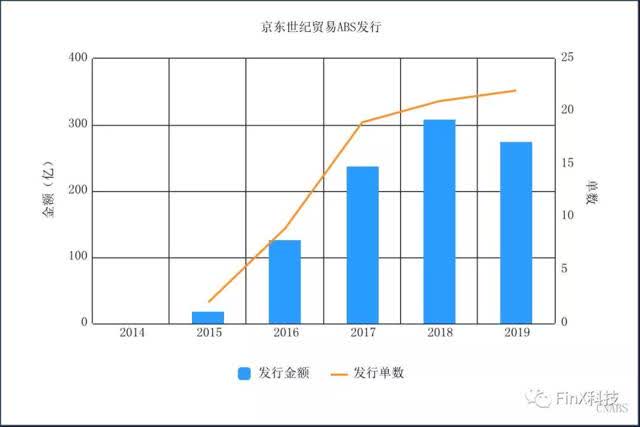
Chart 6: ABS Issuance of Jingdong Century (Source: Finx Finance: Ant Finance and JD raised RMB 75 billion for Nov 11 募资750亿!为了双11 京东和蚂蚁金服再出招)
The chart above shows JD.com's ABS financial product issuance records. As the table is in Chinese, I will explain what the numbers and axis mean: The bar shows the total value of the issuance with the axis on the left showing units "RMB 0.1 billion". The line indicates the number of issuances each year with the axis on the right. We can see that the value of issuance almost matches with the "cash paid for loan originations': RMB 3 billion ( 30* 0.1 billion) in 2015, RMB 14 billion (140 * 0.1 billion) in 2016, RMB 24 billion (240* 0.1 billion) in 2016 and RMB 36 billion (360 * 0.1 billion) in 2018. The 36 billion in 2018 is larger than the bar, but still reasonable if considering a potential time gap between financing and issuance. What is more, the ABS issuance entity is the Jingdong Century (Beijing Jingdong Century Trade Co., Ltd.) which, according to the 20-F, is a 100% owned subsidiary of JD.com.
JD.com's Loans to JD Digits
Although JD.com sold all its equity stakes in JD Digits in 2017, JD.com continues to provide loans to JD Digits by way of investing cash flow, and the accounting methods it applies make it very difficult for investors to gauge the real impact.
JD.com reports loans to JD Digits in the 20-F investing cash flow section "Loans (provided to)/settled by JD Digits" but never reveals the details in each quarter's 6-K. For example, during November 2015, 2019's earnings release, it only mentions that "Net cash used in investing activities was RMB5.7 billion (US$0.8 billion) for the third quarter of 2019, consisting primarily of an increase in investments in equity investees and short-term loans to JD Digits." Even in the 20-F, the "Loans (provided to)/settled by JD Digits" is a net cash flow where it is very hard for investors to gauge the real impacts. A better way to reflect the cash flow transactions between the two related entities would be by identifying: "Loans provided to JD Digits" and "Loans settled by JD Digits."
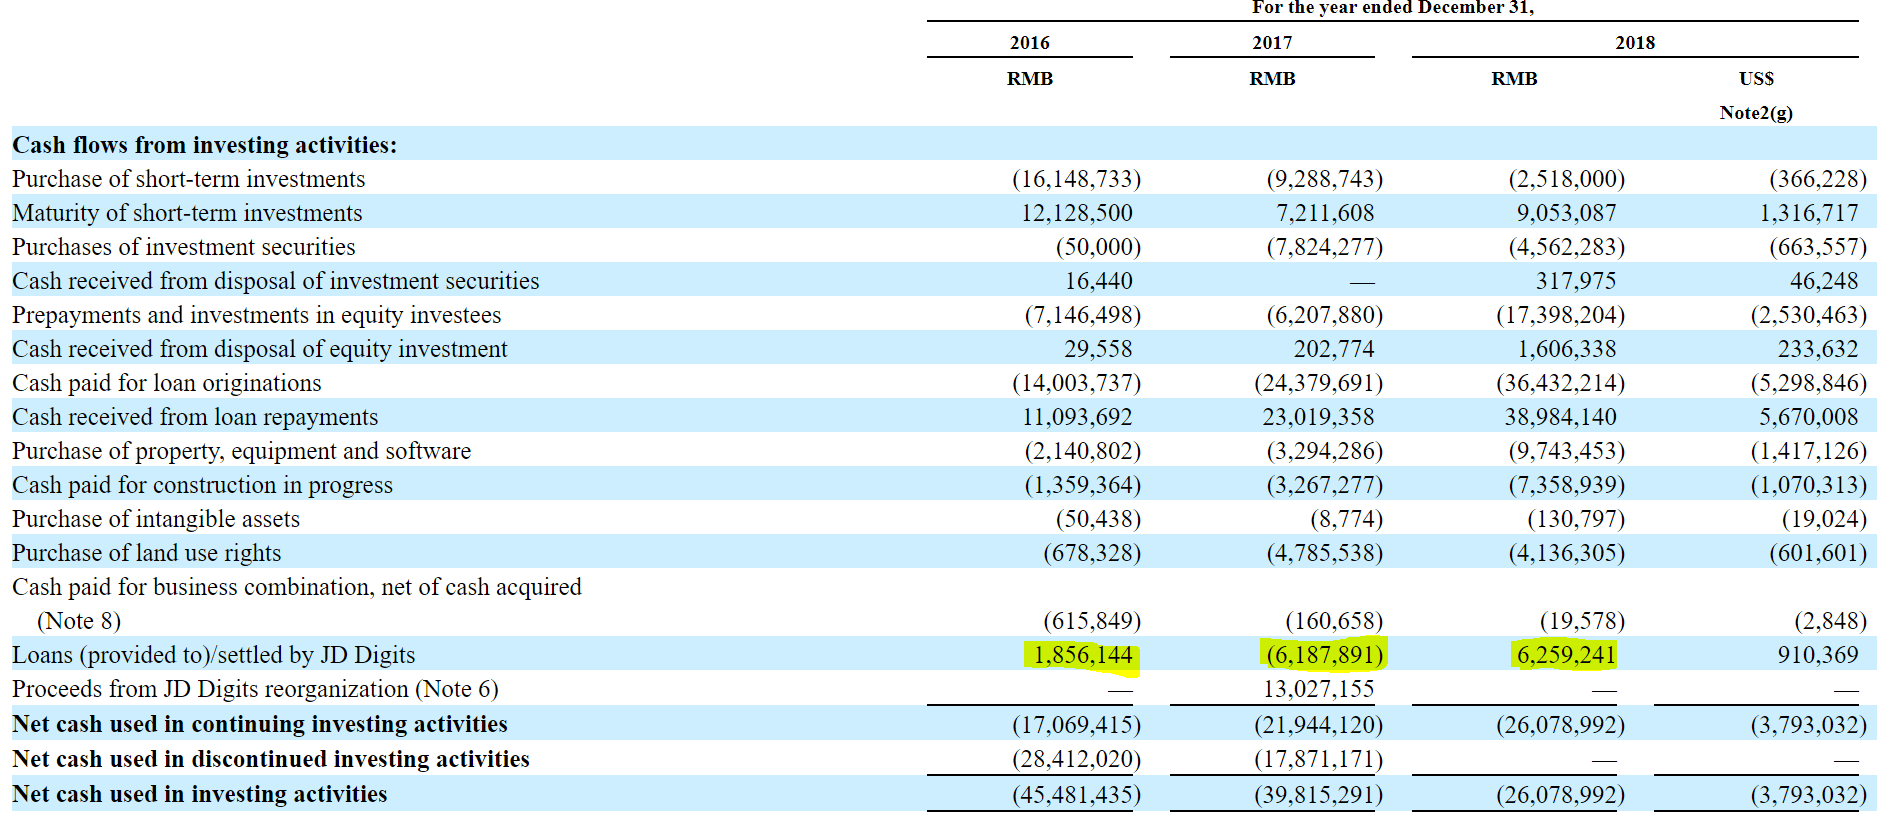
Chart 7: Cash Flows from investing activities of JD.com on December 31, 2018 (Sources: Chart screenshot by the author with data from JD.com SEC Filing)
Even though JD.com never reveals the details of the loans to JD Digits each quarter, and does not record it in the investing cash flow, we can still make a rough estimate of the number through each quarter’s balance sheet.
Like most large corporations, JD.com has many related entities. Therefore, it posts "Amount due from related parties" and "Amount due to related parties" in its balance sheets. It was mentioned in the previous section that after the spin-off reclassification, the "Amount due from related parties" increased to 9 billion from 1.4 billion at the end of Q4 2016". This indicated that the amount due from JD Digits was 7.6 billion, accounting for 84% of total "Amount due from related parties". During November 2015, 2019's earnings release, the balance of "Amount due from related parties" increased 91% from the previous quarter and reached RMB 10 billion. If we assume the ratio remains stable, the amount due from JD Digits would be RMB 8.4 billion.
The "Amount due from related parties" is under current assets, and the increase of this balance will reduce JD.com's operating cash flow. However, it is a static number that is only reported at quarter-end. Also, it is very hard for investors to track the associated real-time risks.
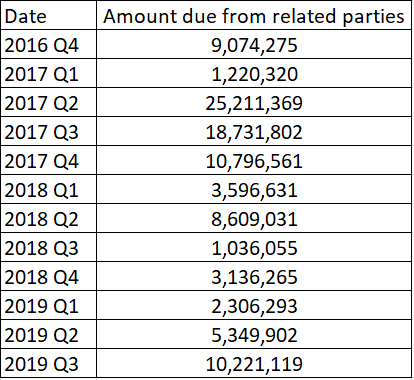
Chart 7: Amount due from related parties of JD.com (Sources: Table created by the author with data from JD.com SEC Filing)
Summary:
After investigating the transactions between JD.com and JD Digits, we can draw their potential relationship in the diagram below:
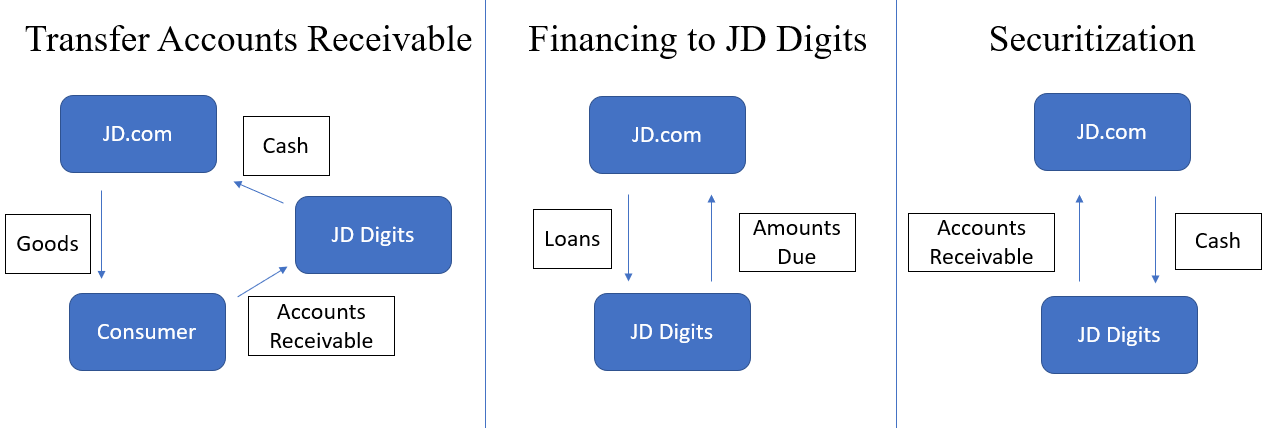
Chart 8: Relationship between JD Digits and JD.com (Sources: Chart created by the author)
Consistent with my analysis, JD Digits is responsible for offering consumer financing loans at JD.com's e-commerce platform. JD digits will receive "Accounts receivable" from consumers and pay cash to JD.com. During securitization, JD.com will purchase the underlying "Accounts receivable" from JD Digits and pay cash in return. Although JD.com sold all its equity stakes in JD Digits in 2017, JD.com continues to provide funding to JD Digits through investing cash by way of cash flow. The accounting methods that JD.com applies make it very hard for investors to gauge the real impact of what is happening.
The boundary between JD Digits and JD.com is blurred, and the risks associated with accounts receivable loans have never truly spun-off from JD.com.
JD.com very likely overstates its operating cash flow and its profits and, therefore, investors should pay special attention to the risks and the increase in lending from JD.com to JD Digits. Because of this, investors should discount JD's operating cash flow.
Disclaimer: For purposes of report leverage accounting analysis, I contacted JD.com Investor Relations and requested their comments on Questions 1-3 below:
- My conclusion that JD's accounts receivable loans are essentially hidden within JD Digits.
- JD does not reveal enough information about the transactions between JD and JD Digits
- My conclusion that JD created "Assets held for sale" and "Liabilities held for sale" in order to balance the pre- and post-JD Digits balance sheet.
However, I did not receive any replies from JD.com