GDX Weekly: Price Discovery Lower Toward Key Support Area, 28s-27.70s

Feb. 08, 2020 3:56 PM ETVanEck Gold Miners ETF (GDX)GDX3 Comments
Sharedata Futures
1.47K Followers

Summary

  • Price discovery lower to 28.40s through key support, 28.60s, in Monday’s auction as last Friday’s late buyers failed to hold the auction.
  • Sell-side continuation to 27.77s in Tuesday’s trade before buying interest emerged, halting the sell-side sequence, developing balance, 27.77s-28.70s, into the week’s end.
  • Bullish breadth is declining from bullish extreme area.
  • This week’s auction saw price discovery lower through key support, 28.60s, to 27.77s within the key near-term support area.

In this article, we examine the significant weekly order flow and market structure developments driving NYSEARCA:GDX price action.

In our most recent GDX Weekly, it was noted that the highest probability path was for price discovery higher, barring failure of 28.60s as support. After a week of balance trade, 28.23s-29.24s, price discovery lower developed this week as the key support, 28.60s, failed. Sell-side continuation developed to 27.77s within the key near support area where buying interest emerged, developing balance, 27.77s-28.67s, ahead of Friday’s close, settling at 27.93s.

GDX Weekly 24Jan20

03-07 February 2020:

This week’s auction saw price discovery lower in Monday’s auction as last Friday’s late buyers failed to hold the auction. Price discovery lower developed in Monday’s trade, achieving a stopping point, 28.40s, as buying interest emerged. Minor retracement higher developed to 28.69s before buying interest emerged, 28.55s-28.57s, at/near key support into Monday’s close. Monday’s late buyers failed to hold the auction as a gap lower open developed in Tuesday’s trade. Sell-side continuation unfolded, achieving the weekly stopping point low, 27.77s, within the key January 2020 demand area. Buying interest emerged there, 27.79s-27.93s, halting the sell-side sequence.

Price discovery higher began in Tuesday’s trade, continuing into Thursday’s auction, achieving a stopping point, 28.51s, where buying interest emerged, 28.51s-28.43s, testing the sell-side breakdown area into Thursday’s close. Thursday’s late buyers held the auction initially in Friday’s trade as a probe higher developed, achieving the weekly stopping point high, 28.67s. Sell excess developed there, halting the buy-side sequence at/near key resistance (prior support). Price discovery lower ensued to 27.94s, before narrow balance developed, 27.94s-28.15s, ahead of Friday’s close, settling at 27.93s.

GDX Weekly 07Feb20

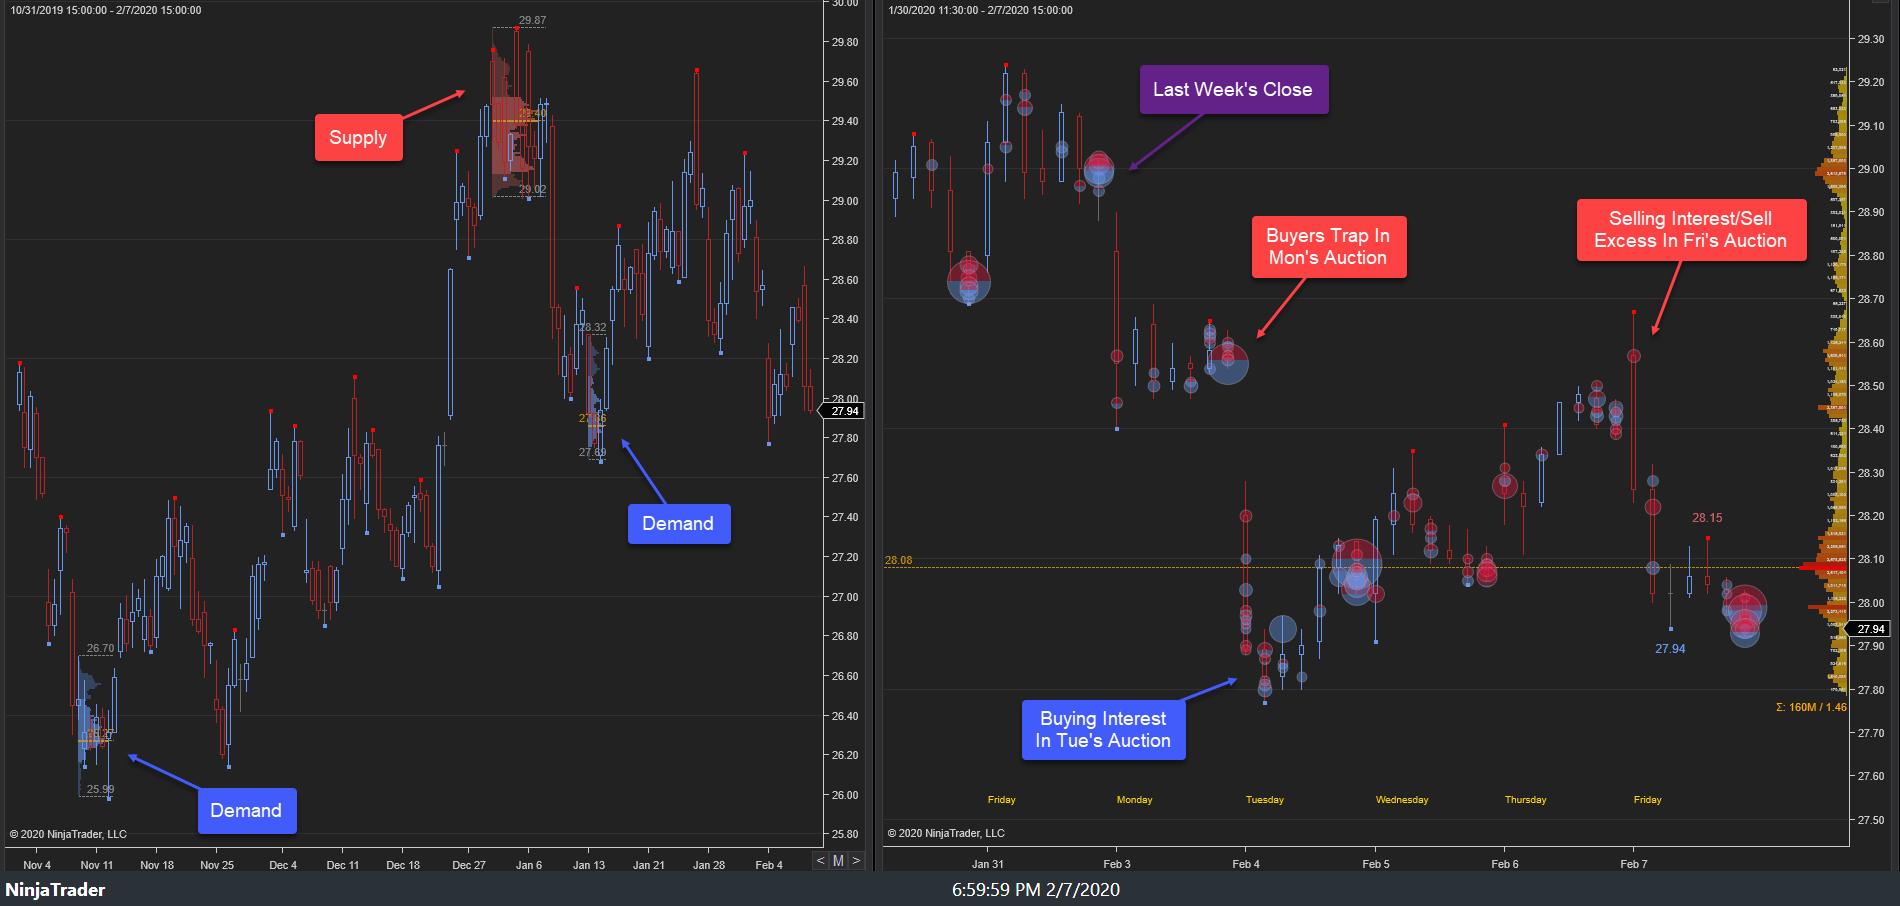
This week’s auction saw a sell-side breakdown through key near-term support, 28.60s, before a re-test of this area held and price traded lower to the key near-term demand area, 28s-27.70s. Within the larger context, balance development continues, 31s-25.98s, following

This article was written by

1.47K Followers
Historical Data Mining & Visualization for NYMEX energy markets. Our experience derives from the proprietary trading world involved in US Index derivatives, commodity ETF derivatives, and exchange-traded NYMEX WTI derivatives.Futures trading contains substantial risk and is not for every investor. An investor could potentially lose all or more than the initial investment. Risk capital is money that can be lost without jeopardizing ones financial security or life style. Only risk capital should be used for trading and only those with sufficient risk capital should consider trading. Past performance is not necessarily indicative of future results.

Analyst’s Disclosure:I/we have no positions in any stocks mentioned, and no plans to initiate any positions within the next 72 hours. I wrote this article myself, and it expresses my own opinions. I am not receiving compensation for it (other than from Seeking Alpha). I have no business relationship with any company whose stock is mentioned in this article.

Seeking Alpha's Disclosure: Past performance is no guarantee of future results. No recommendation or advice is being given as to whether any investment is suitable for a particular investor. Any views or opinions expressed above may not reflect those of Seeking Alpha as a whole. Seeking Alpha is not a licensed securities dealer, broker or US investment adviser or investment bank. Our analysts are third party authors that include both professional investors and individual investors who may not be licensed or certified by any institute or regulatory body.

Recommended For You

About GDX ETF

SymbolLast Price% Chg
Expense Ratio
Div Frequency
Div Rate
Yield
Assets (AUM)
Compare to Peers

More on GDX

Related Stocks

SymbolLast Price% Chg
GDX
--