Readers have requested, both in comments on articles I've written for SA, and in emails, for more on the performance record of the software I developed and use, and for example reports. It is my hope that this article will be a satisfactory response.
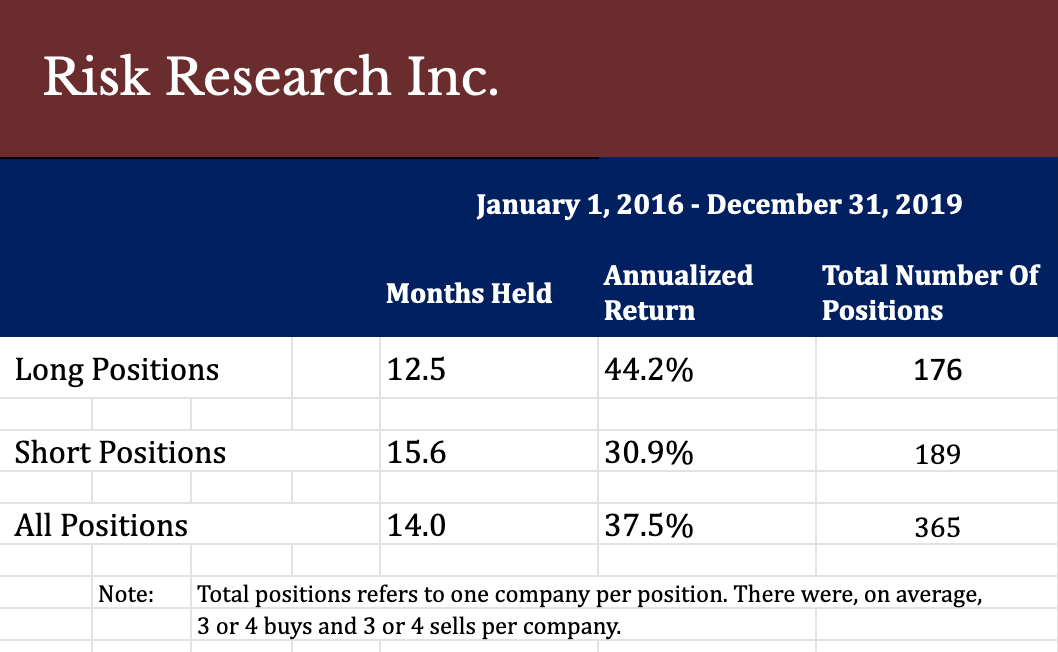
Here is the long/short performance of the total portfolio since 2016. Click here to see the complete list of long and short positions taken. New positions taken in 2020 are excluded both from this record; these are covered in current my research reports - the BarnBurners and The Dirty Dogs.
Notes:
- The software evolved over a period of years. Originally, its purpose was as a tool in a risk analysis consulting service that served mutual funds, hedge funds, and family offices. As such, although I include results from the earlier versions of the software, it has evolved significantly and early results are not particularly relevant to current performance. Gradually, steadily, the results have improved.
- Some positions that were highly profitable are not included in this performance record because they don't meet the timing criteria (as described above) developed over the last year, or because they were acquired or liquidated (in bankruptcy) I don't know whether or not they met the timing criteria. The purpose of this article is to explore the potential of the current strategy including its timing aspects. Since those positions might not have been taken if the software had been used at the time of the buy/sell decision, they are not included here.
- Some examples of short positions actually taken based on the financial statement analysis software that are not included in the performance record because of the unknown timing analysis:
- CETX - position taken at around $10, now at $1.20.
- RYCE - $150 now $7.30 (reverse split adjusted).
- RBS - $10 now $5.95. And now