The precious metals sector of the commodities market posted a loss over the first quarter of 2020 despite gains in palladium and gold. Rhodium moved higher, but silver and platinum both fell sharply.
The spectacular rise in digital currencies throughout 2017 came to a brutal end in 2018 as Bitcoin and the other cryptocurrencies declined precipitously. The air went out of the cryptocurrency asset class balloon throughout 2018. In 2019, the prices of most digital currencies rebounded. In Q1 2020, many of the cryptocurrencies posted losses, but there were some gains.
Precious metals are moving into Q2 with impressive gains in palladium and rhodium, and a continuation of the bullish price action in gold, which made higher highs in Q1. Silver de-coupled from gold and platinum posted a double-digit percentage loss in Q1 in a pattern of underperformance that has been in place since 2014. Gold moved to new record levels in almost all world currencies except for Swiss francs and the US dollar during 2019 and early 2020. The Aberdeen Standard Physical Precious Metals Basket Shares ETF product (NYSEARCA:GLTR) holds a diversified basket of physical positions in gold, silver, platinum, and palladium.
Gold Review
Gold fell 10.46% in 2015, but it rallied by 8.66% in 2016. The yellow metal posted a 13.65% gain in 2017. Gold moved 2.14% lower in 2018. Gold was 18.87% higher in 2019. In Q1, the precious metal continued to march higher as it gained 3.96%. Gold traded in a range between $1519.70 and $1707.80 so far in 2020 and settled on March 31 at $1583.40 per ounce. The dollar index rose by 3.16% in Q1. Gold's rise continues to be a testament to its overall strength considering the rising dollar.
Gold has not only been moving higher in dollar terms but also in euro and yen currency terms, which is the sign of a bull market in the precious metal.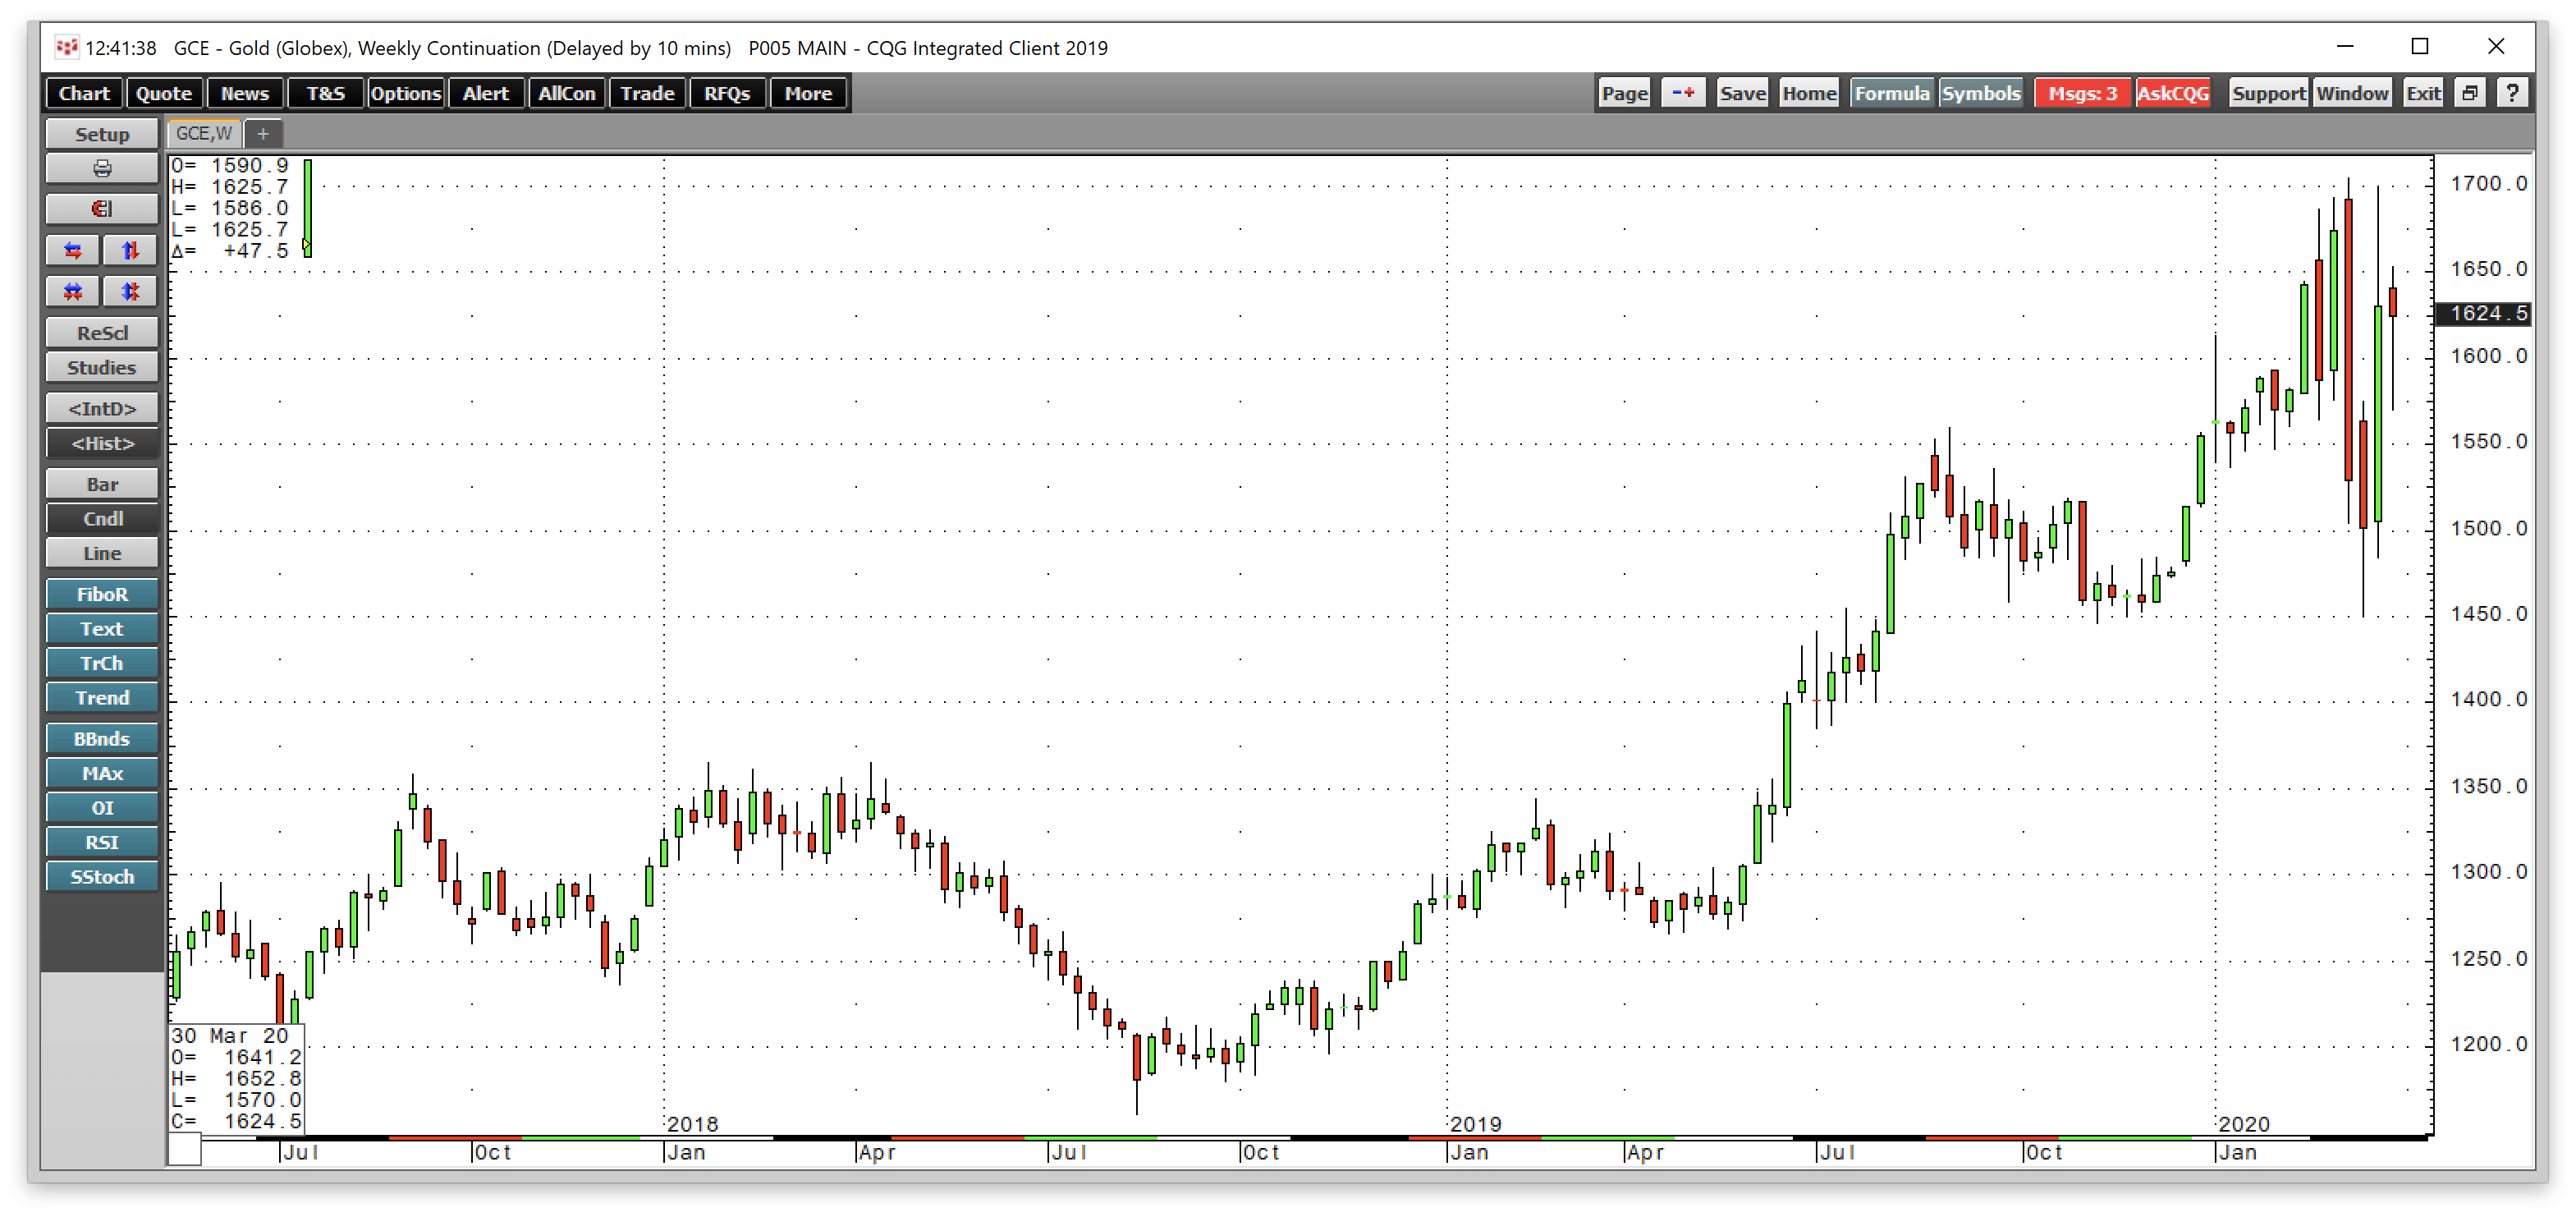
Source: CQG
The weekly chart shows that gold has been moving higher in dollar terms since August 2018.
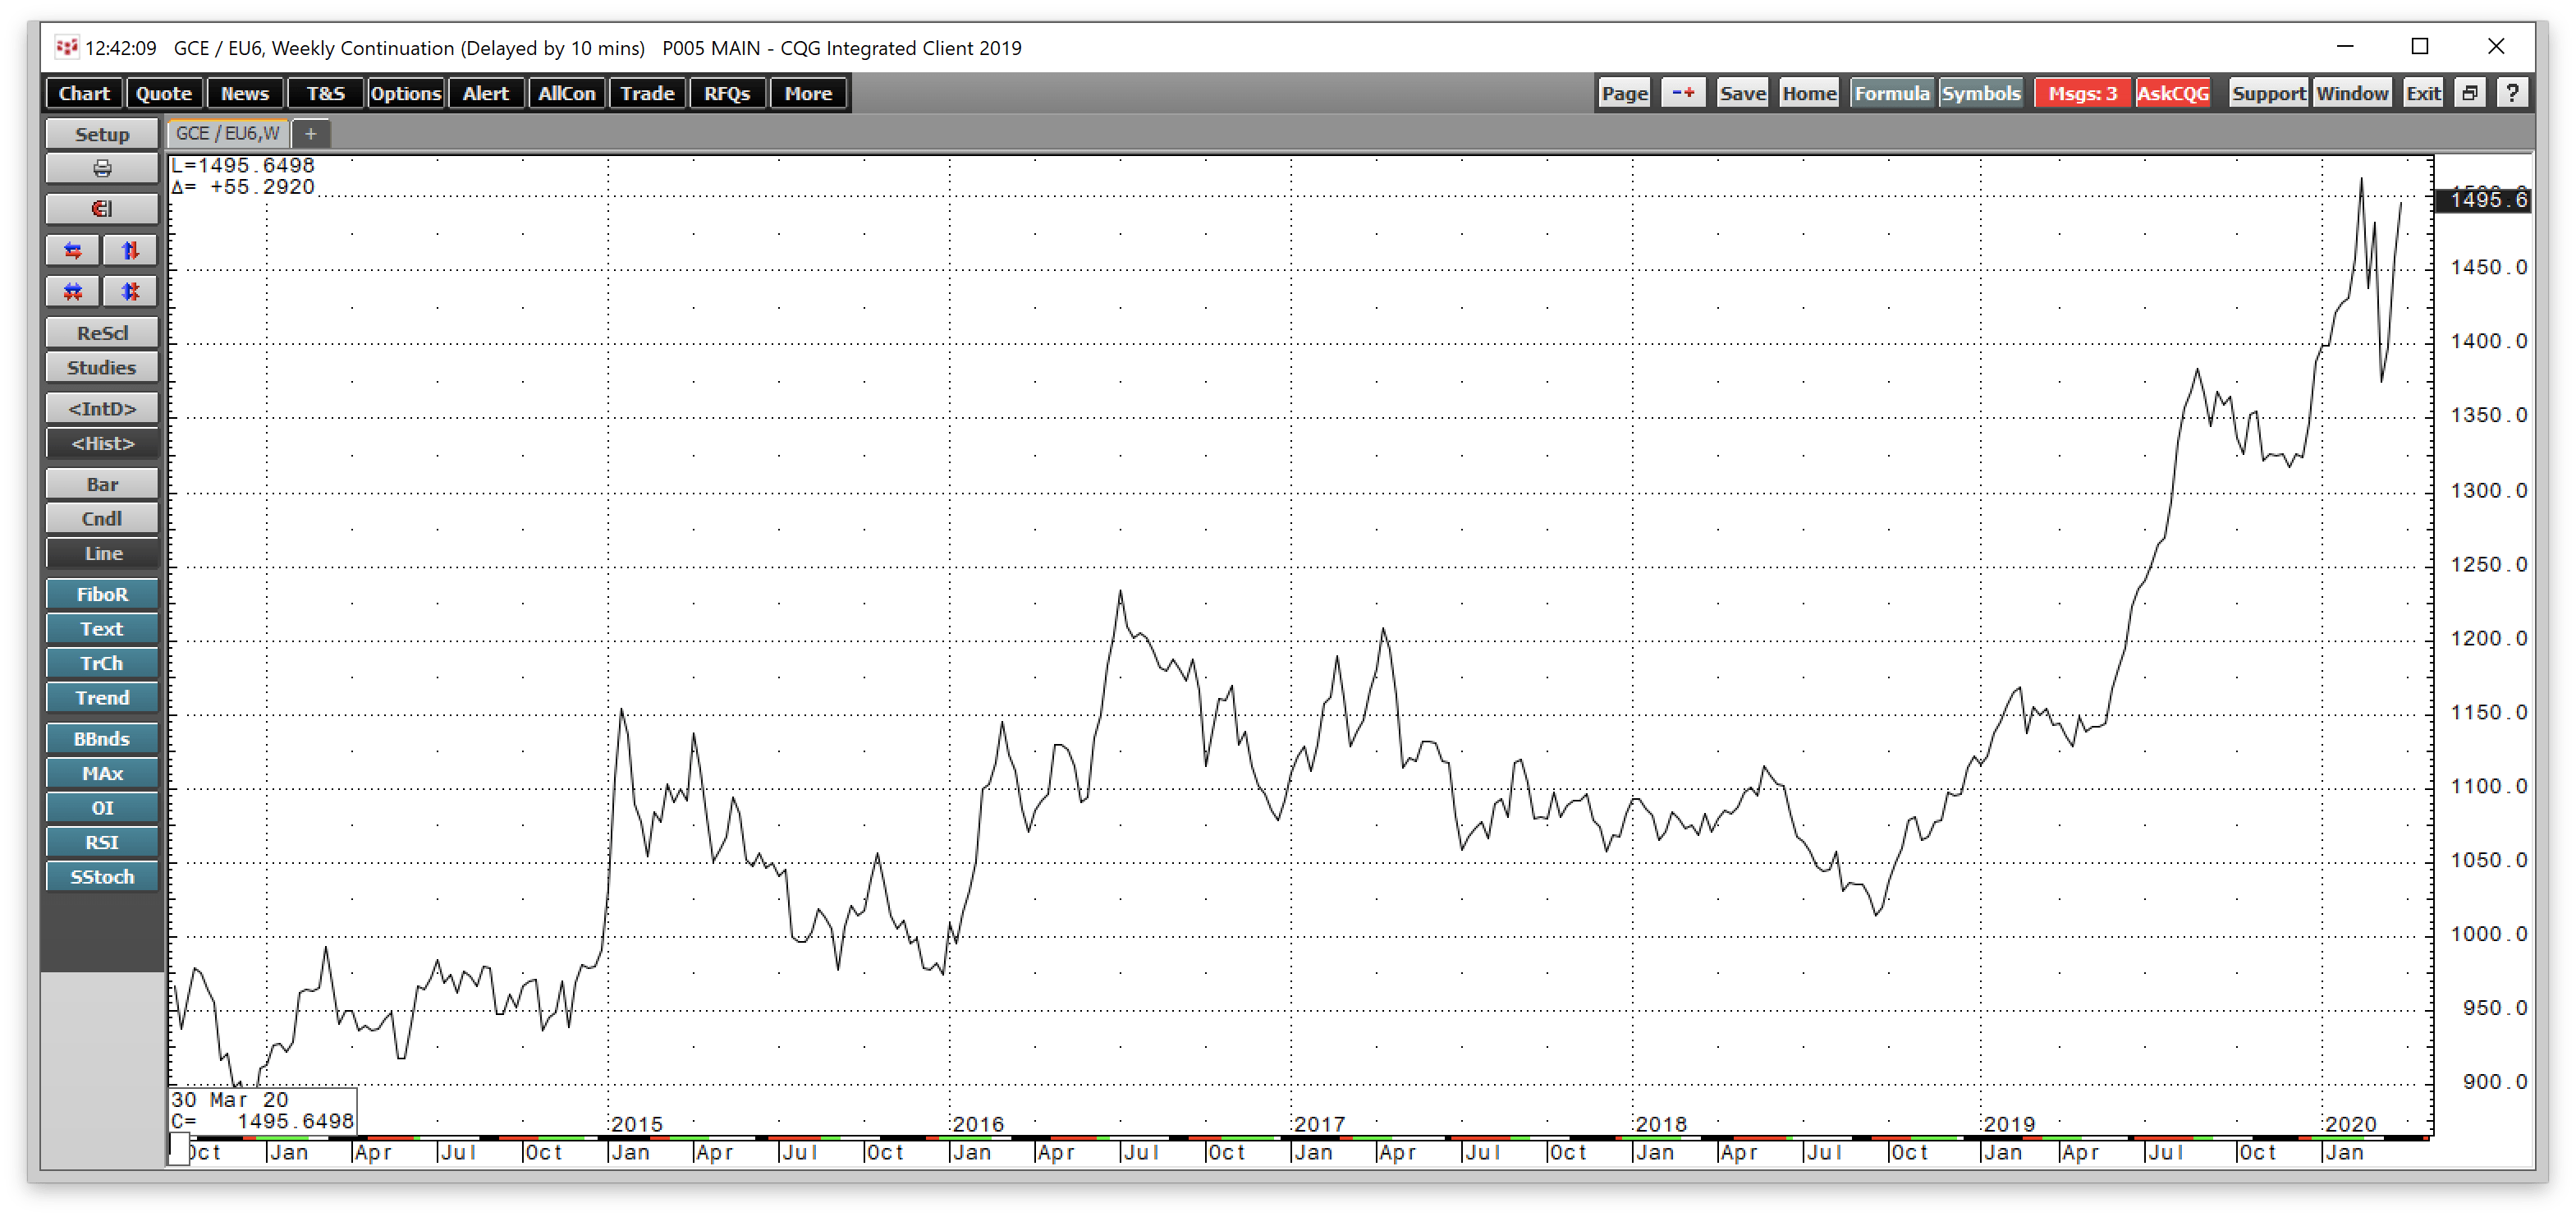
Source: CQG
The weekly chart of gold in euro currency terms shows price appreciation since late 2018.
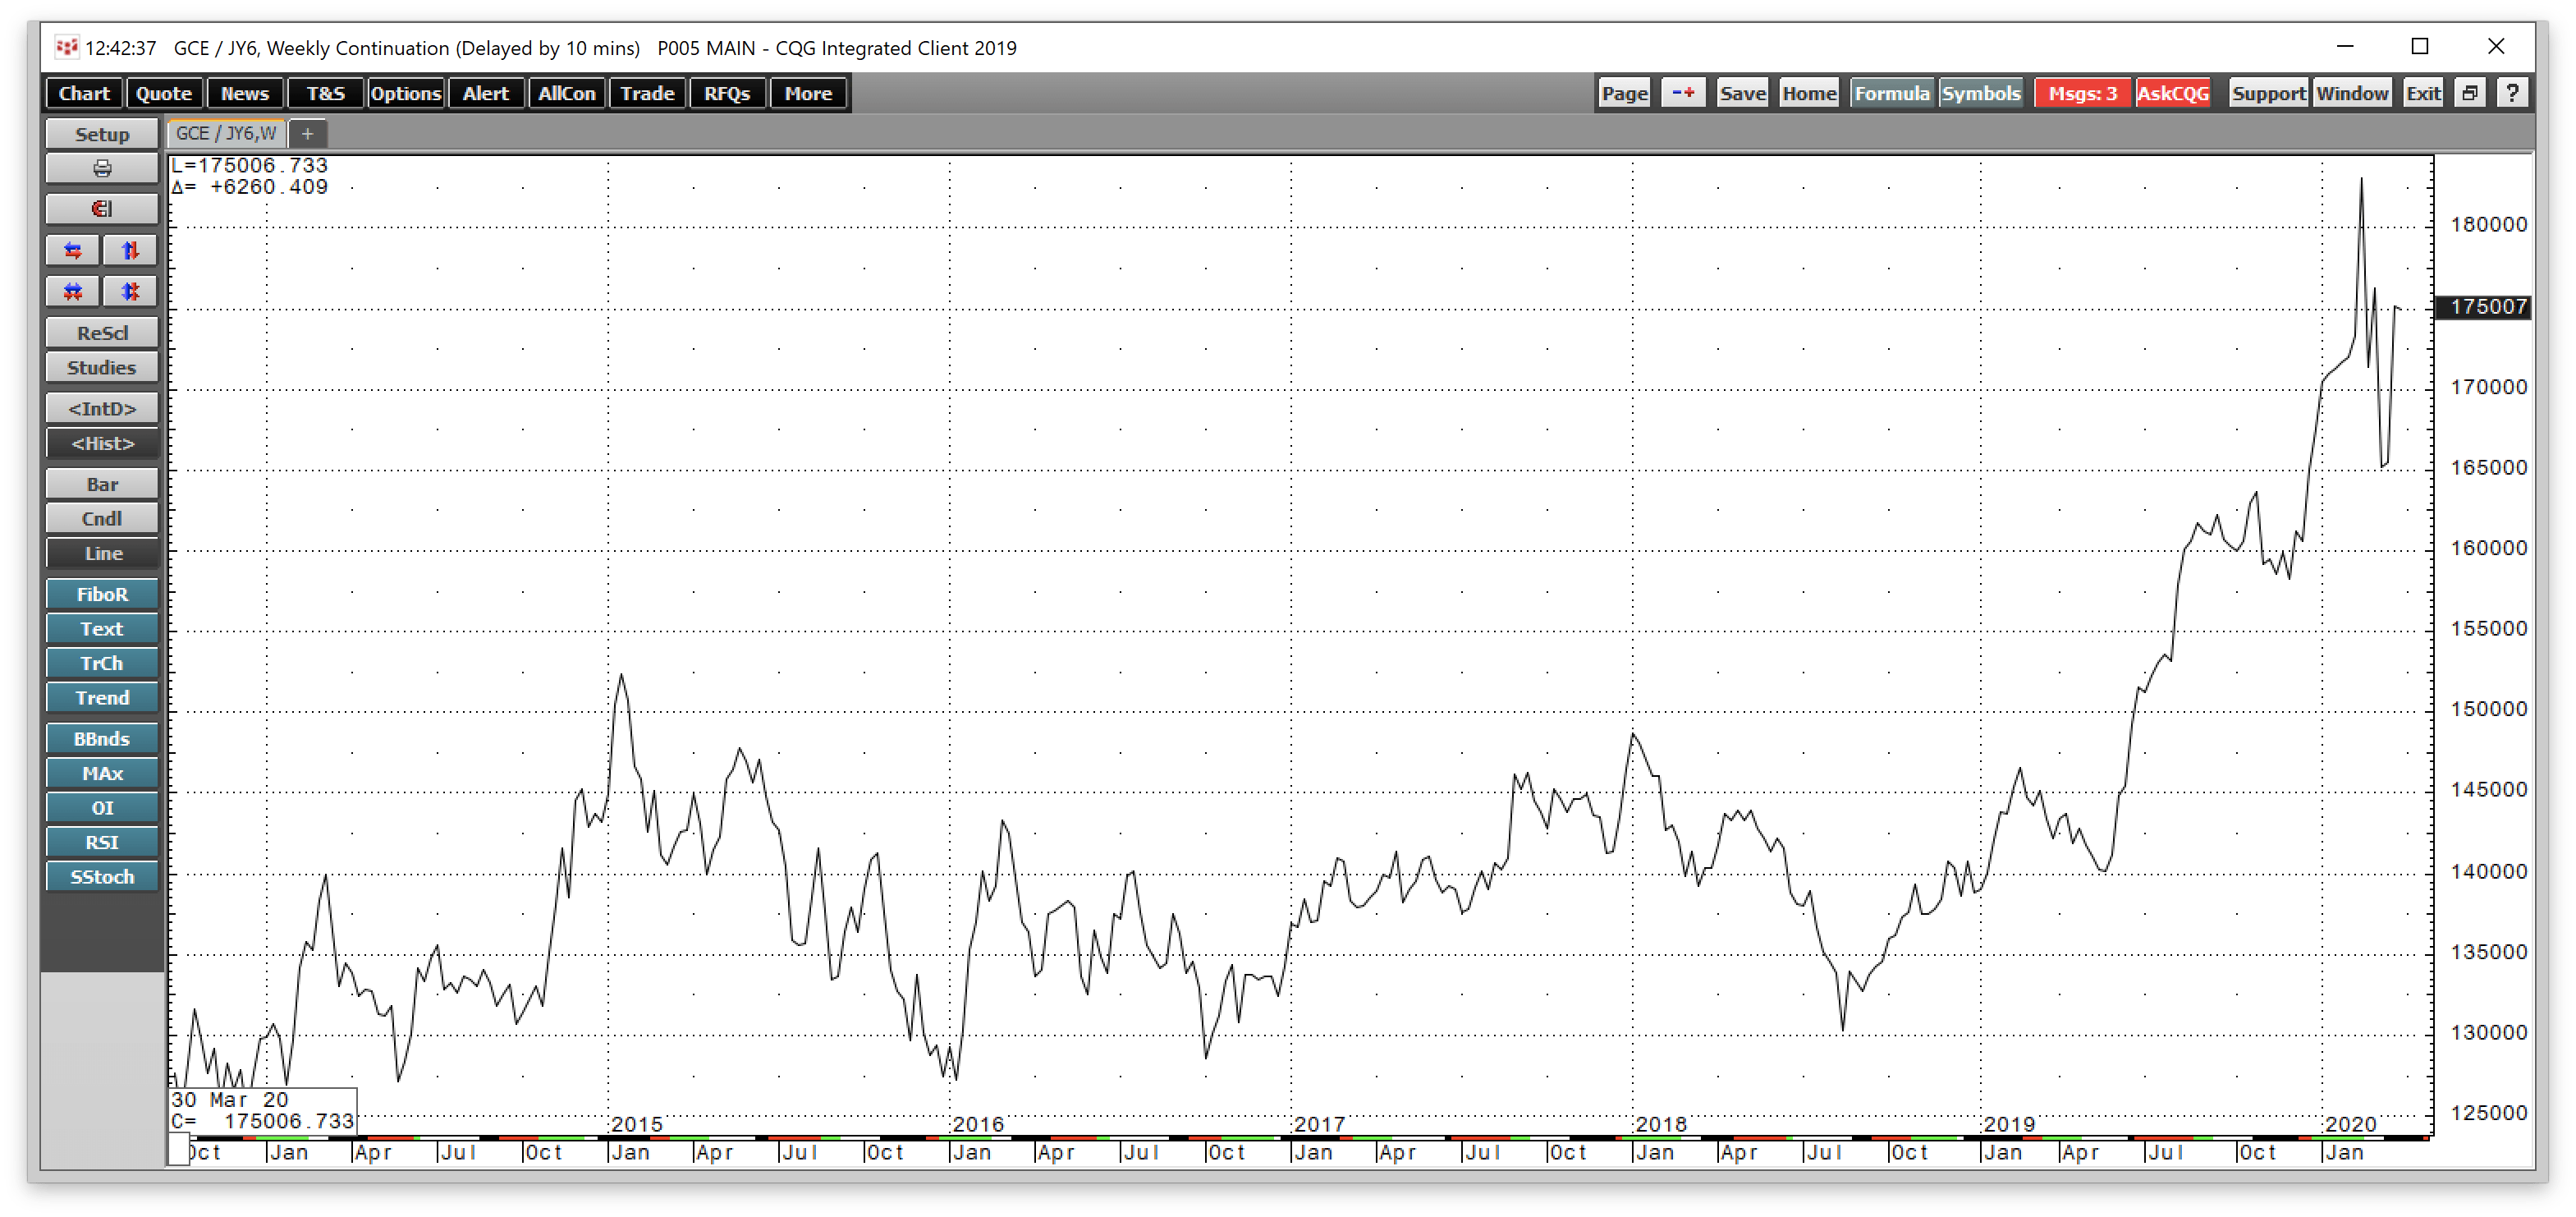
Source: CQG
In yen terms, gold has also been in bullish mode on the weekly chart.
The GDX, which is an ETF that represents the leading gold mining companies, closed Q1 at $23.04 compared to $29.28 at the end of Q4 2019. GDX fell 21.31% in Q1 after gaining 38.83% in 2019. The leading gold mining stocks outperformed the yellow metal in 2019, which was a bullish sign for the gold market. However, the stocks underperformed in Q1 as risk-off conditions weighed on prices of the mining shares.
The GDXJ, the ETF that tracks the junior gold mining companies, closed Q1 at $28.10 after settling at $42.26 at the end of Q4 2019. GDXJ moved 33.51% lower in Q1 but was 39.84% higher in 2019. GDX and GDXJ underperformed the price action in gold in Q1 after significant gains in 2019.
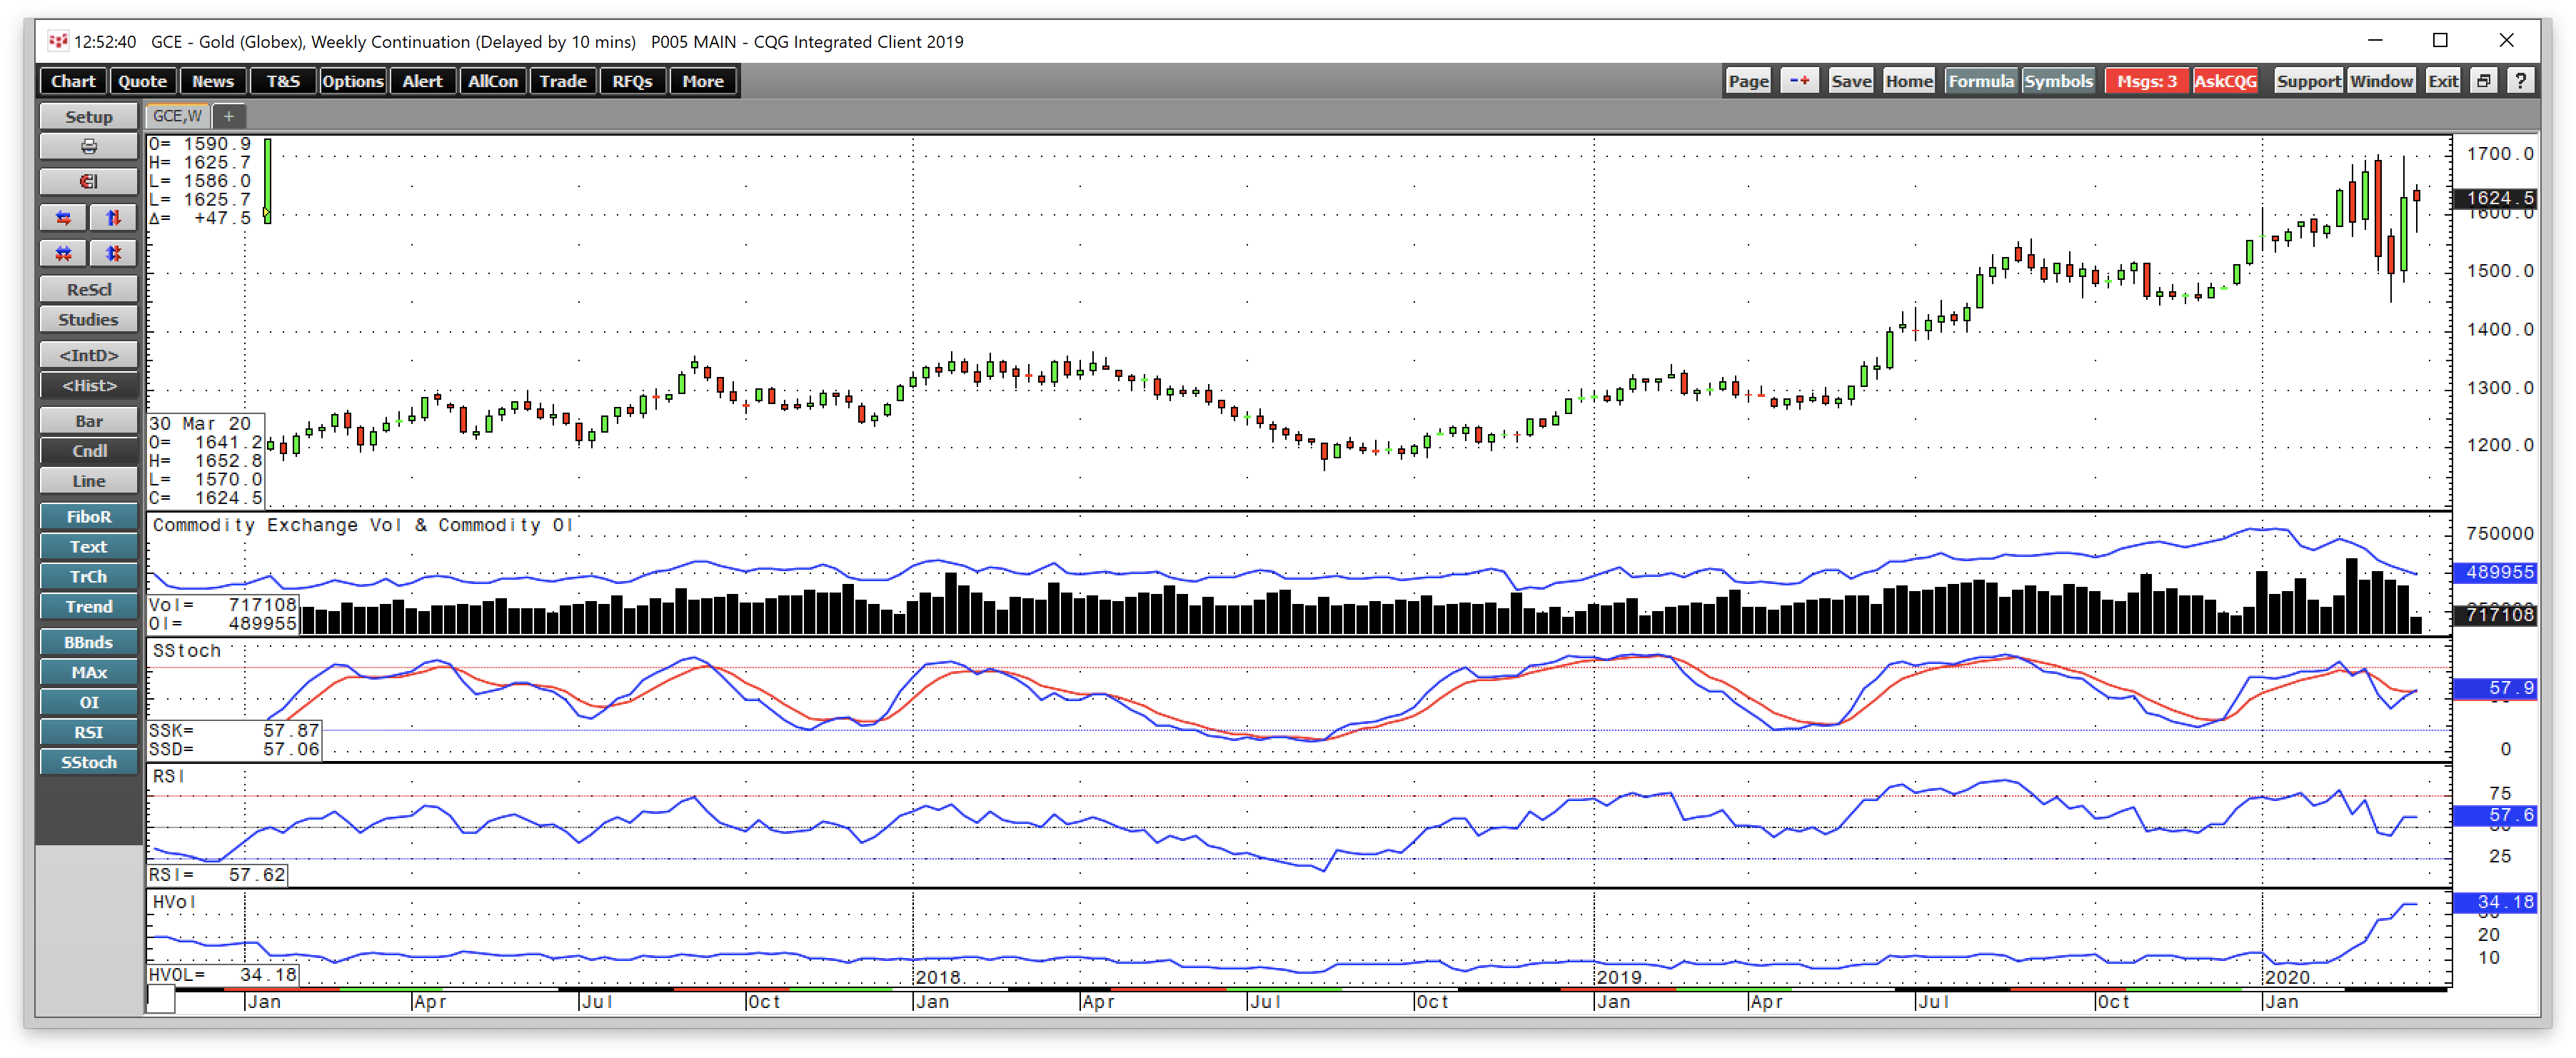
Source: CQG
The weekly chart illustrates that gold had been in a bullish trend since the mid-August 2018 low at $1161.40 per ounce. Gold hit a peak at just under the $1560 level on the continuous contract in early September and ran out of some steam on the upside. The price corrected to a low at $1446.20 during Q4 but bounced back over the $1520 level by the end of the year. In Q2, gold rose to a higher high of $1613.30 on January 8 as tensions rose to a boiling point between the US and Iran. After the situation calmed, the price fell to a higher low of $1536.40 before moving to another new peak at $1704.30 in March as the fears over Coronavirus mounted. Risk-off conditions caused the price to correct to $1450.90 in mid-March before moving higher.
Gold is moving into Q2, making higher lows and higher highs. Price momentum and relative strength were just above neutral territory. The stronger dollar, which made a new high in Q1, had not stood in front of recent gains throughout 2019 and the first quarter of 2020. A dovish Fed is a supportive factor for the gold market.
The data in the gold market suggests a continuation of the bull market that began in the early 2000s and experienced its next leg higher starting in June 2019. Gold's rally in all currency terms is a validation of the upward trajectory of the price.
Silver Review
Silver was 15.32% higher in 2019. In Q1 2020, the price of silver plunged 21.01% as the precious metal underperformed the price action in gold. Silver traded in a range between $11.64 and $19.005 over the first three months of 2020. Gold continued to make new highs in Q1, but silver remains below the 2019 peak at $19.54 and its critical level of technical resistance at the July 2016 peak of $21.095 per ounce. Silver fell to its lowest price since 2009 in highly volatility conditions.
As we move into Q2, a continuation of bull market action in the precious metals sector could cause a sudden and dramatic change in the silver market. The next technical target for silver above the Q3 2019 high is at the peak of July 2016. However, the price action in Q1 did lots of damage to the silver market.
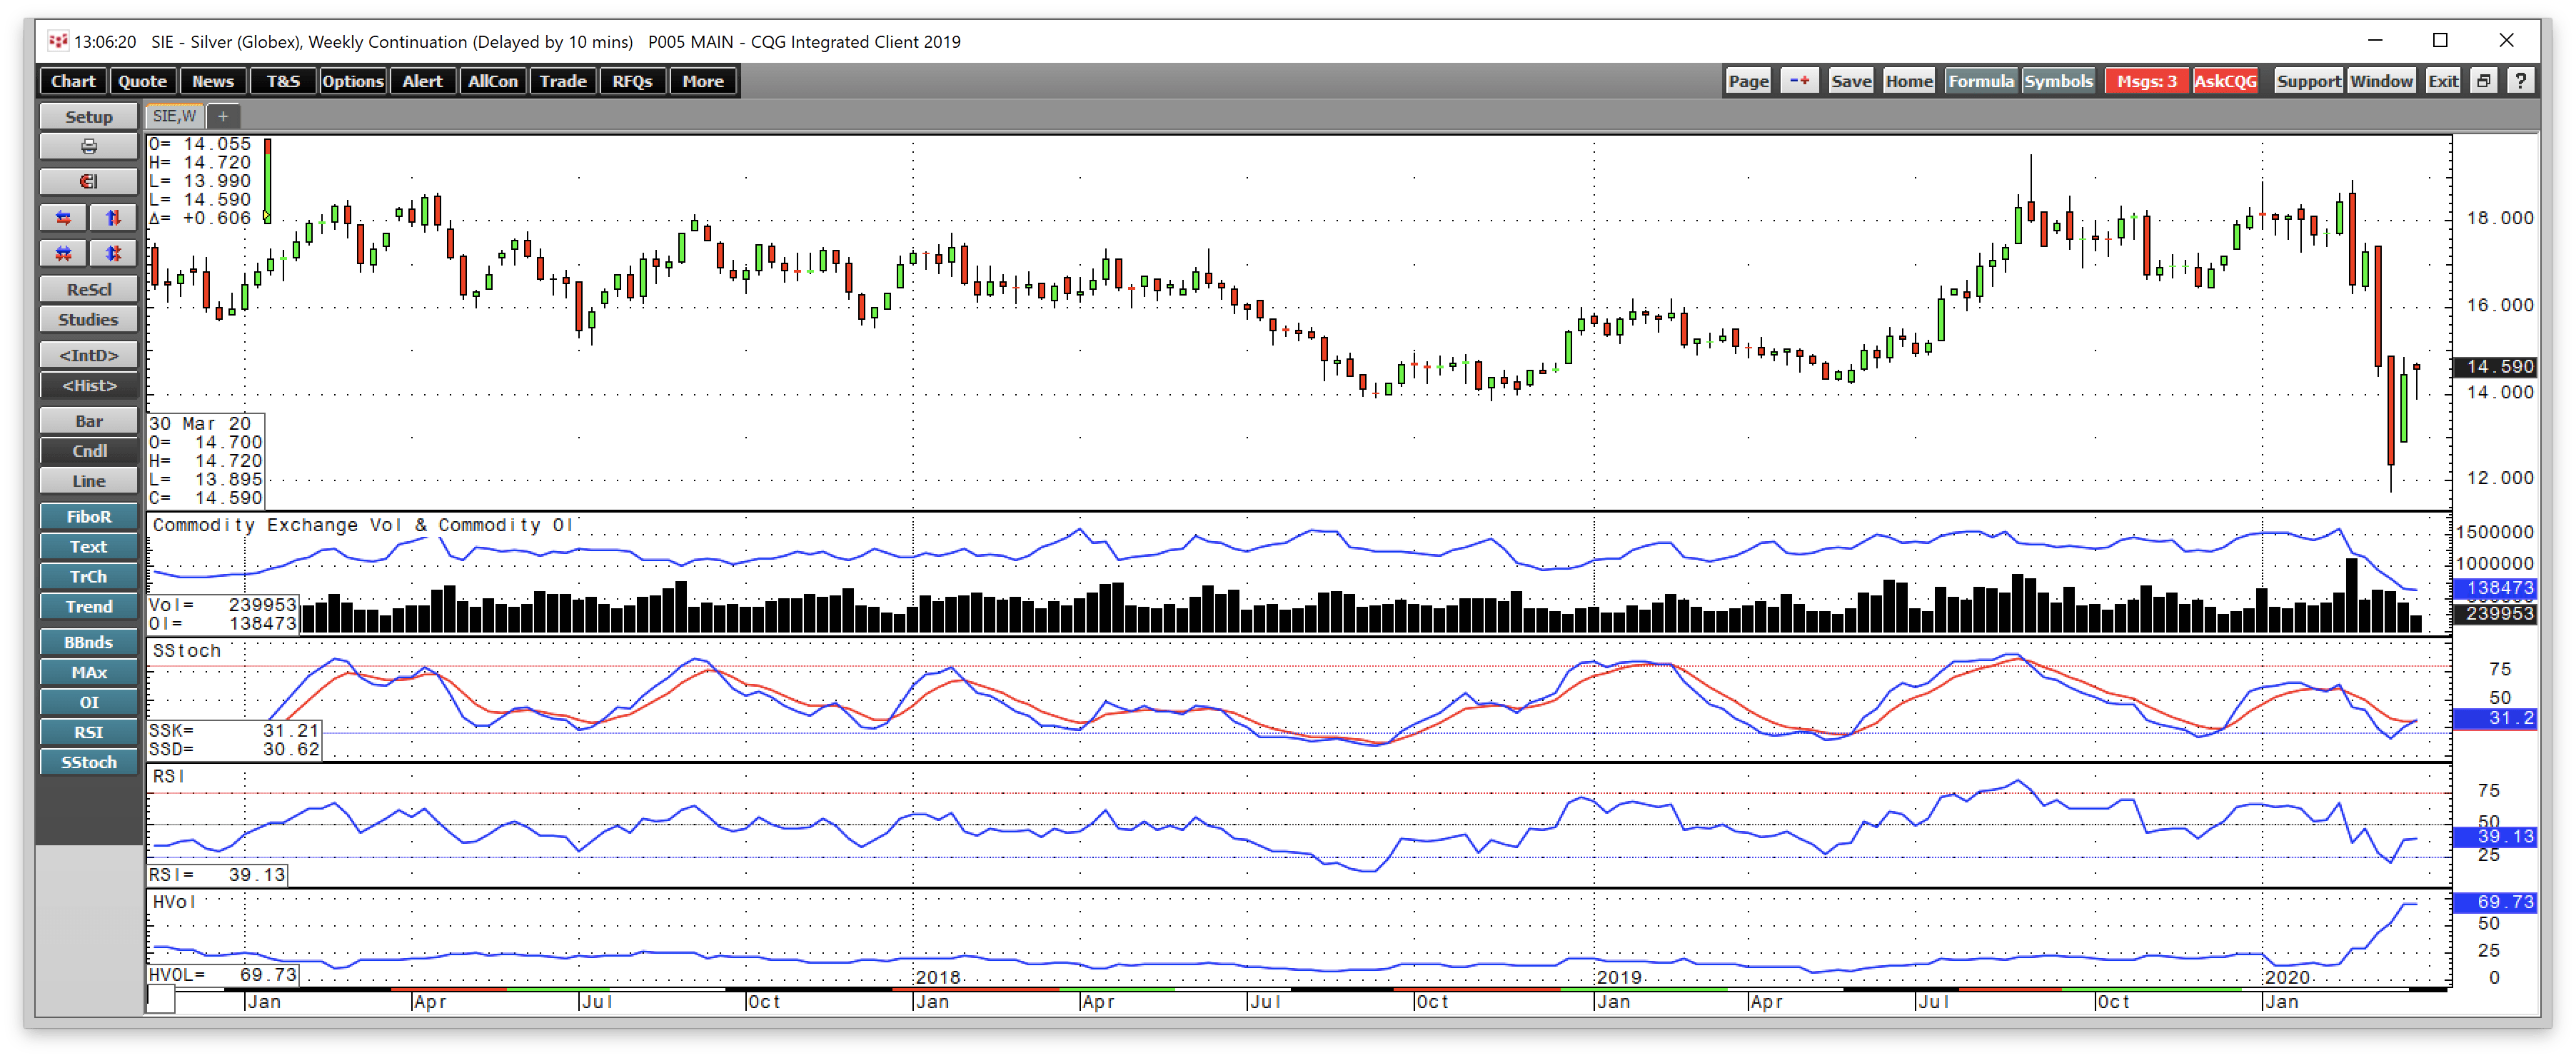
Source: CQG
As the weekly chart highlights, price momentum was below neutral territory at the end of Q1 after putting in a bearish reversal on the weekly chart during the final week of February that led to the price carnage in the silver futures market.
Technical resistance is at the September 2019 peak at $19.54, which stands as the next level on the upside before the July 2016 high at $21.095. Silver blew through the early 2019, 2018, 2017 highs in Q3 2019 before it blew through the support levels on the downside. Silver is a metal that tends to surprise as we witnessed in Q1. Silver closed Q1 2020 at $14.156 per ounce on the continuous futures contract.
Silver's wide price variance in Q1 was a reminder that the volatile precious metal is subject to significant price pressures during risk-off periods. The critical takeaway is not to take anything for granted in the silver market and to employ tight stops on risk positions.
Platinum Review
Platinum tanked in Q1 as it returned to its role as the worst-performing precious metal. Platinum moved 15.18% lower in 2018, but it posted a gain of 22.05% in 2019. In Q1, platinum fell 25.43%,
Platinum traded in a range between $556 and $1052.30 in Q1 and closed the first quarter below the midpoint of the range. In August 2018, platinum fell to its lowest price since the fourth quarter of 2003, a decade and a half low for the precious metal. In Q1, the price fell to $556, the lowest since 2002. Platinum is a metal that offers significant value on a historical basis compared to the prices of all of the other precious metals. However, in Q1, platinum tanked, and fell to the lowest price in almost two decades and underperformed gold, silver, palladium, and rhodium prices.
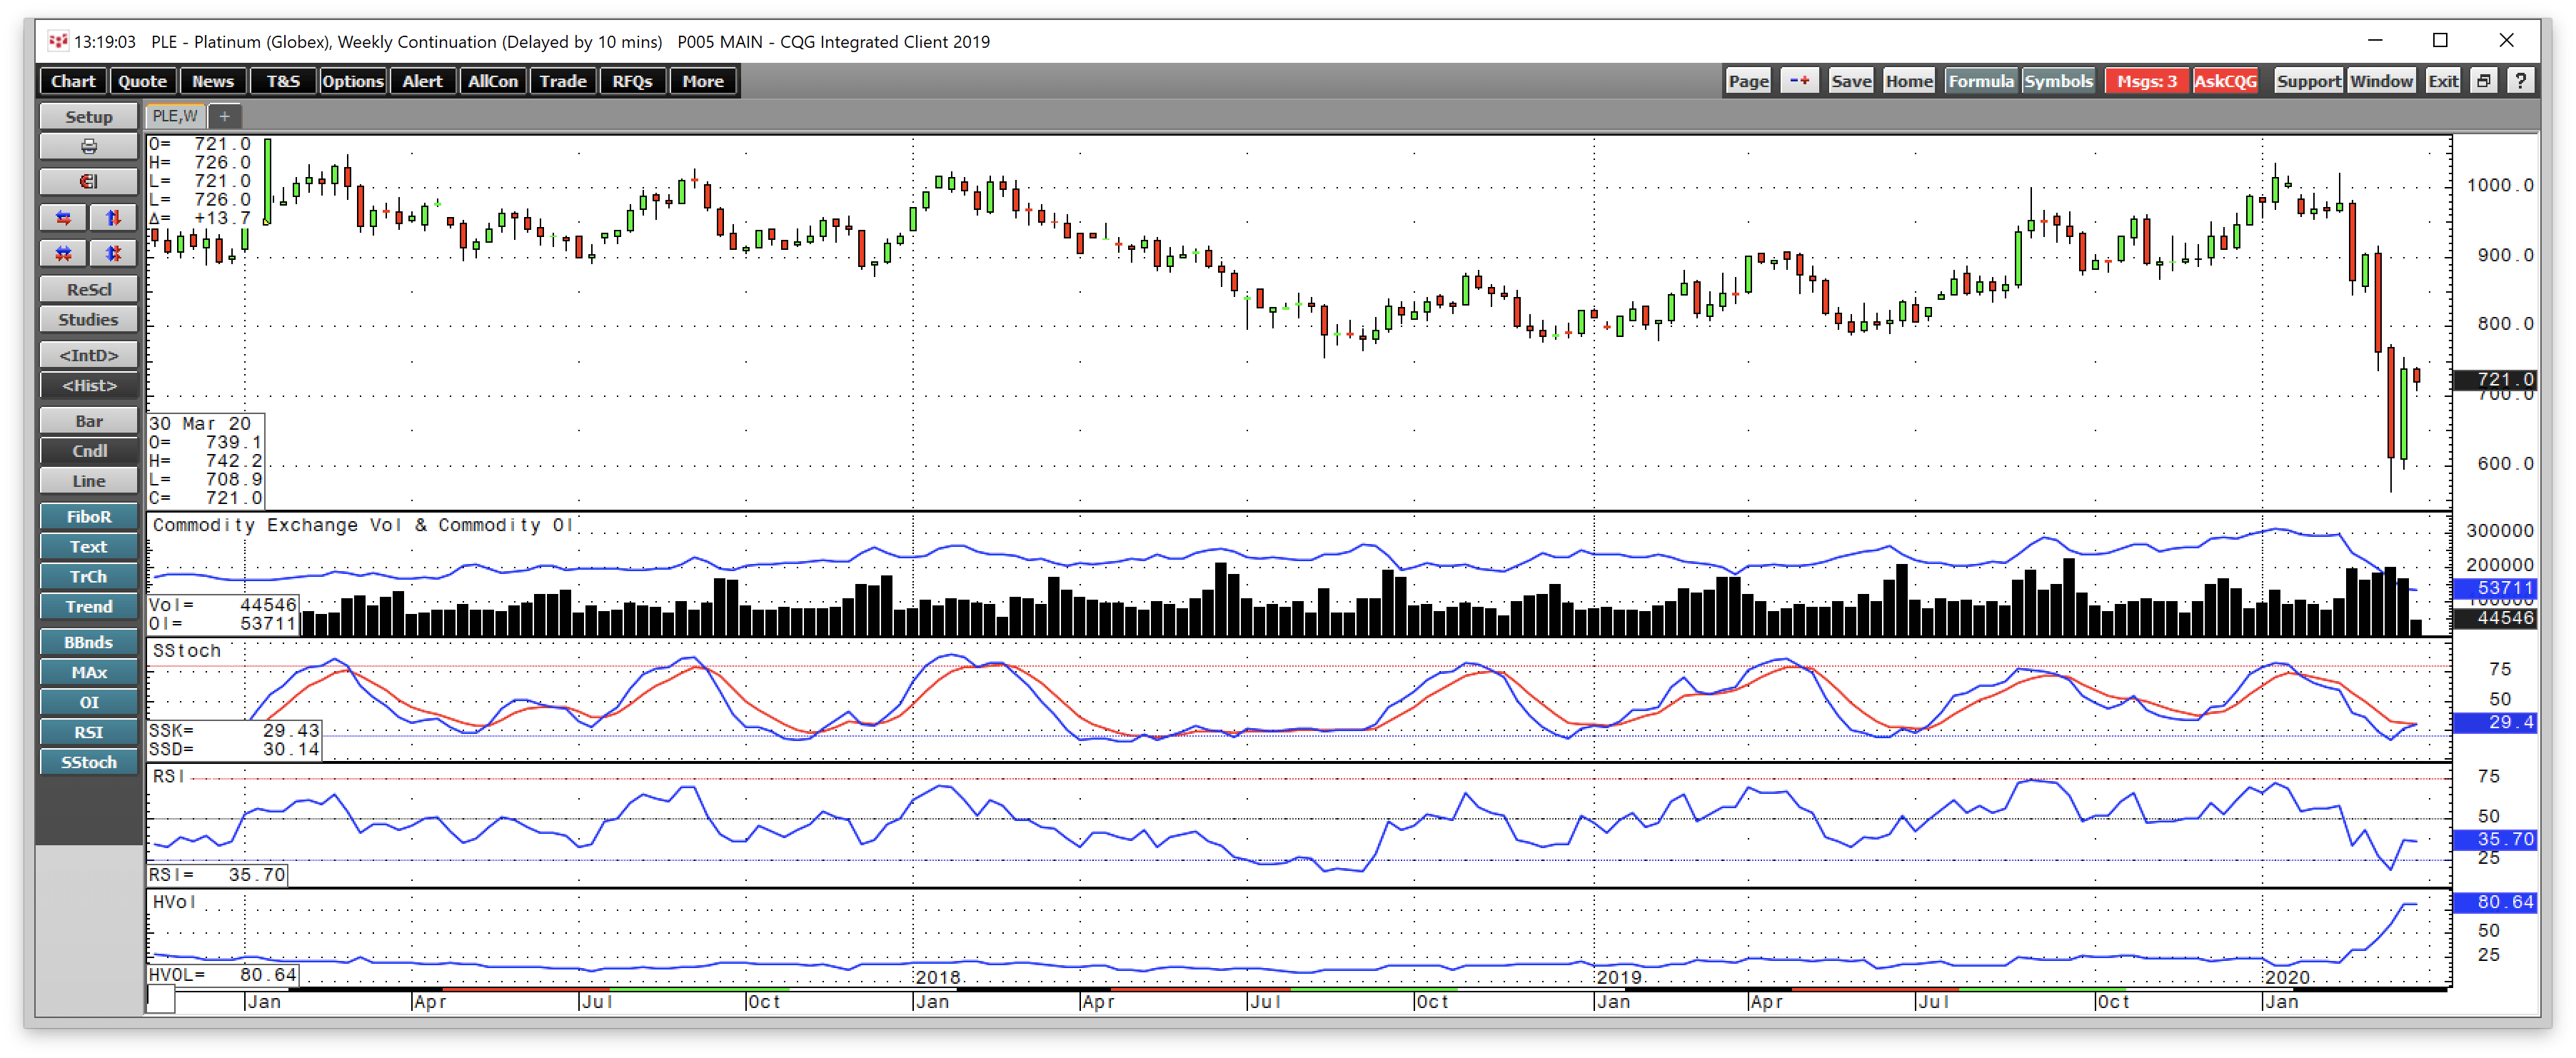
Source: CQG
As the weekly chart shows, price momentum was attempting to cross higher from oversold territory at the end of Q4. Relative strength was also under a neutral reading. The quarterly chart was below neutral territory. The monthly chart was below a neutral reading at the end of Q4.
Meanwhile, platinum also significantly underperformed palladium over the first quarter and remained historically cheap versus its sister metal. Platinum also continued to underperform gold on a historical basis. Platinum is a metal with a compelling case for a significant price recovery. However, it also continued to hand out pain to anyone dipping a toe into the platinum market on the long side, particularly on rally attempts.
Platinum once again disappointed investors in Q1. The metal offers one of the most compelling value propositions in the precious metals arena. Risk-reward continues to favor the upside, but a significant recovery has yet to materialize.
Palladium Review
Palladium was the best performing precious metal that trades in the futures market in 2016, posting a gain of 20.96% for the year. Palladium fell 29.61% in 2015, making it the worst-performing precious metal of that year. Palladium fell to lows of $451.50 per ounce in January 2016. Palladium moved an incredible 56.08% higher in 2017, making it the best performing commodity across all sectors for the year. Palladium moved 12.84% higher in 2018. The price of palladium increased in value by 59.48% in 2019. Palladium was the star performer in the commodities market in 2019. In Q1, the bullish party continued as the price of palladium rose by 20.71%.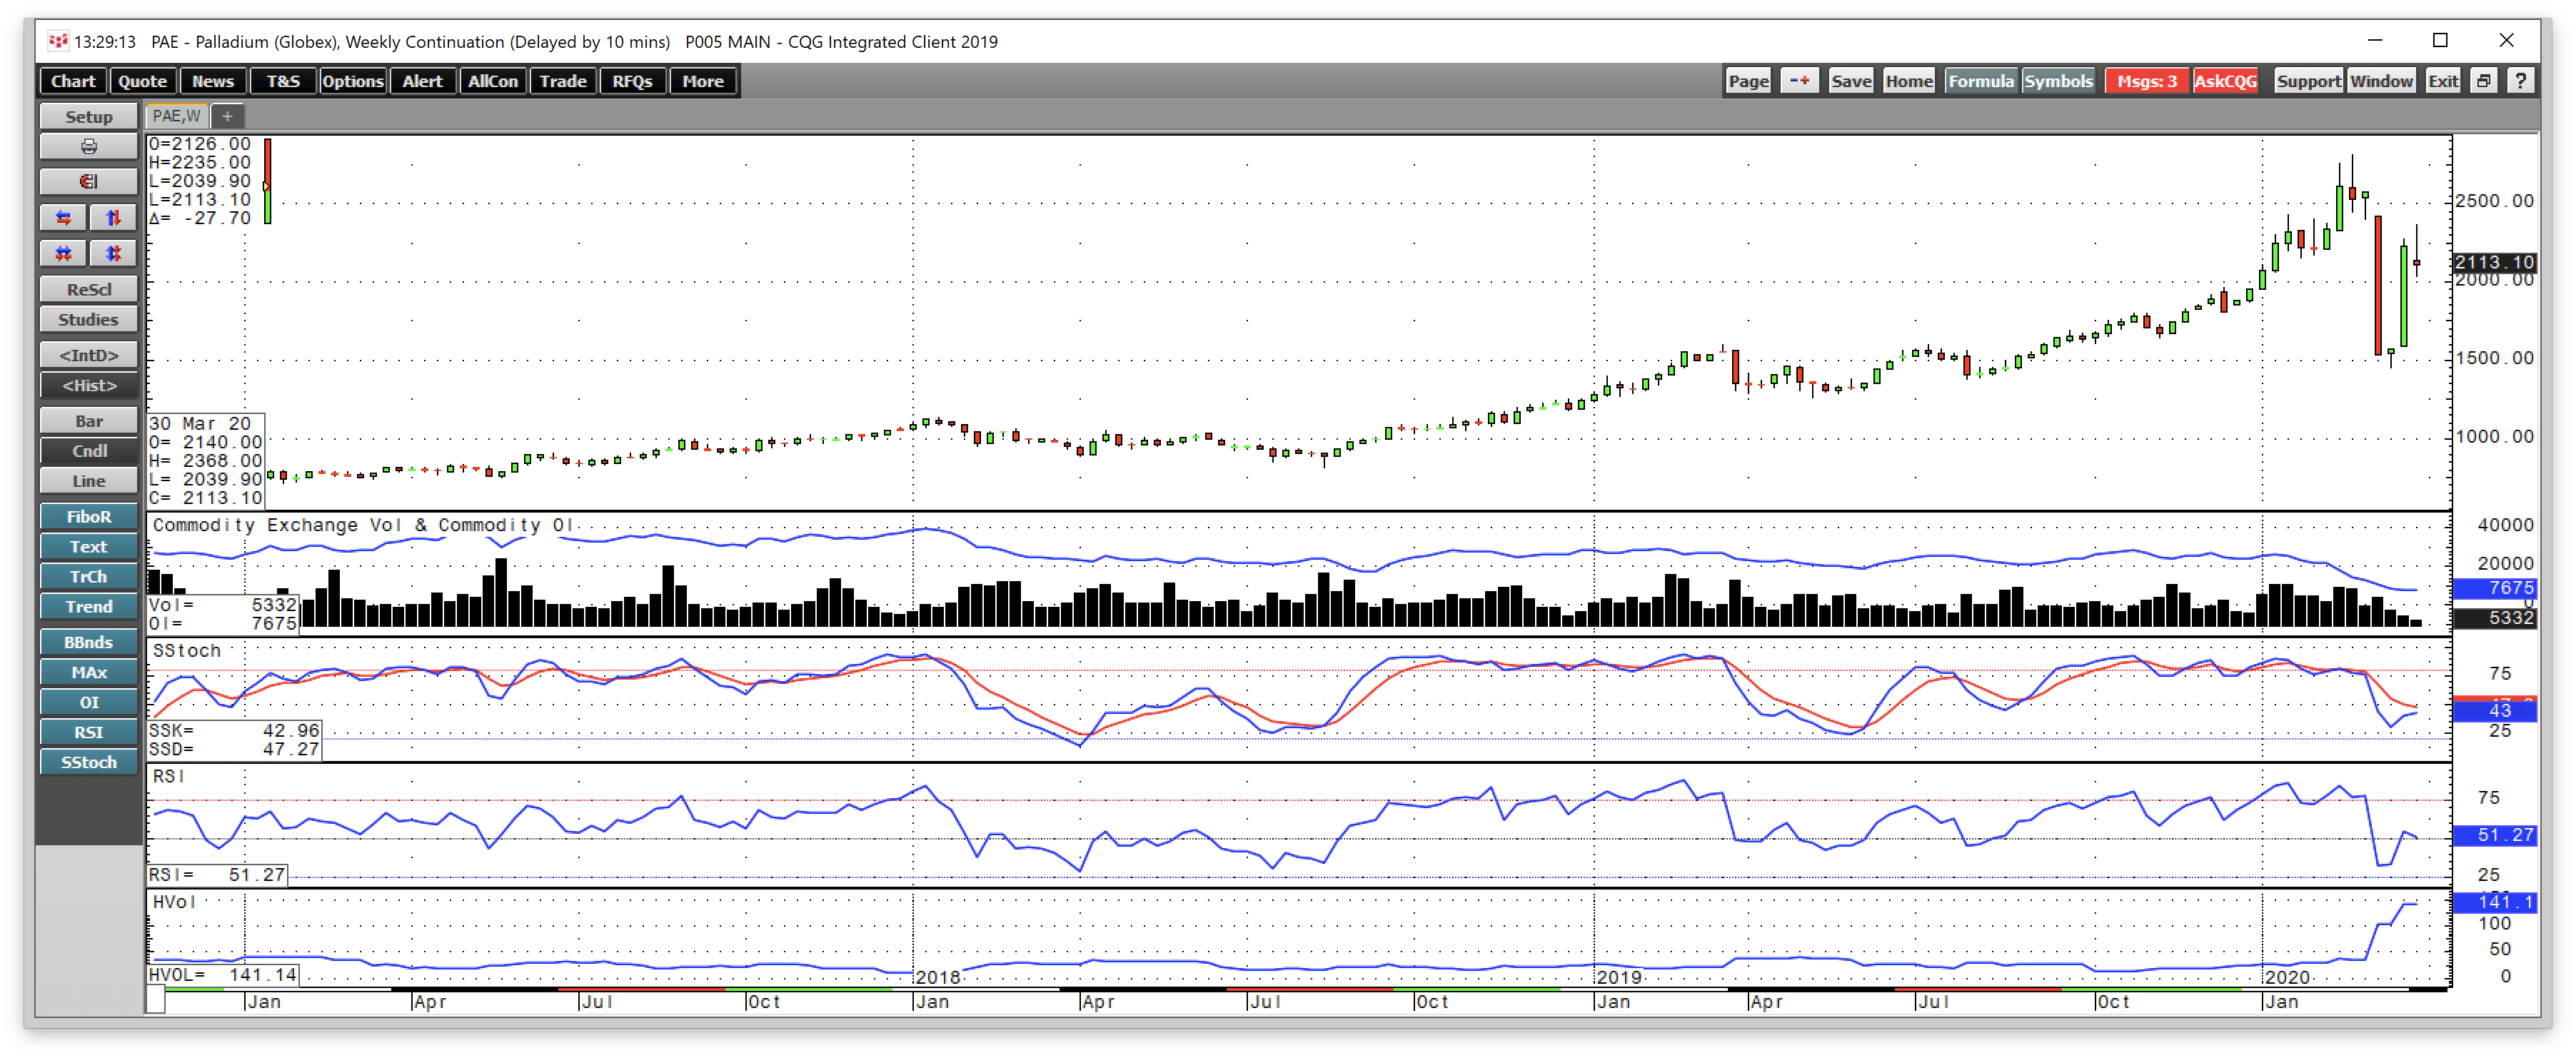
Source: CQG
Meanwhile, the weekly chart shows that standing in front of the bullish freight train in palladium since 2016 has been a tragic financial mistake. Risk-off conditions have caused volatility to explode in palladium.
The risk in the palladium market continues to increase with the price, and palladium has become a lot more volatile over the past months with the daily and weekly historical measures of price variance rising to well over 100%. Palladium was at $2304.80 per ounce on March 31. Betting against the rally in palladium has been a losing proposition since early 2016.
While palladium outperformed all precious metals in Q1, another precious metal that does not trade on the futures exchange has been even more explosive.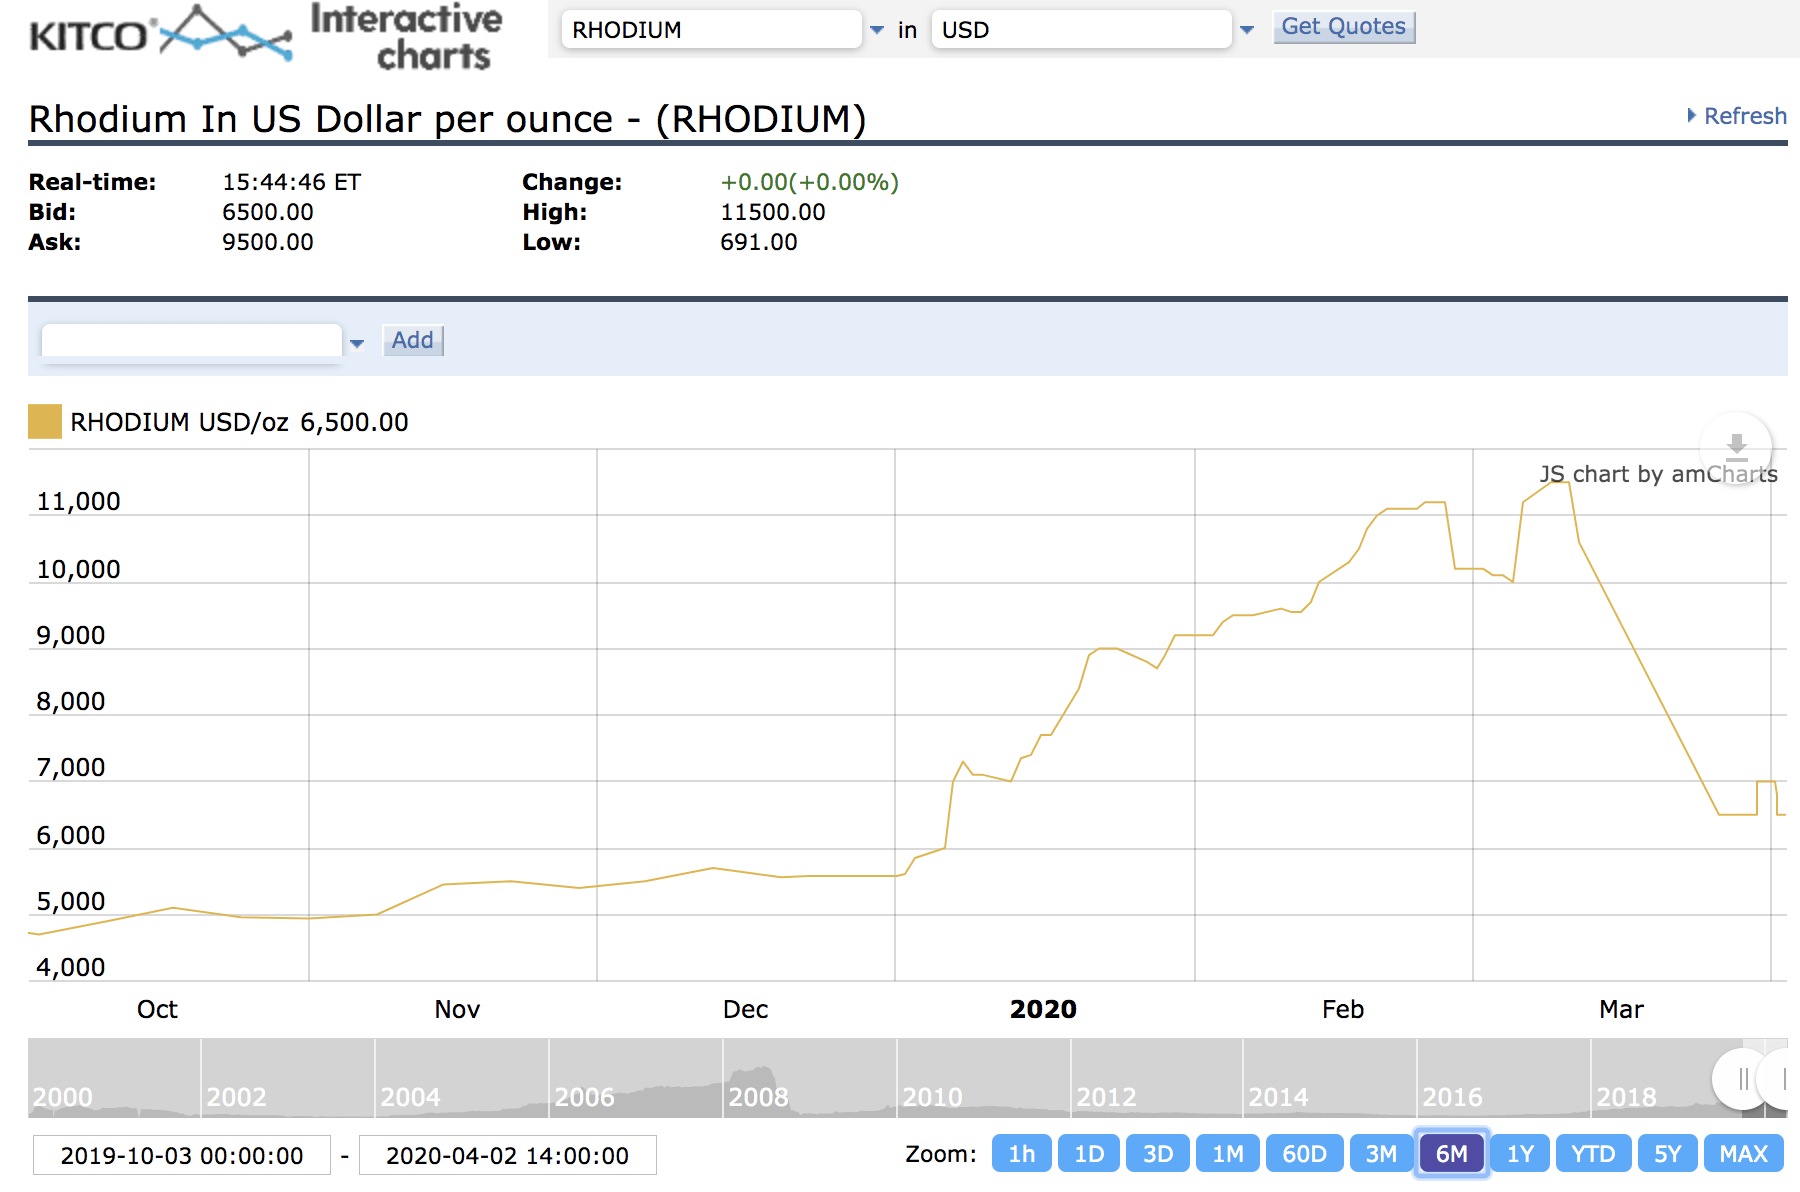
Source: Kitco
The price of rhodium, a byproduct of platinum output in South Africa, moved significantly higher in 2018 and the year at $2300 bid at $2450 offered. At the end of 2019, the price jumped to $5580 at $5980 per ounce, $3,280 higher last year. At the end of Q1 2020, rhodium was at the $7,000 level, $1,220 higher since the end of 2019.
The price strength in both the rhodium and the palladium markets could eventually impact the price of platinum, which has a higher resistance to heat, is denser, and is the only platinum group metal that has a history of significant investor demand. The price action in platinum did not reflect the gains in its sister metals as platinum lost over 25% of its value in Q1.
The critical takeaways for palladium and rhodium at the end of Q1 are that the risk of significant corrections rises with the prices of the metals. Both metals experienced severe downdrafts in March. At the current price levels, wide trading ranges are likely over the coming months.
Looking towards Q2 2020 in the precious metals and some thoughts on digital currencies
Gold and palladium prices moved higher in Q1, while platinum and silver posted over 20% losses over the three months. Silver tends to attract the most speculative demand, but it was a significant laggard in Q1. The prospects for Q2 and beyond are different for the various metals.
Palladium and rhodium are industrial metals. The decline in platinum output should continue to provide support for rhodium (a byproduct of platinum), but it is at a lofty level where price variance is likely to remain elevated.
When it comes to palladium, rising demand for catalytic converters across the globe is supportive of the price of rare metal. The global pandemic that is creating a halt to economic activity would weigh on the price of palladium and slow or stop the upward trajectory over the coming months.
Platinum and silver are precious metals with many industrial applications and investment angles. In platinum and silver, both metals have lots of catching up to do when it comes to their price levels compared to gold and the other platinum group metals. The global pandemic that triggered an economic meltdown could cause lots of volatility on all of the precious metals and could weigh especially on the prices of industrial metals during risk-off periods. Tight stops are a good idea when it comes to any new risk positions in platinum or silver.
When it comes to the gold market, interest rates, the dollar, and fear and uncertainty drove the price higher, and above the 2016 peak and level of critical technical resistance at $1377.50 per ounce in 2019. The break to the upside took on a life of its own as trend-following traders and speculators could continue to pile into the gold market. The bullish technical breakout in gold and a continuation of higher highs could eventually ignite both the silver and the platinum markets. The current target on gold is March high is at just above the $1700 level. I believe gold is heading for a new all-time peak over the coming months and years. The unprecedented flood of stimulus suggests that any price weakness in gold could be a buying opportunity over the coming months.
Meanwhile, lower interest rates and risk-off conditions provided mixed results for the digital currencies.
In Q1, Bitcoin fell 10.88%. Ethereum moved 2.48% higher in Q1. Litecoin's value moved 6.66% to the downside in Q1, while Ripple was 9.13% lower during the first quarter. Bitcoin Cash rose 6.72% in Q1, and Bitcoin Gold gained 34.39% in Q1 2020. The market cap of the entire digital currency market, which comprises 5,285 tokens, up 299 from the end of Q4 2019, decreased from $191.935 billion at the end of Q4 to $181.094 billion at the end of Q1 2020 or 5.65%. The market cap peaked at over $800 billion in December 2017.
The significant increase in new tokens diluted the asset class. An ETF product that trades on the stock exchange and solves the custody issues could turbocharge gains in the world of cryptocurrencies. However, governments continue to express concerns as they will not relinquish their control of the money supply to the new breed of currency instruments. China and Russia have currencies that are not fully convertible, so those governments are likely to crack down on digital currencies. The US remains concerned about the rise of the instruments. In Congressional hearings, members of Congress and the Senate were not supportive of Facebook's leadership in the Libra token, which would be run by a consortium of parties.
The price action in Q1 in digital currencies suggests that risk-off periods have yet to drive the prices higher. Many proponents of the cryptos believe that at times of fear and uncertainty they provide a safe harbor compared to other assets. That was not the case in Q1 as the pandemic did not provide significant support for Bitcoin and many of the others in the asset class. Moreover, the growing number of token and the declining market cap of the asset class is a sign of dilution and falling rather than rising interest.
I view the current tokens in the digital currency asset class as trading sardines that offer opportunities from a short-term perspective.
I will be watching the price action and the news cycle, which will give me clues about the path of least resistance for prices over the coming three months. Falling global interest rates are bullish for the prices of gold and silver. Each quarter is always a new adventure in markets. As we head into Q2 2020, gold could continue to offer the most attractive value proposition, given its long history as a safe haven for capital. When it comes to absolute value, while platinum has been a dog, every dog has its day, and the metal is long-overdue for a massive price recovery. I was bullish for precious metals prices as an asset class at the end of 2018 and 2019 and see no reason to alter that opinion as we head into Q2. Lower interest rates and a flood of liquidity are bullish fuel for this sector of the commodities market.
The GLTR is an ETF that represents a basket of the four precious metals that trade on the COMEX and NYMEX divisions of the CME for those who want exposure to the sector without trading the individual metals. GLTR is a liquid instrument with $575.64 million in net assets, and an average of 55,947 shares trading each day. Both the net assets and average daily volume increased from the end of Q4 2019. The top holdings of GLTR include: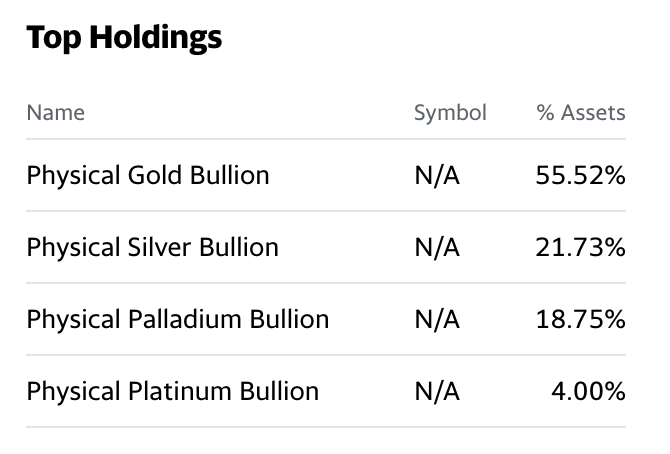
Source: Yahoo Finance
Precious metals may continue to be one of the most exciting sectors during the second quarter of 2020, given their long history as monetary instruments and stores of value. GLTR moved from $76.40 at the end of Q4 to $75.10 per share at the end of Q1 2020, a decrease of 1.70% for the quarter that ended on March 31. GLTR outperformed the composite given GLTR's holdings, which were 55.52% invested in gold and 18.75% in palladium. Gold and palladium were 3.96% and 20.71% higher for the quarter, respectively. The next leg of the bull market in gold that began in the early 2000s continued in 2019 and early 2020, and the prospects for Q2 continue to look golden. Expect lots of volatility in all members of the sector over the coming months.
Any investment involves substantial risks, including, but not limited to, pricing volatility, inadequate liquidity, and the potential complete loss of principal. This document does not in any way constitute an offer or solicitation of an offer to buy or sell any investment, security, or commodity discussed herein, or any security in any jurisdiction in which such an offer would be unlawful under the securities laws of such jurisdiction.
The Hecht Commodity Report is one of the most comprehensive commodities reports available today from the #2 ranked author in both commodities and precious metals. My weekly report covers the market movements of 20 different commodities and provides bullish, bearish and neutral calls; directional trading recommendations, and actionable ideas for traders. I just reworked the report to make it very actionable!