I recently re-watched a 2002 interview between Peter Lynch and Louis Rukeyser, where right after the 1:50 mark, the legendary former manager of the Fidelity Magellan Fund provided one of his "quotes of the obvious":
Some companies don't do well. Xerox [Holdings Corp (NASDAQ:XRX)] makes a lot less money than they did 30 years ago, [now, the stock price] it's a lot less.
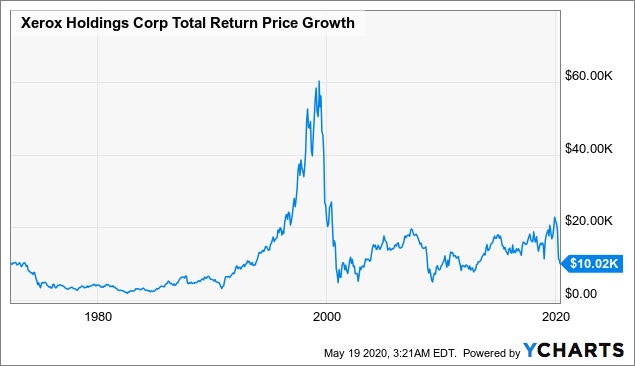
Partly inspired by this quote, I wanted to run a few long term fundamental charts of XRX, not just over the 30 years ending in 2002, but also over the 18 years since. The first chart was the one that surprised me the most: $10,000 invested in Xerox stock in mid-1972, even with all dividends re-invested gross of taxes and fees, would still be worth only around $10,000 48 years later in 2020. In this article, I wanted to take a look into some of the fundamental historic data of Xerox, and look for lessons on how to avoid owning one of today's blue chips that might underperform in coming decades.
 Data by YCharts
I personally do not remember the 1970s (I was born in the late 1970s), but the little I have read about Xerox's reputation in that decade is that it was one of the dominant blue chip tech companies of that era. It was lists of the "Nifty Fifty" stocks to buy and hold forever, largely because of their patent on photocopier (xerography) technology at the time. I heard stories of how expensive Xerox machines were at the time, and because these machines would often break down, companies often needed to have several of them in each office. There seem to have been several court cases over Xerox's monopoly in the 1970s, which this 1978 New York Times article outlines some of.
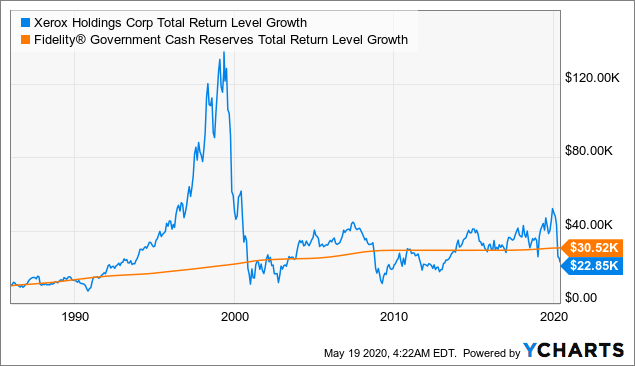
If we start the chart past the initial decline we see above in the 1972-1974 bear market, and instead start our total return chart in 1986, before the stock's "best decade" in the 1990s, and where many of our fundamental data series begin, we see that XRX has still underperformed a money market fund until now. Although some might say that either chart looks better than one where $10,000 declines in value to $1,000 or less, a long-term investor may say "it's not that much that much better".
 Data by YCharts
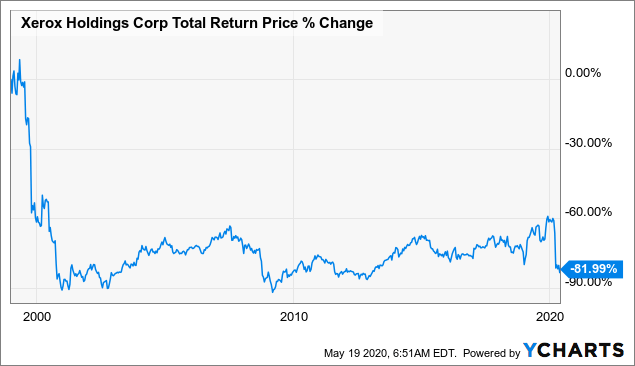
The third and final chart of total returns to investors in XRX shares is the one that highlights the importance of risk management, valuation, and timing. After a decade of steadily rising six-fold, XRX shares rapidly declined by 90% from their peak in early 1999, with most of this decline occurring in 1999 before the dot-com bubble burst in 2000. XRX has traded in a range over the 20 years since, but have never really recovered or provided investors with an attractive return since.
 Data by YCharts
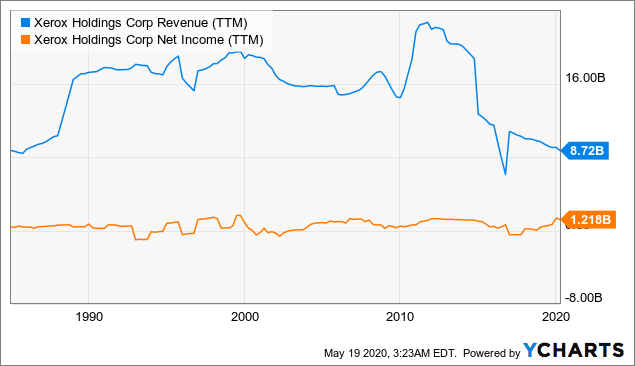
Back to Peter Lynch's point about the stock being worth less because the company made less money, we see the below chart of XRX's top line revenues and bottom line earnings from 1986 to 2020. Based on my own experience of seeing Xerox less and less around me, I'm not surprised that their 2020 revenues are still around 1986 levels, but I did not know this company's bottom line so often swung between profits and losses.
 Data by YCharts
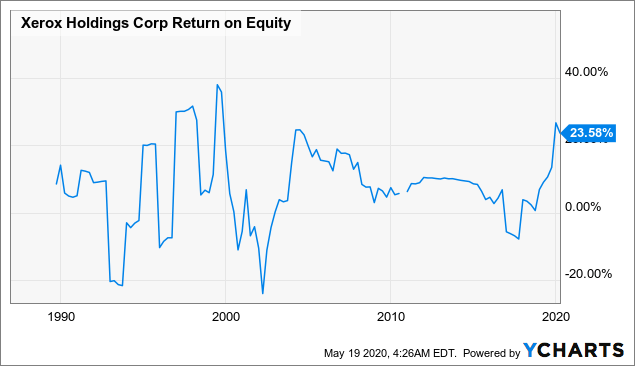
The volatile earnings history of XRX becomes clearer when we look at a rolling chart of its return on equity ratio (ROE, defined as earnings divided by book value of equity). We see Xerox's deepest reported loss around 2002 (the time of the Peter Lynch interview), but also two significant loss periods in the 1990s and one recently in the late 2010s. These two charts of revenue and earnings charts are no doubt much noisier due to numerous acquisitions and spin-offs, but still, even this brief visual look tells me this company does not seem to be one that produces steady, quality earnings.
 Data by YCharts
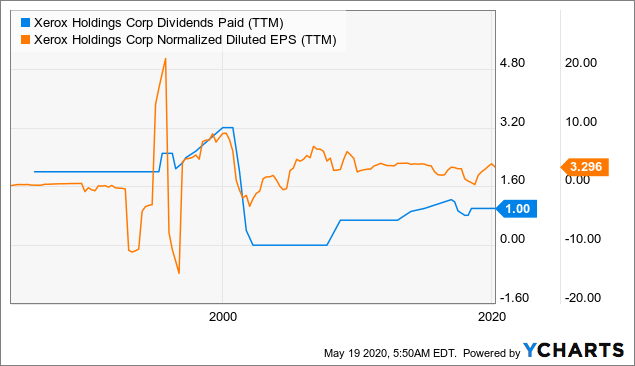
What I then wanted to try and understand was what could have then driven XRX's impressive total return over the 10 years ending in January 1999, and such poor investor returns since then. The following chart shows that XRX shares paid a steady dividend in the late 1980s and early 1990s, and then started raising its dividend in the later part of the 1990s. While a steadily rising dividend is a sign of a quality company I often look for, that dividend needs to be covered by a comparably steady rise in cash earnings, which does not seem to have been the case for XRX in the 1990s. The lesson here is that it was probably a good idea to avoid the stock, even on the way up, on seeing how much more volatile Xerox's long-term earnings were compared with its dividend. Surely enough, the big loss in 2002 eventually pushed XRX to cut its dividend for most of the 2000s, and in some ways, the dividend/earnings chart looks less "scary" over the past decade than it did over the 1990s.
 Data by YCharts
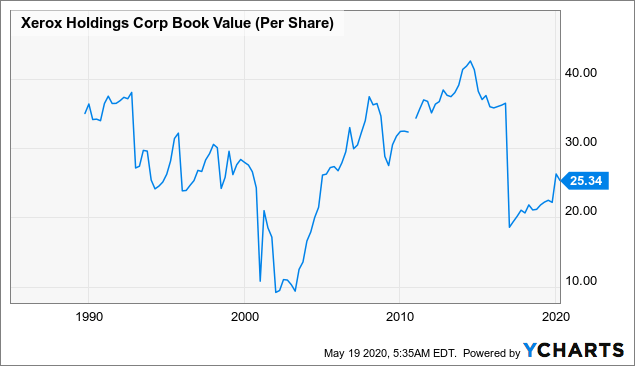
Earlier, I charted the XRX's ROE to show the volatility of XRX's earnings, but before moving on to valuation, feel it would also be important to run one chart on the denominator of the ROE: XRX's book value. Many may say that book value is an outdated metric, but I still find it quite useful to look at long-term trends in book value and some of the pieces that go into it (accumulated retained earnings, for example). A company's ROE (positive or negative) would by definition double if the book value gets cut in half, which could happen due to write-offs, M&A, or other reasons that may be good or bad, but worth understanding. When we chart XRX's book value per share, we don't see a nice, steady growth pattern like we might hope, but rather a far more volatile accounting history.
 Data by YCharts
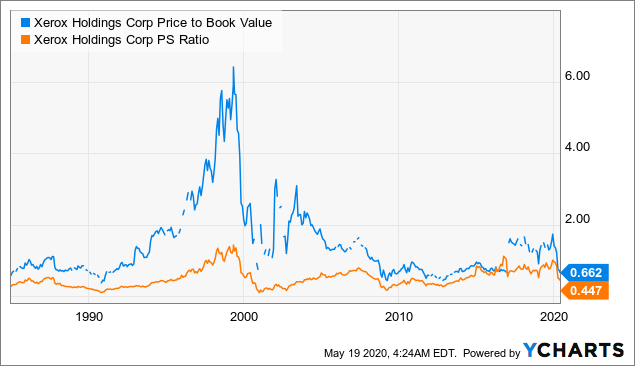
The other reason it was important to plot XRX's historic book value per share was that the two most meaningful charts of historic valuation ratios of XRX are its historic Price/Book and Price/Sales ratios. Price/Earnings is less meaningful because of the periods when earnings were zero or negative, and the same would be true of Price/Cash Flow metrics for this stock. Even though I believe the earlier charts provided enough clues on why it may have been better to avoid this stock, the following chart hints at avoiding the biggest loss periods by not buying at the highest multiples. Since we noticed earlier that Xerox had not reported significant sales growth or book value growth in the 1990s, the six-fold rise in its stock over that decade seems to have been purely a result of multiple expansion. While investors might have significantly raised their expectations for future growth of these types of companies in the decade the internet started taking off (for example, IBM and several other companies saw similar multiple expansion that decade), it was clearly riskier to buy XRX at >4x book value than at 40% below book value.
 Data by YCharts
Conclusion
This article looked entirely at the past, but there seemed to be at least a few patterns we can probably point to, with the benefit of hindsight, as possible warning signs for avoiding another stock that returns 0% over 48 years:
- The lack of revenue growth, even during a decade which should have been an excellent revenue growth opportunity for this kind of company, and
- The lack of steady earnings, though we might need to adjust for how much of those losing periods could have been due to M&A or spin-offs, and
- The rise of the dividend in the late 1990s even after two periods of deep losses (though again, it would help to know more about what the dividend board was thinking at the time), and
- A very volatile book value of equity, which managed to decline over the decade of the 1990s and the most recent decade of the 2010s, and perhaps most importantly
- Periods of multiple expansion unrelated to growth in cash earnings
It could be left as a homework exercise to debate which, if any, of the top 50 blue chip stocks of 2020 might look like "the next Xerox" over the next 20-50 years, but to conclude here, I think it might be fair to at least extend some of these "lessons" to a view on XRX today:
- XRX's ROE seems to be near multi-year highs, but that seems to be based on a recently high TTM earnings per share, divided by a book value significantly below where it was 5 years ago.
- The $1/year dividend seems to be much better covered by XRX's recent annual earnings per share numbers in the $1.50-3.50 range, but it might be hard to argue a dividend raise is as likely as a dividend cut next year.
- The multiples of 0.66x book and 0.45x sales look historically cheap, as does the nearly 6% dividend yield, so now is not the worst time to buy if you're optimistic about the company's future earnings.
Overall though, I'm glad that this is a stock I have never bought so far, and hopefully some of these examples can remain useful memories of how to avoid similar underperformers in the future.
Neither standard nor poor, I focus on quality investments positioned to significantly increase your investment income over the next 20+ years. Get inspired with your free trial to Long Run Income.