
Here are last week's ETF fund flows from ETF.com:
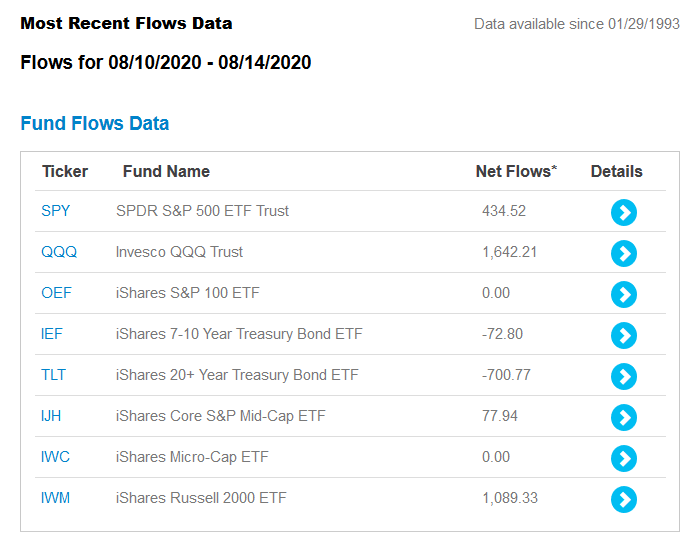
QQQ had the largest inflow, raking in $1.6 billion. But notice that small caps received the second-largest inflow, taking in a bit more than $1 billion. The long-end of the treasury market lost $700 million. This is something we've been hoping for as the treasury market sells off. As I noted on Friday, small-caps have moved through resistance and recently formed a pennant pattern. This is why the iShares Russell 2000 ETF (IWM) and the iShares Micro-Cap ETF (IWC) are on my buy list.
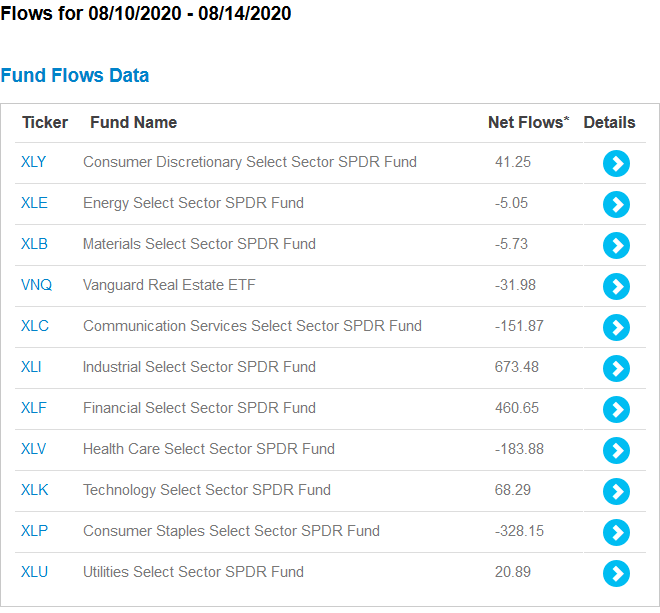
Industrials and financials were the big gainers, with the former seeing $673 million in new money, while the latter had a $460 million inflow. Two sectors lost cash: communication services (-$151 million) and consumer staples (-$328 million). The consumer staples sector is currently on my buy list.
Oil prices have stabilized:
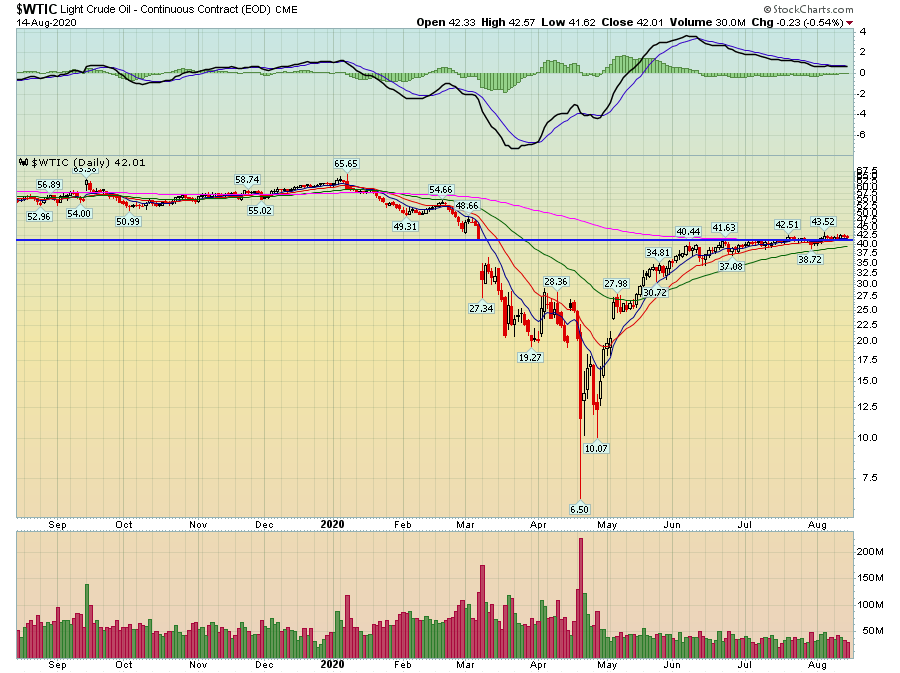
Oil prices fell in the Spring as traders correctly bet that lockdowns would dent demand. Then, there was the negative price scare in April when oil storage was near its peak. This temporarily sent oil prices into negative territory. OPEC sharply cut production, and as a result, prices have rebounded and stabilized in the lower $40s - right around the 200-day EMA.
What's driving the treasury market sell-off? From MarketWatch (emphasis added):
- The bond market showed signs of stabilizing on Friday after a weeklong selloff sparked by a round of larger debt auctions, increased by the Treasury Department last week.
Last week's debt auction had a lower-than-desired bit-to-cover ratio, which concerned the market. However, it's doubtful that this is a long-term problem. Treasuries are the bedrock bond investment for mutual funds, pensions, and insurance companies.
- Another round of stronger-than-expected economic numbers added to the signs that the U.S. recovery continued to make steady progress, as data