Greenlight Capital's Q2 letter to investors, prompted me to take a look at Brighthouse Financial (NASDAQ:BHF). A key trigger for me in the letter was the statement that the company earned $47 per share in Q1, more than the share price of the company. An equally intriguing part was that Greenlight bought at a valuation of $6bn, the company generated $6bn in retained earnings since, and the market cap sank to $2.5bn.
If the smart investors at Greenlight think that a company is undervalued at $6bn, it then does very well fundamentally, and also loses half of its value without paying dividends, then that is something to pay attention to.
Unfortunately, the story is not as simple as it appears above. The company is quite complex, and GAAP does not capture its liabilities or underlying profitability well.
Let us start by understanding the business model of BHF with a particular focus on its variable annuities.
VA business model
The insurance company sells multiple products. Its main activities are selling annuities and life insurance. An important activity is selling variable annuities or VAs, where the customers have their own account balance that fluctuates with the assets in the account. They are mostly included in 'Separate account assets' on the balance sheet below.
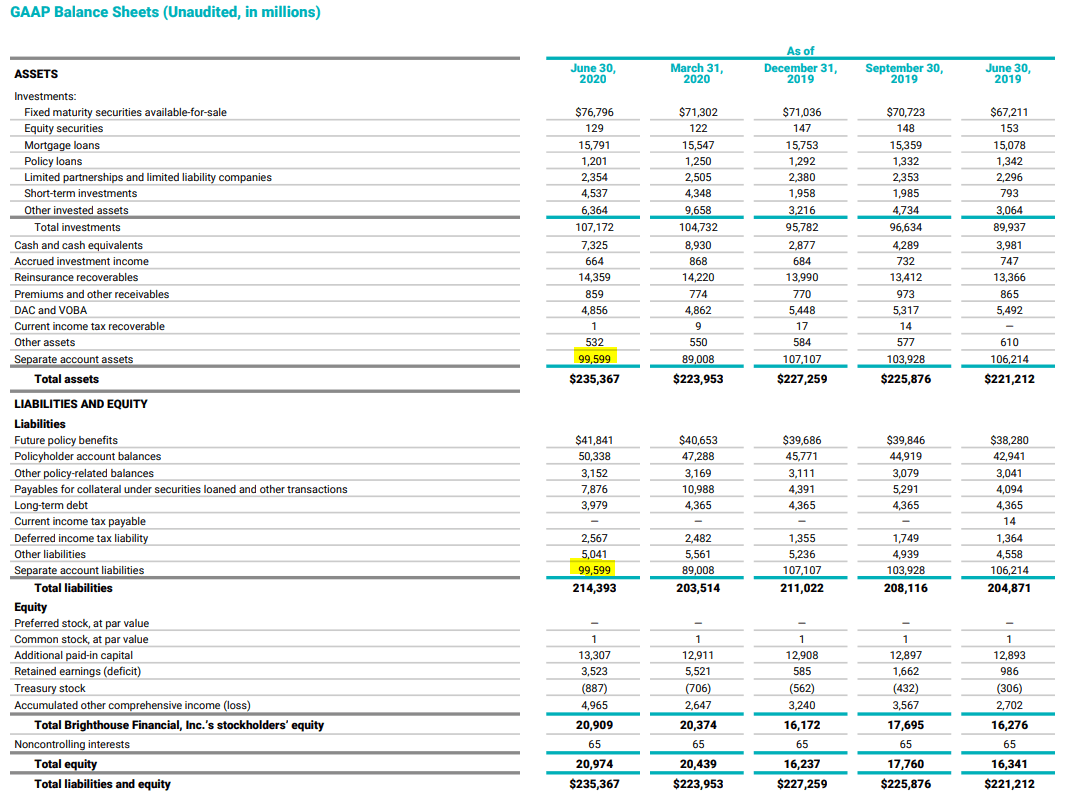
Source: Q2 2020 BHF Financial Supplement. Emphasis added by author.
The reason that these products have sold well in the past is that BHF also sold along a guarantee, or a minimum account benefit if you will. It is also custom for guarantees to increase annually by a set percentage (the rollup rate).
The benefits differ by policy and can take the shape of an income stream, a benefit upon death, annual withdrawals, or just an account balance after a specified accumulation period. So, it is clear that BHF wants the assets of clients to do well. The table below shows the asset allocation of the separate VA accounts. A lot is allocated to equity funds, especially when compared to bond funds. The exact composition of balanced funds is unknown to me, but I also expect a big equity exposure there.
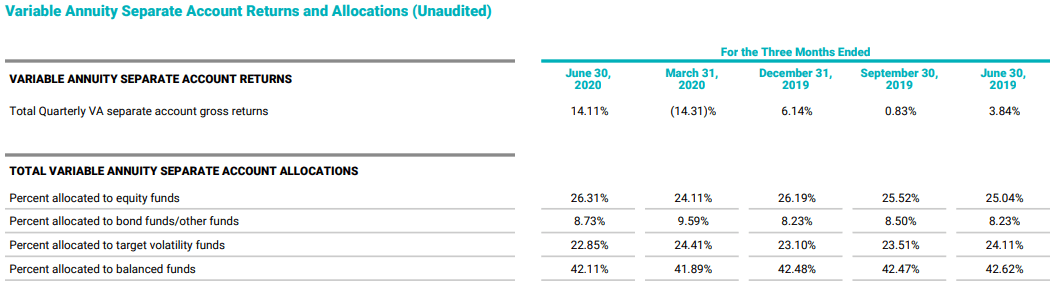
Source: Q2 2020 BHF Financial Supplement.
The short to medium-term risk of equity markets declines is significant and the company is reimbursed for this risk through fees paid by clients. In 2019, for example, the company earned $1.11bn in these fees for guaranteeing benefits, down from $1.14bn in 2018.
The risk of account values dipping below their guarantee (or benefit base) is quite real. The company calculates the amounts it would pay if the minimum benefits had to be paid on the balance sheet date and calls this Net Amount at Risk or NAR. The table below shows the NAR for various benefit types. 2019 was a good year for equity and this was reflected by an increased account value as well as a lower NAR of $11.96bn versus $15.82bn in the prior year.
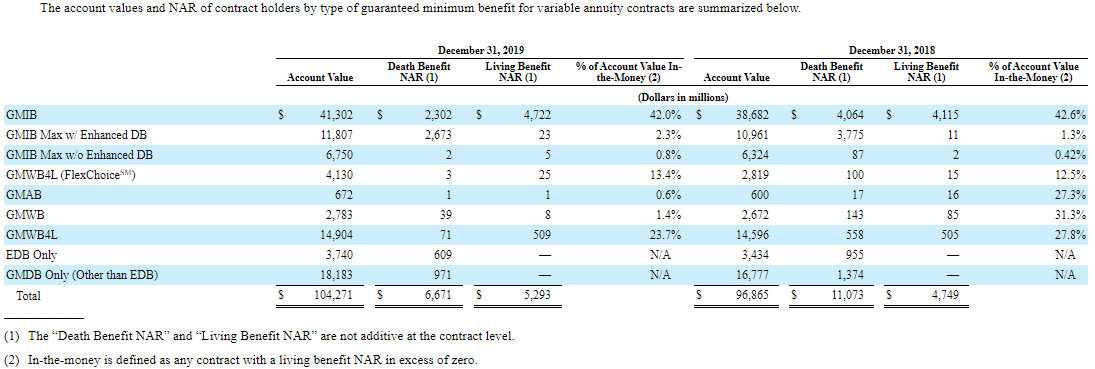
Source: BHF 2019 10-K.
An interesting item in the table above is that living benefit of GMIBs, or guaranteed minimum income benefits, increased in 2019. This is not because the company sold a lot of these policies, as new sales are discontinued for this product, but it is due to the fact that GMIB policies need to purchase a lifetime income stream based on current annuity rates. Lower interest rates are obviously detrimental to this goal. This is why so many of the GMIB accounts were 'in-the-money' from the perspective of the policyholder.
An important detail is that new deposits for variable annuities, including the company's shield product, do not compensate their outflow. So, when looking at this business segment, we best judge it 'as is' without assuming future growth.
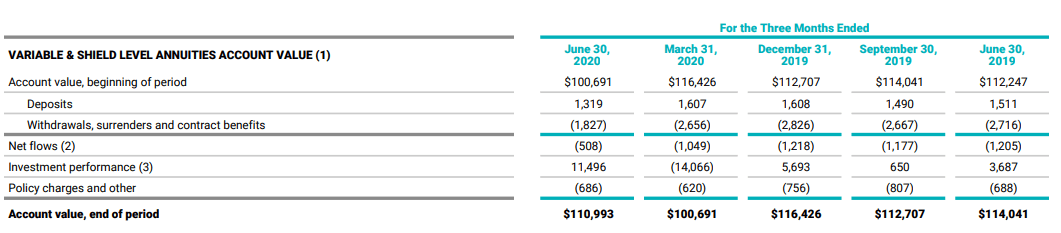
Source: Q2 2020 BHF Financial Supplement.
Reserve talk
It is important to know that the aforementioned net amounts at risk do not flow through the income statement like the profits and losses on the hedges do and that the guarantees are primarily captured by insurance liabilities on the balance sheet. Specifically, guarantees that are conditional on a certain event (e.g. death) are accounted for as an insurance liability and these use company assumptions about long-term interest rates and equity returns. These insurance liabilities are far lower than NAR, and that is where the confusion of many starts around the GAAP equity position of the company.
We must bear in mind that the VA liability on the balance sheet is not meant to reflect prudent reserves from an insurance perspective, but that it should reflect the best estimate of the liability using certain return assumptions that could well prove to be too optimistic. The following excerpt is from the 10-Q that tells essentially the same.
Under GAAP, certain of our variable annuity guarantee features are accounted for as insurance liabilities and reported on the consolidated balance sheets in future policy benefits with changes reported in policyholder benefits and claims. These liabilities are accounted for using long-term assumptions of equity and bond market returns and the level of interest rates. Therefore, these liabilities, valued at $5.3 billion at June 30, 2020, are less sensitive than derivative instruments to periodic changes to equity and fixed income market returns and the level of interest rates. Guarantees accounted for in this manner include GMDBs, as well as the life contingent portion of GMIBs and certain GMWBs. All other variable annuity guarantee features are accounted for as embedded derivatives and reported on the consolidated balance sheets in [policyholder account balances] with changes reported in net derivative gains (losses). These liabilities, valued at $3.8 billion at June 30, 2020, are accounted for at estimated fair value. Guarantees accounted for in this manner include GMABs, GMWBs and the non-life contingent portions of GMIBs."
We will get back to the 'at estimated fair value' part later on, but let us first compare the reserves to NAR and the statutory variable annuity reserves that the company needs to hold for its regulator.
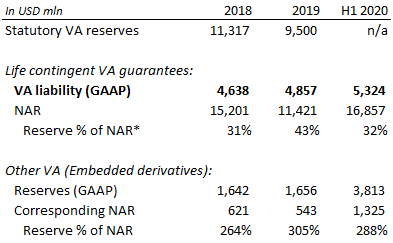
Source: company reports, BLIC 2019 annual statement, author's own calculations. *Reserve percentage of NAR means to illustrate the relative liability on the balance sheet in relation to the net assets at risk.
Equity and credit markets performed well in 2019, increasing account values much more than benefit bases on average, which reduced NAR as can be seen in the table above. In this environment, it would make sense for the liabilities to decrease and statutory VA reserves did. The main balance sheet liability, however, increased. The problem with the liability on the balance sheet is that it uses quite optimistic assumption, and as future years to let those projections come true run out, so does the theoretic ability of client balances to grow their way out of their respective holes. Bear in mind that a lot of the liabilities are driven by interest rate assumptions.
As of January 2022 (or 2023), a new accounting standard update is expected to kick-in for BHF. The company will be required to measure guarantees that qualify as market risk benefits at fair value. I think that this will materially increase the liabilities on the balance sheet. The following is what the company has to say about the impact on financial statements in its Q1 2020 10-Q:
The Company is in the early stages of evaluating the new guidance and therefore is unable to estimate the impact to its financial statements. The most significant impact is expected to be the measurement of liabilities for variable annuity guarantees."
My best guess is that this change will affect the equity position of the company negatively as the liabilities at fair value will probably be higher than they are now on the balance sheet. It is not fully clear how the company values its liabilities right now, but I have found out that in the general account, it assumed a 10-year treasury rate of 3.75%. This seems quite aggressive.
Hedges
To hedge the company's exposure to these guarantees, it holds a portfolio of hedging instruments. These hedges are a noticeable focus point when people discuss BHF.
Because the risk to BHF is one-sided while the benefit is a fixed fee, options are the most logical tool to hedge away this risk. That is exactly what the company has done in the past, but for its equity exposure, it has been turning away from index options towards total return swaps.
"[W]e revised our hedging strategy to reduce the use of options and move to more swap-based instruments. […] We expect to have significantly lower time decay expense as a result of this revised strategy. However, we also expect to incur larger hedge mark-to-market losses in rising equity markets as compared to our previous strategy."
The shift is visible in the table below as the notional amount of equity index options has declined while the position in equity swaps has expanded.
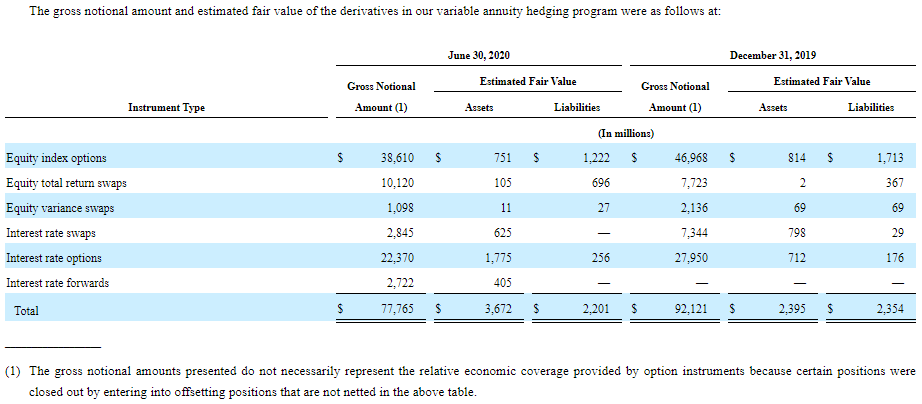
Source: BHF Q2 2020 10-Q.
Note that the overview above only includes hedges for the VA book. The company also owns a bunch of (mostly) interest rate derivatives for its life insurance and fixed annuity business.
We cannot see the details of the equity swaps, but it is safe to assume that BHF wants to receive payments when the equity markets go down and will make payments when the market goes up. The benefit is that BHF does not pay big option premiums (i.e. time decay mentioned earlier on). In addition, it enables the company to put the hedge closer to where its guarantees are, reducing the first loss from $2bn to $500m. The eventual effects on distributable earnings are shown by the company in an illustrative calculation below.
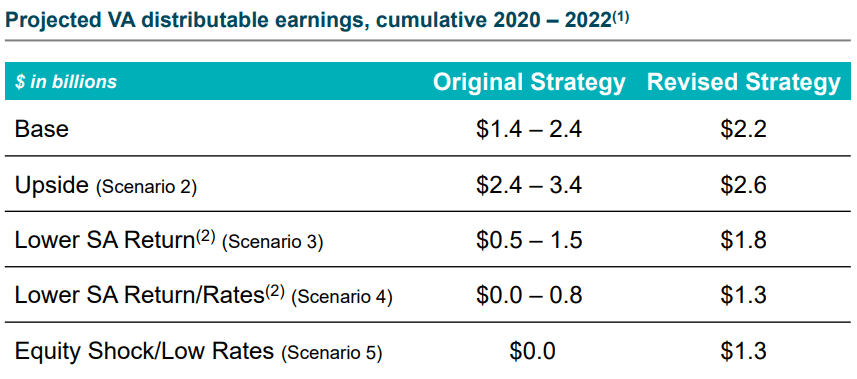
Source: BHF March investor presentation.
Note that the scenarios by the company are not necessarily reasonable predictions of the future as they are based on long-run averages. For example, as detailed in the 10-K of 2018, the base scenario assumed a mean reversion of 10-Year UST to 4.25% over 10 years at the time. The most extreme scenario expected a 25% shock to equities, followed by 6.5% annual separate account returns and UST rates of 1.5%. In 2019, the company reduced its UST rate assumption to 3.75%. Currently, 10-year US Treasuries yield closer to 0.7%. Apart from low rates being a problem for variable annuities, it also kills the market for new sales of guaranteed products and life insurance.
The downside from the hedging strategy shift is that there is actual downside to BHF if the equity market goes up. The company conveniently leaves out more upside scenarios, but it does show that the upside in the original strategy was higher. Increasing equity markets are now a tail risk that the company exposed itself to and it probably should hedge by buying call options. Instead, the company argues that rising equity markets are good for the company because it increases the fees it receives on client balances.
Investors must understand that BHF is double exposed to asset prices and that increasing client account values have a dual advantage. The first is obvious, a lower NAR. The second one is that hedging costs decrease market runs further away from the guaranteed value. To give an illustrative example: at market close on August 24th, the cost of a January 2021 put option on BHF with a strike of $30.00 was $4.20, while the same option with a strike of $25.00 cost $2.05. Given that you just pay option premiums and that the proceeds of the options go to someone else, you would rather be compelled to buy the $2.05 option than the $4.20 one.
There should be no doubt that it is almost always preferable to lose a lot of money on the hedges, which produces GAAP losses because that means that the NAR goes down. Quarterly gains and losses on these hedges are shown below. By themselves, these numbers are meaningless.
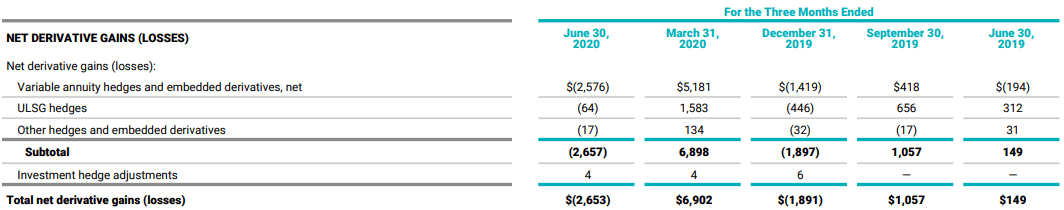
Source: Q2 2020 BHF Financial Supplement.
So, how effective is the hedging activity really? In the Q1 call, management disclosed that the added CTE98 (average asset requirement in 2% of the worst outcomes) asset requirement for variable annuities was $8.1bn while variable annuity assets increased by $8.3bn. But this is only one way to look at it.
You may recall that the NAR at the end of last year was $12bn. At the end of Q1, this had increased to $25.9bn, so this was an added $13.9bn liability. At the end of Q2, the NAR has fallen back to $18.2bn for a total increase of $6.2bn in the first half of 2020. At the same time, the company made $4.2bn on its derivatives portfolio, which doesn't really cover the shortfall.
The above still ignores fixed annuities and life insurance, so I would like to review regulatory capital called TAC (Total Adjusted Capital), which is the nominator for the RBC (Risk-Based Capital) ratio. TAC at the main subsidiary BLIC (Brighthouse Life Insurance Company) declined by $1.2bn, excluding $800m in dividends to BHF. A primary reason mentioned in the Q1 earnings call was an increase in the VA reserves as a result of declining interest rates and equity markets that was only partially offset by the benefit from hedge gains. Separately, management commented that interest rates had an adverse effect on life and fixed annuity liabilities.
The most threatening risk for BHF is not in the much-discussed equity exposure but in interest rates. The life book of BHF, as well as its VA guarantees, is exposed to interest rate risk. Interested readers can have a look at Ian Bezek's work on BHF as he did a nice job of focusing on rates and providing more background about BHF.
Capital return story
The insurance liability assumptions and corresponding hedges are hard to fully comprehend, and given the lack of more detailed disclosure, also virtually impossible to fully oversee. It is practical to just focus on capital generation and capital distribution to shareholders in particular. I believe that this is exactly what the market does. Last weekend, BHF announced that it would resume its buyback program under which $231m was still available. In response, the stock shot up by 9% on Monday, adding $239m to its market cap. To be fair, it was a good day for traded life insurance companies, but this market response is still extreme.
Capital return is fully driven by the TAC and RBC ratio. At the end of each year, the RBC ratio is calculated as well as the remaining dividend capacity, which is based on excess capital above a prudent RBC level that appeared to be 430% for last year. It is important that the company keeps generating this type of distributable (statutory) capital.
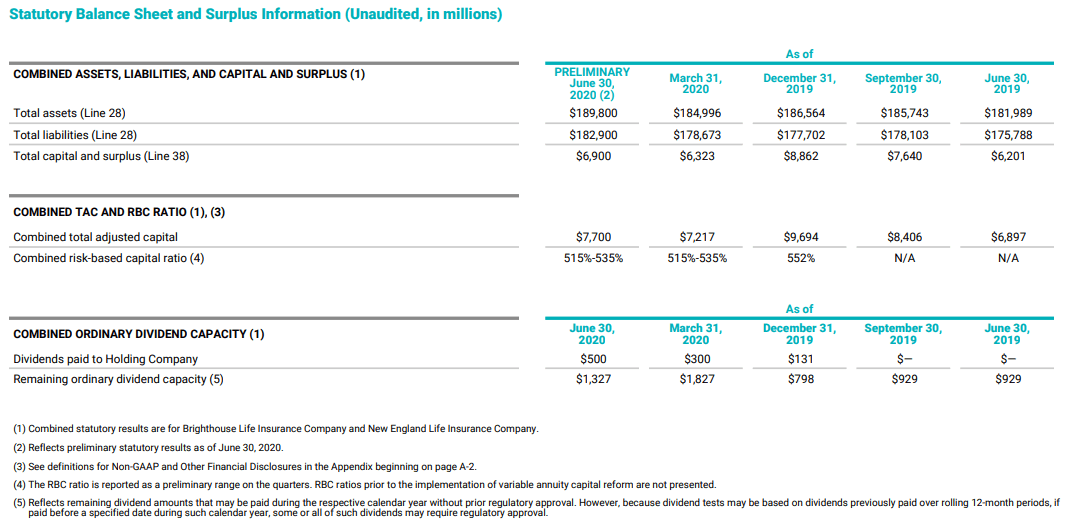
Source: Q2 financial supplement.
Brighthouse attempts to capture capital build by reporting normalized statutory earnings. The table below shows a $0.2bn loss for the first 6 months of this year. This is radically different from the $3bn GAAP profit, but more consistent with lower interest rates and sub-par equity markets.

Source: Q2 financial supplement.
The company's normalized statutory income was $1.9bn in 2019 when GAAP net loss was $0.7bn. Given the NAR development, I think that a net income of $1.9bn makes more sense than a loss of $700m. 2019 was a good year for BHF, despite the fact that interest rates moved down. In 2018, normalized statutory income was $0.3bn when GAAP net income was $0.9bn.
The figure below by the company gives a good sense of earnings power from VA activities under various scenarios. At this moment, I think that the two right-hand scenarios are most likely and that shareholders should not count on more than $1.3bn in distributable earnings up to 2024.
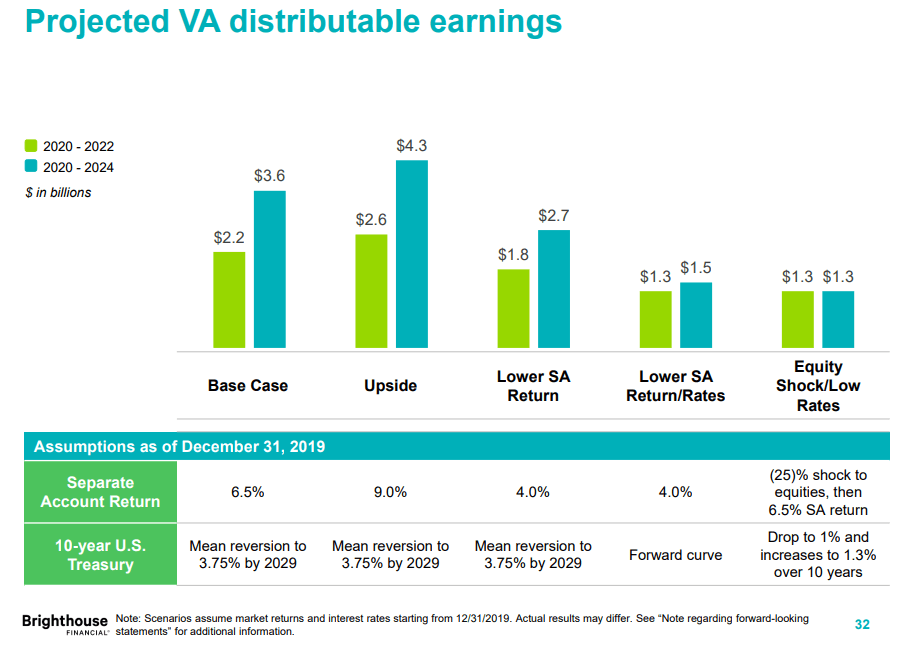
Source: March 2020 investor presentation.
The chart above only shows the VA product while there is also a run-off portfolio and life insurance book. These should account for half of distributable earnings over the next 10 years in the scenario of low separate account returns and low rates. This is illustrated by the figure below.
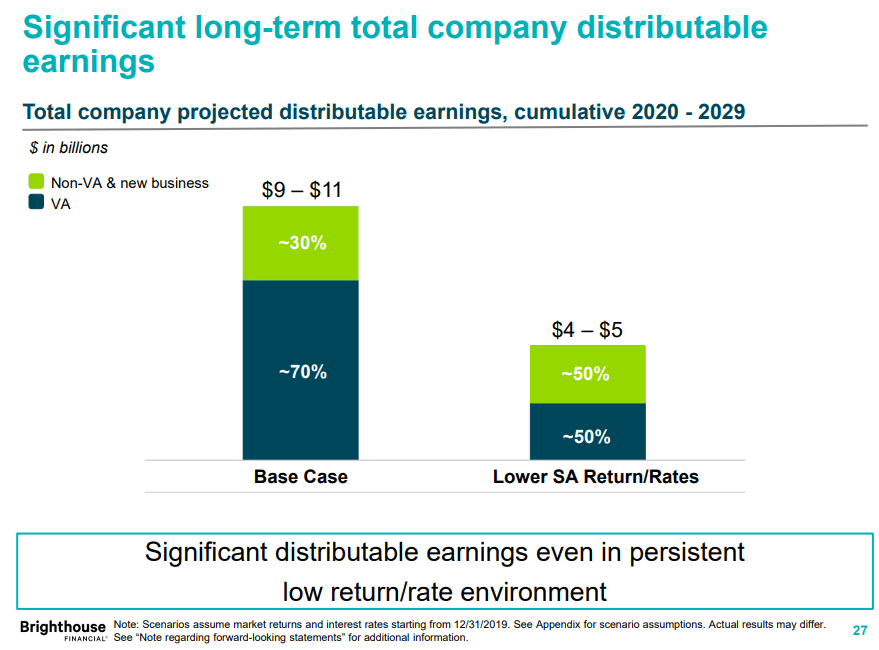
Source: March 2020 investor presentation.
At first sight, distributable earnings of ~4.5bn over a 10-year timespan looks quite good. Given the market cap of almost $3bn, that comes down to a potential annual capital return of 15%.
Valuation
Valuing an insurance company like BHF that has many unobservable inputs and liabilities that cannot be judged reliably from the outside, is hard. In any case, GAAP equity is certainly far off while we are waiting for the FASB update that tells companies to measure insurance liabilities at fair value.
Another thing to consider is that a bet on BHF is a bet on strong equity markets and higher rates.
One source of a safety margin for investors is the market cap of $2.9bn. The company has an RBC ratio of about 525% and could lower this to 425% by returning cash to shareholders. That would mean a payout of $1.8bn. In addition, the BHF parent company holds more than $1.2bn in cash. On the other hand, the holding company also had debts of $4.8bn as of the end of last year which excludes preferred shares that have a nominal value of $425m. This leaves an estimated net financial asset position in the holding company of around $4bn.
This is where it gets tough because how much of the $4bn in cumulative distributable earnings will end up in the pockets of shareholders over the next 10 years? BHF is a shrinking business and it seems logical to reduce holding debt over time to adjust to its decreased business activity.
BHF is undeniably cheap, but the holding debt and future earnings make it tough to value. I have rarely studied a stock for almost two weeks without having a clue about its fair value, but this is one of those cases. Maybe the company is a steal at $3bn. Maybe it is a value trap amid these low rates.
Conclusion
I don't think that BHF is for everyone. It takes some research to understand that GAAP earnings of $47 in Q1 are meaningless and that Q1 was not a good quarter at all. Perhaps BHF is only for knowledgeable value investors, such as David Einhorn, who are prepared to spend significant time on fundamental analysis of one company.
An important takeaway is that focusing on actual distributions through buybacks, as the market does, is surprisingly sensible in absence of deep knowledge about the liabilities of the company. But above all, investors must understand that BHF is a bet on strong equity markets and higher interest rates.