This research report was produced by The REIT Forum with assistance from Big Dog Investments.
This article is designed to help investors who are learning about mortgage REITs. Today, we are going to walk investors through a few metrics. The metrics we want to focus on are:
- Yield on assets
- Interest income and premium amortization
- Cost of funds
- Net interest spread
- Leverage
Before we get into the definitions, we want to highlight that it's easily possible for investors to be misled by focusing too much on these metrics. We recently wrote an article to help investors better understand how income is connected to book value. The five metrics we will be going over should help investors to better understand book value. We will be using slides from Annaly Capital Management’s (NYSE:NLY) investor presentation throughout the article.
Yield on assets
The yield on assets is the interest income divided by the amount of interest-earning assets the REITs own. The reason we are specifying “interest earning” is because other assets will be excluded from the calculation. Those other assets usually are a tiny portion of total assets. Let’s use a quick example. If a mortgage REIT had $100 billion in interest-earning assets and had annual gross interest income of $3 billion, the yield on assets would be 3%.
Interest income and premium amortization
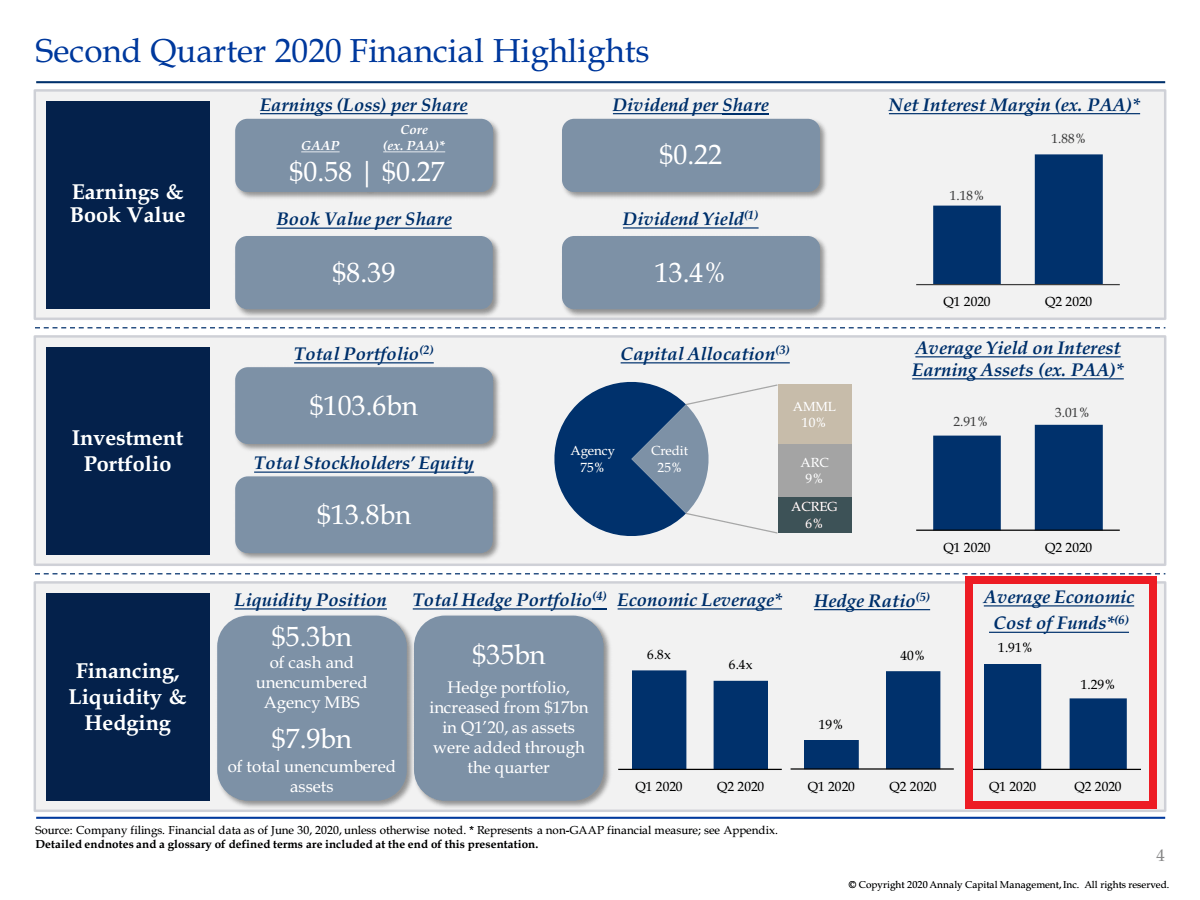
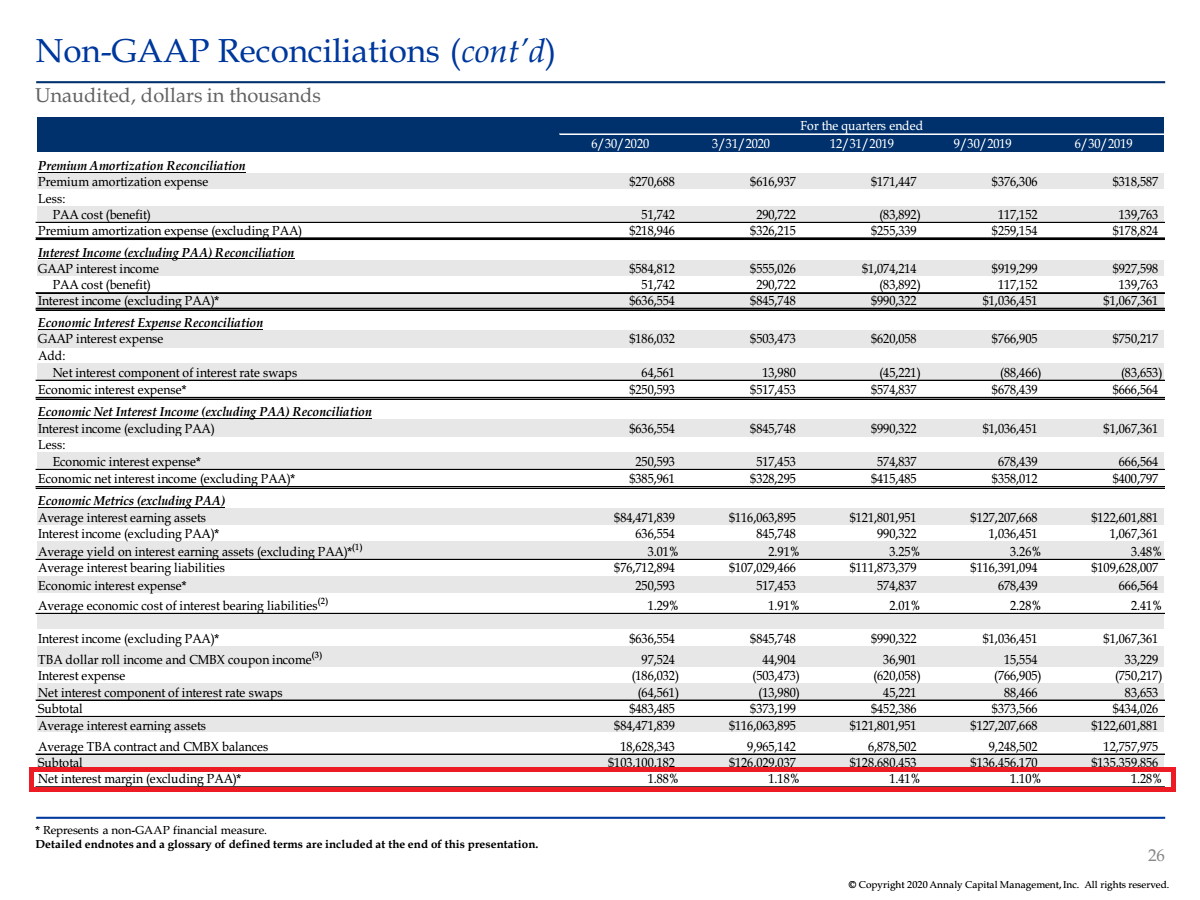
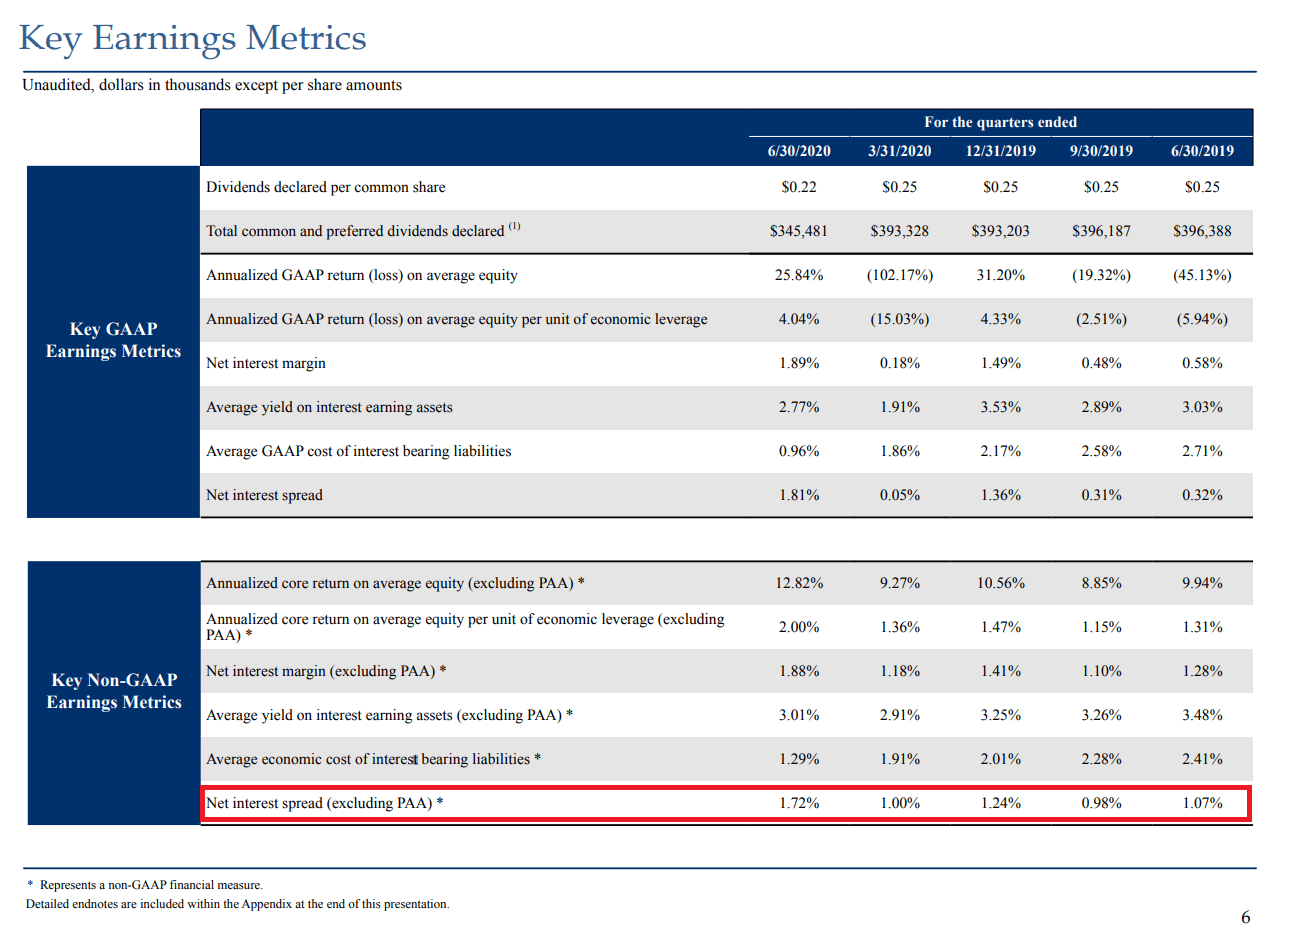
We want to use gross interest income rather than net interest income. However, we also need to make an adjustment. Many mortgage REITs will provide this adjustment for investors. We want to remove the impact of the PAA (premium amortization adjustment). The mortgage REITs will often have an adjustment for premium amortization. Annaly Capital Management will do this on their presentation slides (see red box):

Source: NLY investor presentation
They are required to have this adjustment. If you see any adjustments for premium amortization, we would follow the company’s guidance on how to handle it.
For instance, you might see $3 billion of gross interest income, but a charge for $1 billion in premium amortization adjustments. The company will demonstrate how to remove that amount. The quick version is to accept the values provided by management in calculating these metrics. The value we are trying to calculate is like Annaly’s "Average Yield on Interest Earning Assets (ex.PAA)." That's the element to remember here.
We can cover premium amortization adjustments in another article. The math is complicated enough to warrant an entire article. The simple summary for investors is this: The mortgage REIT is required to adjust interest income based on their estimates of premium amortization. They don’t know how fast their mortgages will be repaid, so it's always an estimate. When interest rates change significantly between quarters, management will need to adjust their estimate for prepayments. When they make that adjustment, they include a change to gross interest income to reflect the value for all prior periods.
Cost of funds
The cost of funds is how we evaluate the cost of a mortgage REIT borrowing money. It's calculated as the interest expense divided by the average balance of their interest-bearing liabilities. As of Q2 2020, the cost of funds for most mortgage REITs will be quite low. The cheapest way for a mortgage REIT to borrow money is through repurchase agreements. The mortgage REIT earns money from having a higher yield on assets than their cost of funds. You may notice multiple values reported for the cost of funds. Often, the second value would be labeled the economic cost of funds. You can see how Annaly Capital Management labels it on their presentation slide (see red box):
Source: NLY investor presentation
The economic cost of funds simply indicates that the mortgage REIT is including the net interest expense or income from their hedges as part of the metric. We see no problem with that technique.
Net interest spread and net interest margin
The net interest spread is the difference between the yield on assets and the cost of funds. For a mortgage REIT with relatively little credit risk, the net interest spread will often be relatively small. For instance, you might expect a value between 0.75% and 2%. For a mortgage REIT focused on credit-sensitive assets, the net interest spread is often much larger. You might expect values between 1.5% and 4%. The mortgage REIT with less credit risk can afford to use higher leverage. Consequently, the mortgage REIT with less credit risk has a thinner spread but higher leverage on the spread.
Another term that's commonly confused with “net interest spread” is “net interest margin.” We were going to stick to using “net interest spread” for this article, but Annaly’s slides display the “net interest margin” instead.
Without going deep into the details, the “net interest margin” almost will always be a bit bigger than the net interest spread. The net interest margin is simply "net interest income divided by interest-earning assets."
You can find the net interest margin in NLY’s investor presentation (see red box):

Source: NLY investor presentation
Again, we like to focus on the values which excluded PAA. You can see that the metric is marked “(ex. PAA)” to indicate that it is excluding PAA.
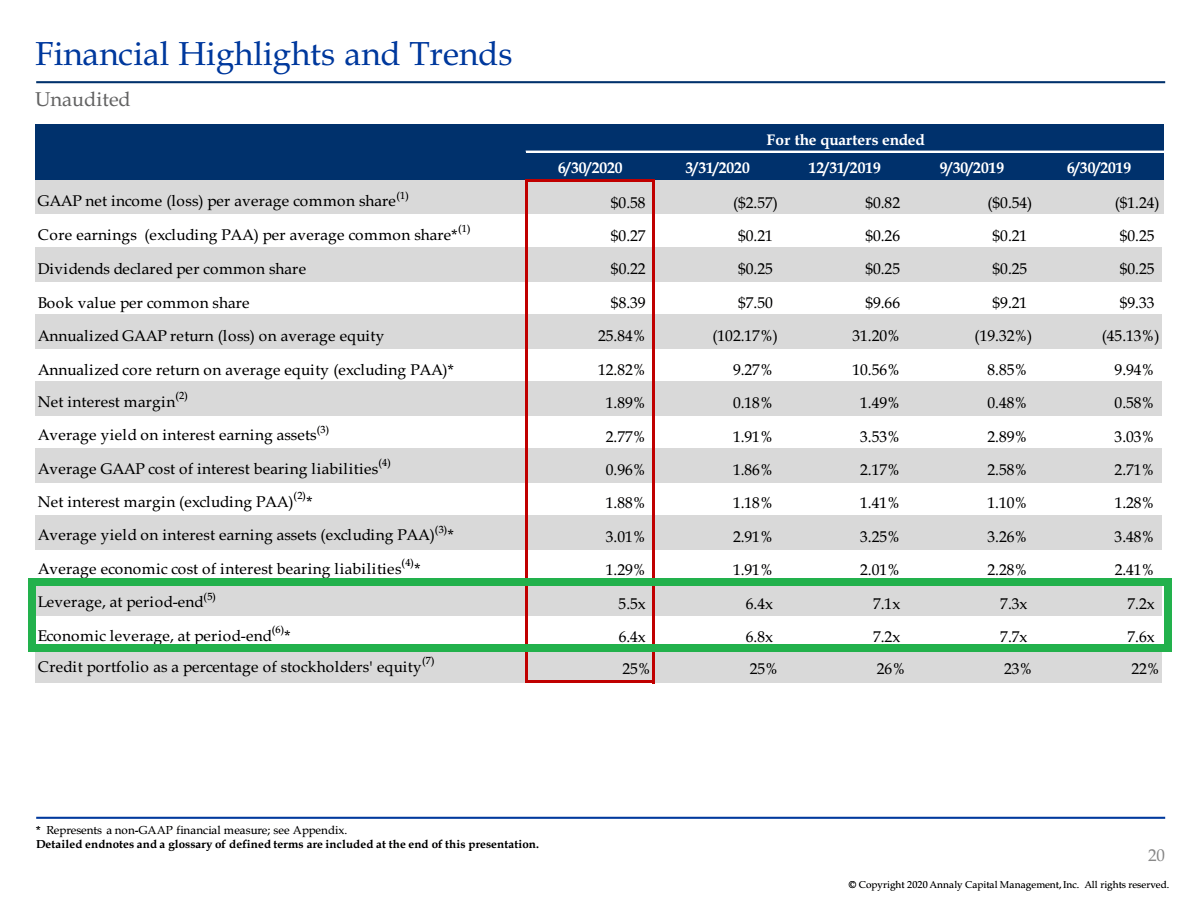
NLY also shows us their net interest margin over time (see red box):
Source: NLY investor presentation
Leverage
The leverage tells investors how much debt is used in financing the portfolio. For a mortgage REIT with relatively little credit risk like Annaly Capital Management, you might expect between 5x and 8x leverage. Here's NLY’s leverage over the last several periods (see green box):
Source: NLY investor presentation
Higher leverage increases risk if we are talking about the same assets. In practice, the REITs with the most credit risk will usually have dramatically lower leverage. However, if two REITs had extremely similar assets then higher leverage would indicate additional risk.
Approximating net interest income
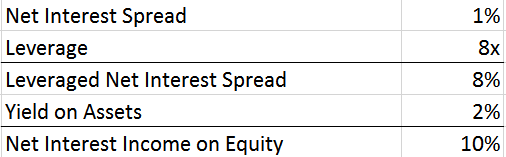
If you had a hypothetical mortgage REIT (not Annaly) with a 2% yield on assets and a 1% net interest spread, you could use the leverage to approximate the amount of net interest income generated with each dollar of book value. Keep in mind that this is an approximation. You begin by taking the net interest spread of 1% and multiplying it by the leverage of 8x. That gives you 8% from the net interest spread. Add 2% for the yield on assets that are financed through equity. That gives you 10% in net interest spread per dollar of equity. Here’s a quick table to demonstrate the math:
Source: Author
For instance, if the mortgage REIT had $10 of equity, you would estimate $1 of net interest income. If they had $20 of equity, you would estimate $2 of net interest income.
Here is the math:
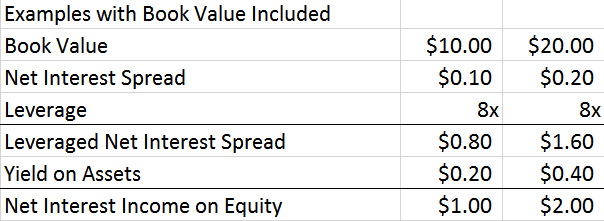
Source: Author
Obvious point
This feels obvious, but I'm compelled to say it. Annaly Capital Management's book value at the end of Q2 2020 was $8.39 per common share. It was not $10.00, or $20.00, or somehow both $10.00 and $20.00. The values used for the example were picked as round numbers because they are easy to for people to follow.
Further, we used a "hypothetical mortgage REIT" in bold and indicated it was "not Annaly" because the yield on assets, net interest spread, and leverage demonstrated in this section were also chosen to be nice round numbers.
Most likely, at least one person will skim through the article and still have a "question" about this.
Estimates
Keep in mind that this method is designed to produce estimates. It would be nice if it were perfect, but it won’t be. There are a few factors that will make it imprecise. The first is that there will be assets which are not “interest-earning” and liabilities which are not “interest-bearing.” Consequently, the leverage won’t tie everything together perfectly. Further, you will know the leverage for the last day of each quarter, but you won’t know the leverage in between those dates. Finally, you would need to include the impact of preferred equity. You can factor that in, but it requires some additional steps which go beyond the scope of this article.
We are focusing on helping investors with the broad picture because that's the more important part to understand. As we mentioned at the start of the article, these tools should be used to understand how book value is involved in generating returns. Conceptually, you can see that now. You can understand how the net interest spread ties in with leverage and the yield on assets to produce the net interest income. You can see how those percentages can be applied to equity to reach rough estimates. You can see how having more book value per share naturally leads to more net interest income per share.
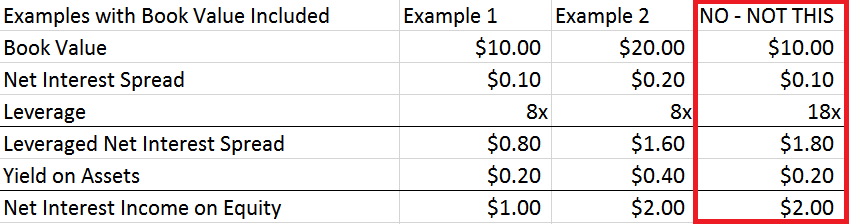
Ramping leverage
We have one last point to discuss. Some readers at this point are most likely thinking about the net interest spread and saying “Well, if you add more leverage, the REIT with $10 could keep up.”
Let’s expand our examples a little further by adding one more box on the right:
Source: Author
That box on the right is not viable. Your banks won’t agree to finance you at that level of leverage. Excess leverage is the factor that really hammered some mortgage REITs in March 2020.
Rating
We're currently bullish on NLY. The index card below uses our estimates for book value as of the end of last week (Aug. 28, 2020) and the most recent prices (as of publication).
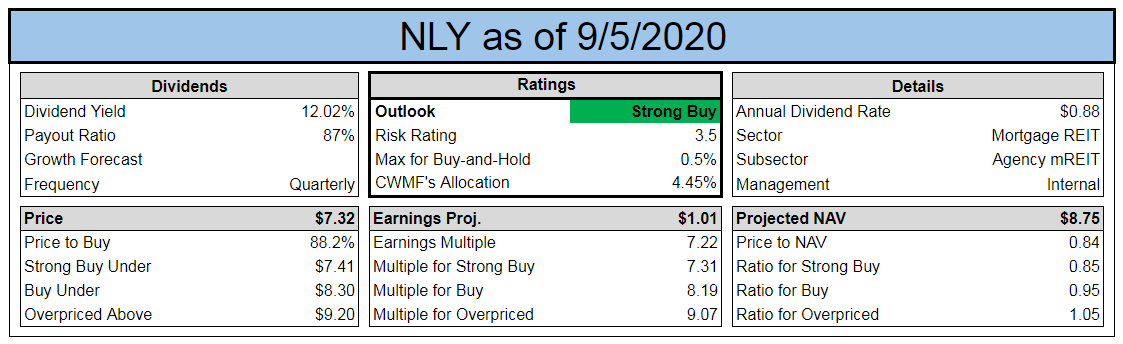
Source: The REIT Forum
Because NLY trades at a very significant discount to estimated book value (shown as "Price to NAV"), investors are paying less than one dollar per dollar of equity. When the "Price to NAV" is .84, the investor gets about $1.19 in equity for each $1.00 spent. Consequently, the company is generating earnings from a book value which is higher than the price the investor is paying for their position. That's great for investors!
Final thoughts
Because the calculations to estimate net interest income still rely on book value, you can see that book value remains a critical element in driving earnings. If a mortgage REIT doubled their book value per share, they could earn twice as much net interest income per share. Why? Because they would have twice as much in assets per share (assuming the same leverage). If they can own twice as many assets with each share, they can earn twice as much.
Likewise, if the book value was chopped in half, it would create a similar reduction in their ability to generate future net interest income. However, there's a caveat here. The available yield on assets and the cost of funds going forward is constantly changing. However, they usually (not always) change by a similar amount.
We can demonstrate that using Annaly’s value for net interest spread over the last five quarters:
Source: NLY
The only quarter where it landed outside the range of 0.98% to 1.24% was in Q2 2020, where it came in at 1.72%. Getting into scenarios where the yield on assets and cost of funds change by different amounts (leading to a major change in the net interest spread) is beyond the scope of this article, but we are happy to cover it in a future article. If you’d like to see that article, make sure to hit the “follow” button beside my profile.
We are using company slides to demonstrate these lessons on mortgage REITs. However, if you are waiting for company presentations to update your estimates, you're waiting too long. Estimates should be updated frequently and the company report simply provides another update on top of the rest. As a new investor, the company presentations are a useful tool to practice your understanding. For an analyst, they are a useful tool to help teach investors about the REIT.
Want the best research? It’s time to raise your game. Get access to several features you won’t find on the public side.
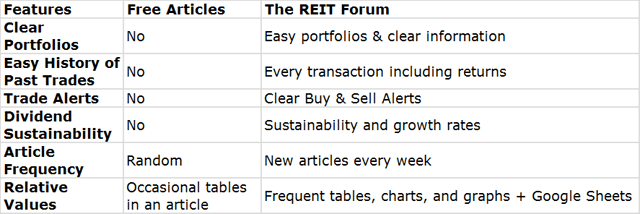
You can get access to everything we have to offer right now. Try our service and decide for yourself.