
After scouring high-income opportunities this weekend, I've come to the conclusion that a break may be in order. CEF valuations are up and climbing for everything that I find interesting. The RNP article I just wrote is typical: RNP is one of my absolute favorite funds in real estate. But as I concluded there, it's simply not a buy at its present valuation and yield point. I'll wait.
Usually we can see this in Z-scores but longer term, say 6 months to 1 year, Z-scores are skewed by the COVID drawdown and recovery. As we know CEFs' retreat in March 2020 was much deeper than the general market retreat. As the selling pressure took hold in CEFs, prices naturally plummeted, but market prices fell much more than NAVs. Of course there were bargains to be had by those prepared and intrepid enough to snatch them up, but those days are well past. As the recovery set in, buyers returned, this time erasing much of the market to NAV differential. This movement has been the year-long trend, which skews the Z-scores strongly positive.
I sorted all taxable fixed-income and all equity CEFs on cefanalyzer to get a picture of the CEF market. Only 10% of fixed-income and 9% of equity CEFs have negative Z-scores for the last year. Extraordinary, but to be expected with the recovery of the market. What's more telling on the current state of the CEF marketplace is the 1-month Z-scores and even those are skewed heavily toward overvaluation. For the taxable fixed-income categories only 22% have negative Z-scores; in equity it's 25%.

What this tells me is that not only is there a lack of bargains in CEFs, it's going to be hard to find anything in a reasonable buy range based on valuation.
With this dismal picture in mind, I think I'll be taking a break from writing about CEFs for a while as I wait for the inevitable reversion to the mean to do its magic. But before I do I want to look at one more fund. I've already covered (here) one fund in the Limited Duration Debt category, BlackRock Limited Duration Income Trust (BLW) which had the lowest distribution rate in the category. Now I want to discuss a second fund from that group, Eaton Vance Limited Duration Income (NYSE:EVV) in part because EVV has a much higher distribution rate.
Limited Duration Fixed Income
Limited duration has appeal in the current high-yield, fixed-income environment as it provides some cushion against rising interest rates. For readers less familiar with the concept of duration, let me just state that duration is not maturity or even time to maturity. BlackRock has a good explanation here that should help clarify the concept. The relevant takeaway from BlackRock's article is:
Duration... has a very specific meaning: The sensitivity of a bond's price to changes in interest rates. The higher a bond's duration, the more the bond's price will change when interest rates move, thus the higher the interest rate risk. When investors believe interest rates are going to increase, they generally shift to a lower duration strategy to reduce the interest rate risk in their portfolios.
Eaton Vance Limited Duration Income
EVV's stated objective is "to provide a high level of current income. The Fund may, as a secondary objective, also seek capital appreciation to the extent consistent with its primary goal of high current income." This is fully consistent with the objectives of the Sustainable Income Portfolio.
It accesses a broad range of income asset classes employing a low-duration strategy to provide limited interest-rate risk. Managers seek to maintain an average effective duration under five years. The current effective duration as reported by Morningstar is 3.10 compared to a category average of 3.97.

The fund's credit quality mix is seen in the next chart.

With 30% investment-grade credit holdings, this is a higher-than-typical quality mix for high-yield fixed-income. It benefits from the 20% allocation to agency mortgage-backed securities.
Valuation and Z-Scores
EVV has a -7.0% discount, which is barely off its 52-week high of -6.4%. It is, however, the deepest discount in the category.

Like the discount, the Z-scores are not reflecting a screaming buy, but they too are the most attractive in the category with the exception of the troubled FTF (see a brief discussion of FTF here).

EVV is not a fund priced at a bargain to be sure, but it is beginning to look like it may be a reasonable buy. The question relevant to the objectives of the Sustainable Income Portfolio is "Is it sustainable?"
Distributions
EVV has a market distribution rate of 9.5%.
The distribution rate is the second highest in the category. Only FTF, which has initiated a policy of returning principal to shareholders to maintain an annual minimum return of 10% on NAV, has a higher distribution.

EVV has a history of cutting its distribution at times to keep in line with decreasing investment income. The fund's tenure (inception date is 30 May 2003) is marked by several such cuts:

These sorts of cuts are a reasonable expectation in a fixed income CEF that pays a high distribution rate relative to its category. There are exceptional funds that are exceptions to this general rule but they tend to command a high premium most of the time. At a time when higher than normal valuations are the norm, funds that are accustomed to high premium rise to stratospheric premiums.
The most recent change for EVV, however, was not a distribution cut, but a 43% increase (from $0.07 to $0.10) for the last quarter of 2019. This came hot on the heels of a 4.5% increase only four months previously. Thus there was a 50% increase over those few months. Interestingly, this round of increases was bracketed by an uncharacteristic period of return of capital in EVV's distributions. RoC in fixed-income funds can sometimes indicate distribution cuts may be on the way; not so in this case.
In September 2018 Eaton-Vance completed a tender offer to repurchase 19% of the fund's outstanding shares. The RoC from this period likely followed the repositioning of the funds' portfolio following the tendering of 19% of its shares.
In the time since the 50% increase in distribution rate, EVV's NAV has fallen -6.3%. Of course, this is complicated by the deep drawdowns across asset classes due to the pandemic, so it's difficult to parse what contribution the distribution rate increase may have made to the NAV decline. But do notice that over the period EVV has the second worst NAV performance in the category.
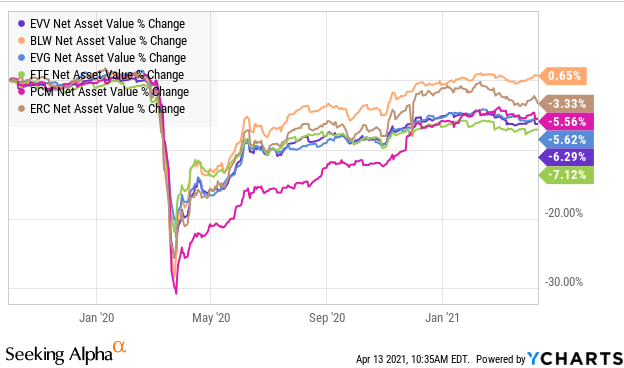
If we look at the recovery period, say the past nine months, we see that EVV still has the second worst NAV return.

How troubling is the NAV performance? One can only expect that EVV's high distribution will take a toll on NAV. But its high distribution relative to the category is in part a consequence of its deep discount relative to the category. Take away that discount and EVV's distribution rate on NAV is not out of line with some of the funds that cluster above it on NAV returns.
Distribution Coverage
CEFdata reports a concerning trend in EVV earnings and Undistributed Net Investment Income (UNII). The site presents the data graphically and expressly prohibits reproduction of their charts in any form, so interested readers will have to access the site directly. I'll try to describe what's there.
They report the fund's earnings as trending down. UNII is negative and trending down as well. The most recent numbers at CEFdata show the category average UNII at -$0.055/share; it's $0.349/share for EVV. The charts show a decline in UNII from September 2019, when the distribution was raised, followed by a recovery in April, May 2020. But the period since shows a new drop in UNII beginning August 2020, taking UNII to even deeper levels than the late 2019 to early 2020 drop.
Similar trends are evident in earnings coverage, which fell sharply following the distribution increase to a flat period near 67%. From mid-2020 the earnings coverage has been falling again, reaching down to 61% for the most recent reported value at the end of January 2021. At that time the fund was earning $0.061 per share and paying out $0.10 per share monthly. Looking back to 2011, EVV's previous low point for earnings coverage was 80%.
I have been unable to run down any explanation for this seemingly anomalous state of affairs. NAV is healthy for the past six months or so, yet earnings coverage has come down precipitously.
SABA, the CEF activist group, had been buying large stakes in several Eaton-Vance fixed-income funds. The reported purchase of 5.6% of EVV's shares in January 2020 led me to think something may have been going on in response to activist actions. But SABA was reducing that position in November 2020. There does not appear to be any other activist activities that might be relevant here. Perhaps there is someone among readers of this article who has some insight they would like to share in the comments.
Without some underlying explanation for those numbers, I have to suspect that a distribution cut is looming in the near future. As I noted above, EVV does have a history of cutting distributions as market conditions dictate. But none of the other cuts were preceded by such sustained and deep shortfalls in earnings coverage as the fund has experienced in recent months.
I had been considering EVV as a low-duration fund to hold for the short- to medium-term. I was attracted to its high distribution rate and significant discount along with the protection against rising interest rates that should come with its low-duration portfolio. A distribution cut that can begin to bring UNII and earnings coverage back to the fund's historical levels would potentially be drastic. On the other hand, I'm reminded that NAV has achieved some stability, meaning things may not be as drastic as the coverage data may indicate.
At this point, I will forego any moves but I will keep watching the fund. The biggest risk to CEFs is a sharp distribution cut. Typically, such cuts will trigger selling pressure and a deepening in the discount. This is especially hard on a recent buyer. I don't want to be that buyer.