
Investment Thesis
Those boundaries provide the basis for comparing CareDx, Inc. (NASDAQ:CDNA) with other healthcare diagnostic competitors. And by the careful construct of comparative measures, we are able to make valid and profitable comparisons with other stock investments well outside of their more limited forte. Comparisons cognizant of the Risk~Reward tradeoff differences present in all stock investments.
Comparisons not possible to be adequately made when forecasts reach beyond time limits of visibility and beyond the absence of risk measures in usual quantitative analysis so frightfully lacking in definition and in analysis presentations. So we will start with more clear and balanced visual comparisons and then proceed to how the measures come about and what they really mean.
Subject company's description
"CareDx, Inc. discovers, develops, and commercializes diagnostic solutions for transplant patients and caregivers worldwide. CareDx, Inc. has a license agreement with Illumina, Inc. for the distribution, development and commercialization rights to NGS products and technologies; and Cibiltech SAS to commercialize KidneyCare iBox, a software for the predictive analysis of post-transplantation kidney allograft loss. The company was formerly known as XDx, Inc. and changed its name to CareDx, Inc. in March 2014. CareDx, Inc. was incorporated in 1998 and is headquartered in South San Francisco, California." - Source: Yahoo Finance

Source: Yahoo Finance
Comparing Competitors' Risks and Rewards
Figure 1

(used with permission)
The tradeoffs here are between near-term upside price gains (green horizontal scale) seen worth protecting against by Market-Makers with short positions in each of the stocks, and the prior actual price drawdowns experienced by owners during holdings of those stocks (red vertical scale). Both scales are of percent change from zero to 25%.
The intersection of those coordinates by the numbered positions is identified by the stock symbols in the blue field to the right.
The dotted diagonal line marks the points of equal upside price change forecasts derived from Market-Maker [MM] hedging actions, and the actual worst-case price drawdowns from positions that could have been taken following prior MM forecasts like today's.
Our principal interest is in CDNA at location [1]. Other stocks on the reward~risk tradeoff "frontier" are IDXX at [9], SPY at [10] and GH at [2]. Are they better wealth-building bets than CDNA?
This map is a good starting point, but it can only cover some of the investment characteristics that often should influence an investor's choice of where to put his/her capital to work. The table in Figure 2 covers the above considerations and several others.
Figure 2

Readers familiar with our combing procedures to sort out the best ODDS for near-term capital gains may want here to skip to the heading of Value Considerations.
The price-range forecast limits of columns [B] and [C] get defined by MM hedging actions to protect firm capital required to create short positions at risk of price increases to respond to volume trade orders placed by big-$ "institutional" clients.
[E] measures potential upside risks for MM short positions created to fill such orders, and reward potentials for the buy-side positions so created. The buy-side risks actually encountered from prior forecasts like the present are in [F], as the most severe loss moments encountered during holding periods in effort to reach [E] gains. Those are where buyers are most likely to accept losses and sell.
[H] tells what proportion of the [L] sample of prior like forecasts have earned gains by either having price reach its [B] target, or be above its [D] entry cost at the end of a 3-month max-patience holding period limit. [ I ] gives the net gains-losses of those [L] experiences and [N] suggests how credible [E] may be compared to [ I ].
Further Reward~Risk tradeoffs involve using the [H] odds for gains with the 100 - H loss odds as weights for N-conditioned [E] and for [F], for a combined-return score [Q]. The typical position holding period [J] on [Q] provides a figure of merit [fom] ranking measure [R] useful in portfolio position preferencing. Figure 2 is row-ranked on R among candidate securities, with concerns for many in lower ranks due to limitations suggested by forecast data, as indicated by the pink color alert.
Figure 2 presents the MMs' price range forecasts for the best-ranked alternative investment candidates in Figure 1, along with the past 5 years of daily forecasts outcomes from their prior forecasts with the same proportions of today's up-to-down prospects.
This table presents data on the stocks most likely to produce satisfying rates of capital gain under the portfolio management discipline known as TERMD, as explained in the article titled "How To Better-Than-Double Your Capital Gains (From Stocks Alone) By Using TERMD Portfolio Discipline" in my SA blog.
That discipline seeks the largest, most likely, quickest to be captured net capital gains with the least interim exposure to price drawdown on the way to target reward attainment.
Value considerations
The value of time is high when pursuing active investing strategies like TERMD because time, when lost by inaction forced by "buy&hold" strategies can never be recovered and reused. A passive market-index strategy like b&h forces SPY into four nearly 3-month reinvestment gains (57 market days out of the 63 in a 252-day market year). When compared to holding periods like that of CDNA which at 25 are less than half as long and maybe compounded into a ten-fold result even a period gain as small as SPY's 5+% becomes huge. Here the presence of a near +25% period-gain historically approaches 1,000% when the odds of loss experience drops to zero.
CDNA's history of realized payoffs at a Range Index [G] of 14 has been 21 wins out of 21. The worst-case price drawdowns of -4.4% occurred during those 25-day [J] holding periods, but were not present when the positions were closed out. The -4.4% loss exposures are helpful to know as the maximum loss which might have been surrendered at the point of poorest judgment. The high level of gain realization here makes them trivial.
The further attractiveness of CDNA displayed in Figure 2 is its realized gain average [I] larger than its present forecast [E] of +22.5%. Second-place ranked stock NTRA has about as high a realization as CDNA, but a much longer typical holding period and a less than perfect Win Odds [H]. Thus its [R] score is doubly reduced, compared to CDNA.
Still, both of these stocks offer near-term profit prospects well above the 29.0 bp/day average of the best-ranked 20 stocks out of a forecast population of over 3,500 stocks, as does GH with a questionably small sample. Small enough to keep it out of the 20-best race.
Subject's Recent trends of MM Forecasts
Figure 3
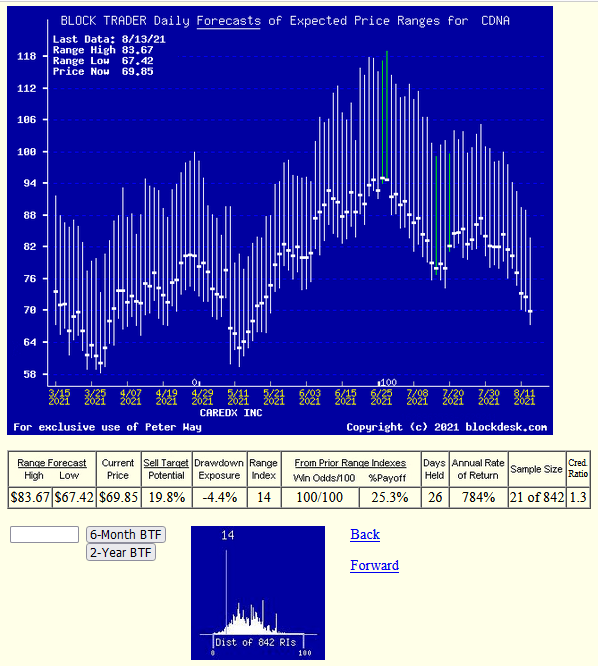 source: Author, blockdesk.com (used with permission)
Figure 3 provides a current look at CDNA's progress of daily MM price range forecasts. The vertical lines of each forecast contain a large dot at the level of the market-close price of the day of the forecast. That offers a visual reference to both the daily trend of the forecast range, and to the evolving change which may be occurring in the risk~reward balance.
A major factor in CDNA's outlook is its low Range Index, as can be seen in Figure 3's bottom "thumbnail" picture of the past 3+ year's daily MM forecasts. Most CDNA forecasts have included higher price ranges, and all of every 21 at this RI level has turned out to be profitable at annual rates of over 100%.
Conclusion
Stocks involved with healthcare diagnosis appear to draw exceptionally favorable choices among institutional investors. The clear best of the group at this point in time is CareDx, Inc. which is a strong buy candidate for any portfolio intent on near-term capital gain.
Additional disclosure: Peter Way and generations of the Way Family are long-term providers of perspective information, earlier helping professional investors and now individual investors, discriminate between wealth-building opportunities in individual stocks and ETFs. We do not manage money for others outside of the family but do provide pro bono consulting for a limited number of not-for-profit organizations.
We firmly believe investors need to maintain skin in their game by actively initiating commitment choices of capital and time investments in their personal portfolios. So our information presents for D-I-Y investor guidance what the arguably best-informed professional investors are thinking. Their insights, revealed through their own self-protective hedging actions, tell what they believe is most likely to happen to the prices of specific issues in coming weeks and months. Evidences of how such prior forecasts have worked out are routinely provided. Our website, blockdesk.com has further information.