24K-Production/iStock Editorial via Getty Images
PayPal Holdings, Inc. (NASDAQ:PYPL) had become a veritable synonym for online payment since its IPO in 2002. Square Inc. (NYSE:SQ) operates in the same space and had its IPO in 2015. Both stocks have done reasonably well over the years but, given the facts presently, neither company earns a recommendation for inclusion into an investor's "core" portfolio particularly if either stock isn't already represented ("core" and "satellite" portfolios were discussed in an earlier article).
A Quick Outline
In 2015, eBay spun PayPal off to specialize in financial services. By the end of 2014, the company enabled online vendors to accept Bitcoin via its partnerships with Coinbase, BitPay and GoCoin. In October of last year, PayPal directly entered the crypto market with its new digital asset service allowing users to buy and sell select cryptocurrencies directly through the platform. The company has now integrated digital asset services on its mobile payment app subsidiary, Venmo.
Square was started by Twitter CEO Jack Dorsey and provides merchants payment solutions via both hardware and point-of-sale software in addition to analytics regarding payments. For buyers, its mobile payment service - Cash App - with a linked Visa debit card for withdrawals was long considered its flagship product. In recent times, Square reported that cash transactions at its U.S. merchants as a percentage of overall transactions fell from more than 50% in 2015 to around 30% in 2020. The bulk of the company's revenue in 2020, however, was from bitcoin (BTC-USD).
Cash App charges two fees - a service fee and an additional fee determined by price volatility - for each bitcoin transaction. Over the past year, revenue from bitcoin was nearly 10X greater than 2019's bitcoin revenue.
As of 2020, Square had 30 million monthly active users, of whom 7.5 million use Cash App daily. Venmo, in comparison, had 50 million users in the U.S. while its parent PayPal had 89% audience reach in the country.
Q3 vis-à-vis Past Years
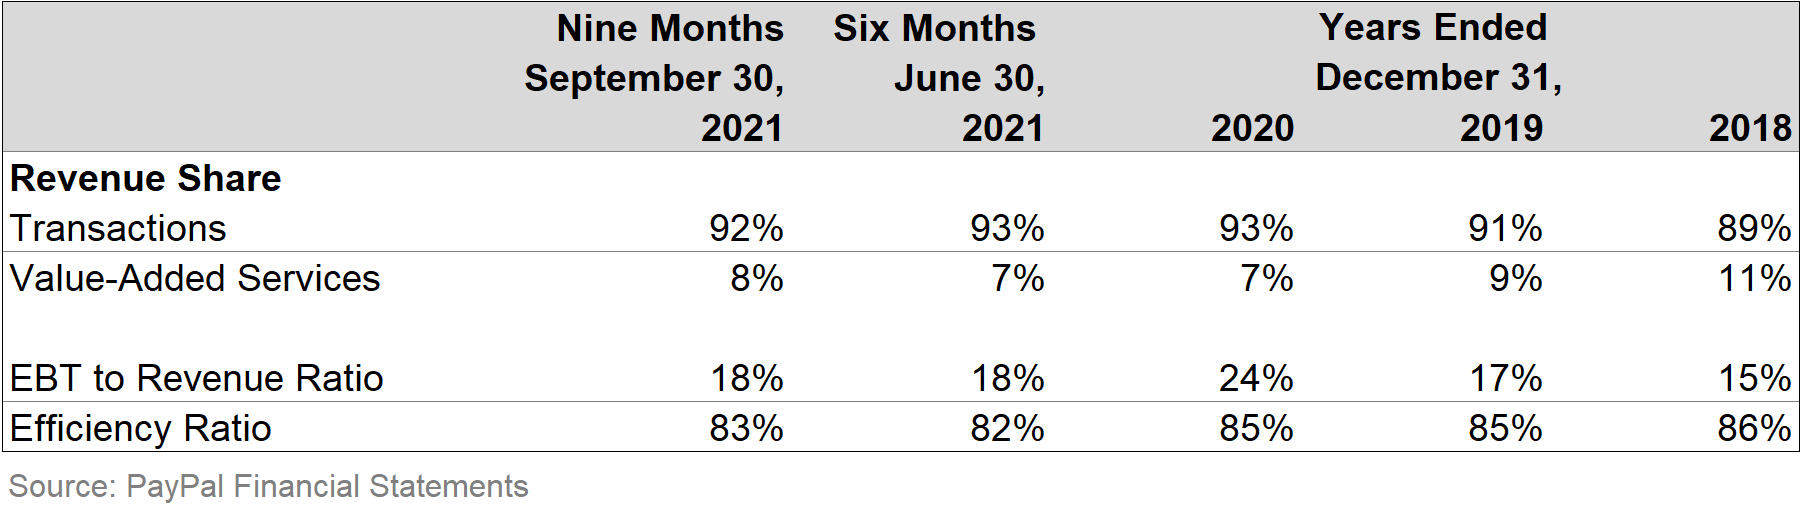
PayPal's Q3 update shows that there has been a slight uptick in the latest quarter that could edge the company's year-end performance past that of the past year but with the growth rate seen in the past year relative to 2019.

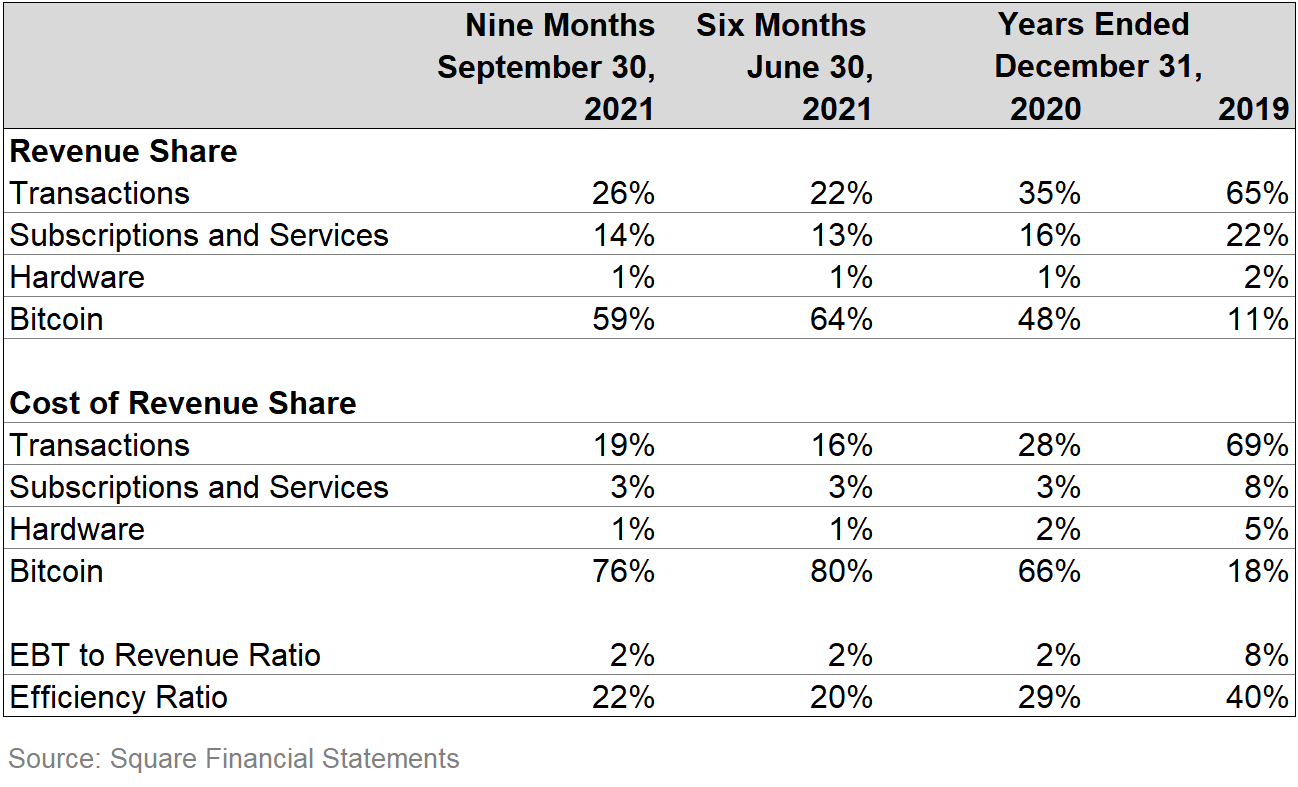
The company's transactions segment has held steady in revenue share since the past year. The company has seen some impairment in its passthrough efficiency in translating revenue to earnings but its efficiency ratio still remains quite high.
 The company's operating metrics indicate that the number of active accounts looks set to show around the same levels of growth as in 2019 but not 2020. Q3 also had a huge uptick in transactions, setting the stage for total transactions to surpass that in 2020 without showing the growth rate seen that year over 2019.
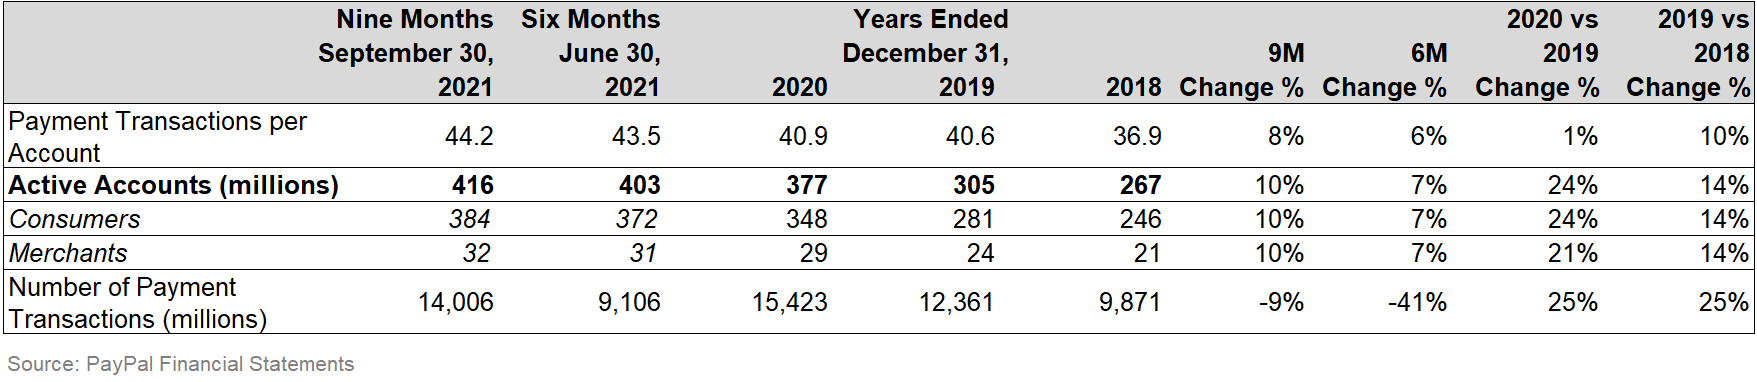
Note: The Q2 and Q3 updates didn't report a breakdown in active account type. The consumer/merchant mixes were imputed on a rolling basis from past years. All in all, the mix seems to be quite stable.
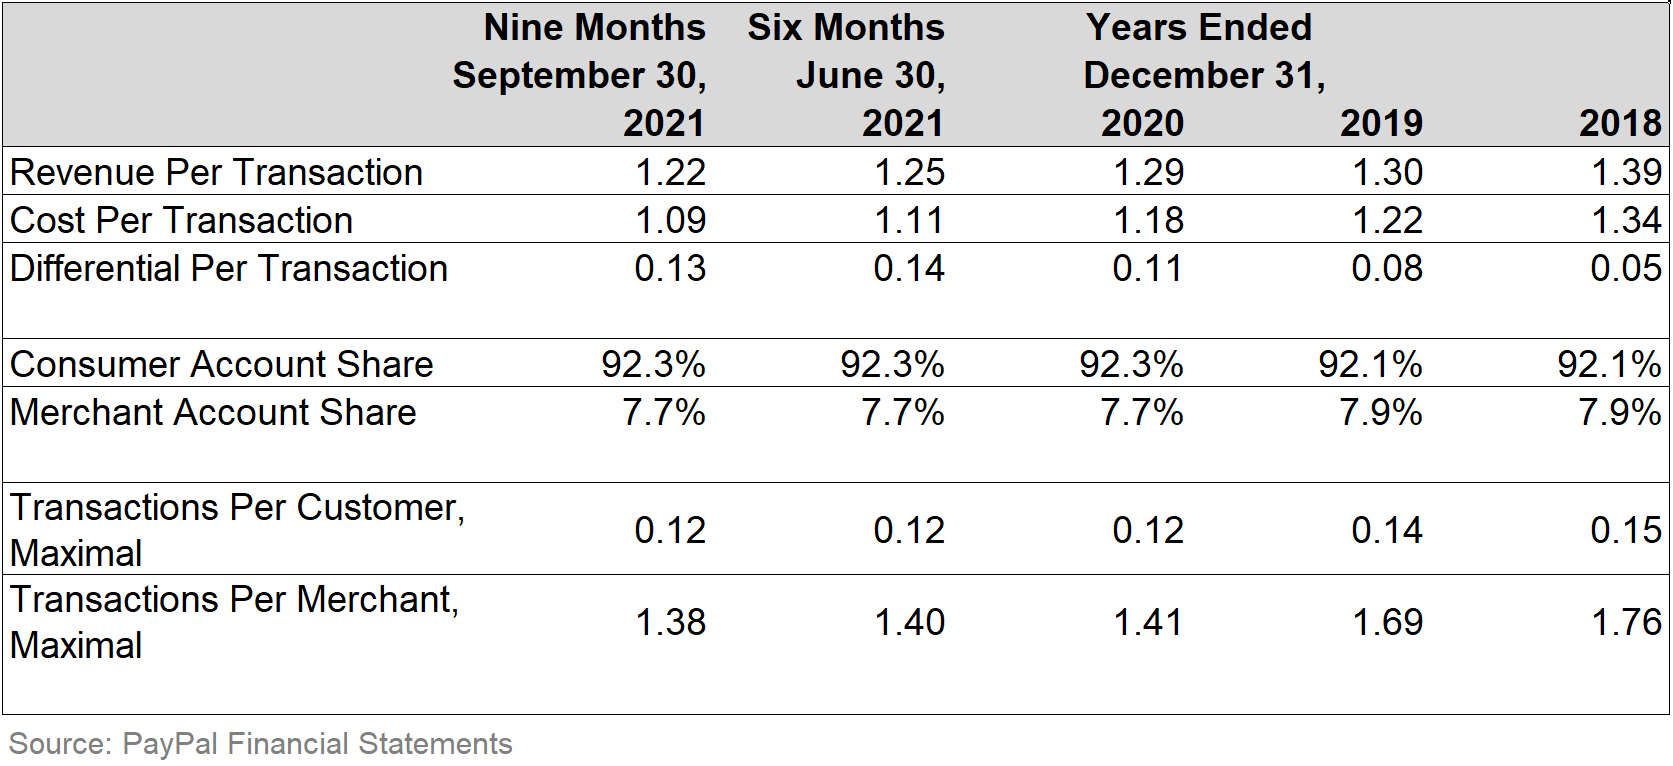
By combining metrics with the financials for a proxy of efficiency estimation, it is estimated that the differential per transaction has been a net positive for the company since 2018, with a healthy upward trend.
However, a "maximal" estimation - i.e., an assumption that all transactions are done either by customer accounts or merchant accounts - shows that the transaction per account in either boundary condition is largely set to remain unchanged from past years. The merchant boundary, however, shows some shrinking, just like in past years.
Meanwhile, Square's Q3 update shows some interesting developments relative to the previous year. Transaction revenue seems to be trending to close on par with growth rate seen in 2020 while bitcoin revenue has been the main driver in revenue growth. Furthermore, the former shows a pretty solid excess return relative to cost of revenue while the latter runs at par.
Operating expenses is trending to be lower in comparison to 2020 while the boost in bitcoin transactions helped propel the YTD operating income to a net positive this year.
Furthermore, net income is trending to close higher than 2020's but far short of that in 2019, partly due to bitcoin impairment costs negating some of the passthrough to net income.
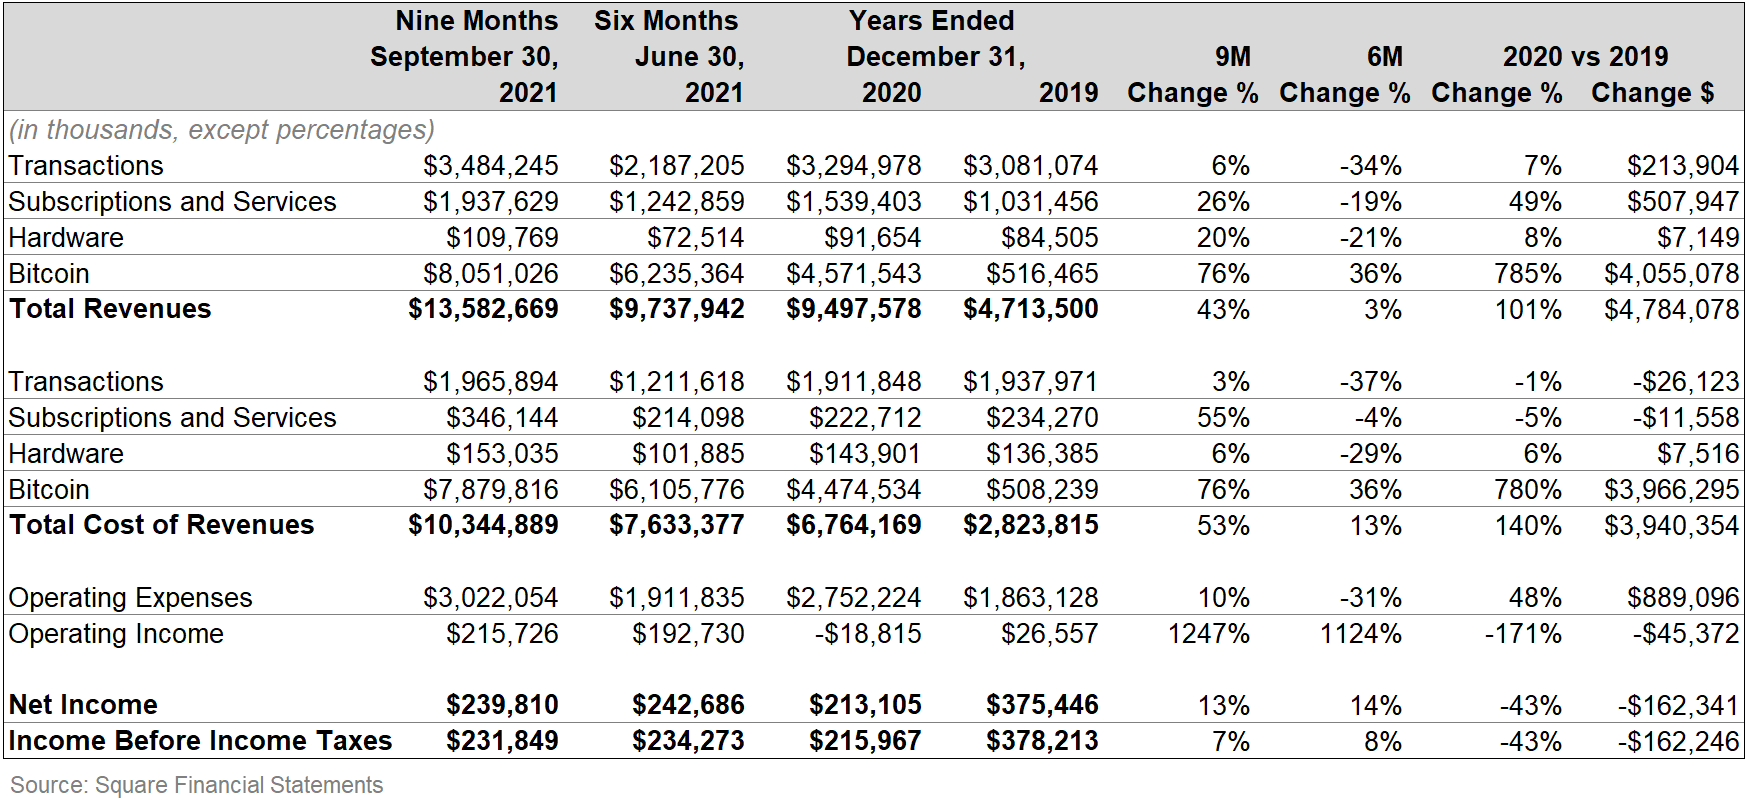
The low share of "standard" transactions relative to bitcoin is a matter of some concern here. The company's passthrough efficiency in translating revenue to earnings has slid lower than in 2019 while the efficiency ratio is also trending lower.
While Square doesn't offer operating metrics (yet), the company did report in its earnings call that bitcoin revenues fell through most of Q3 (barring October) and that transactions through debit cards and average transaction size were lower year-on-year. The latter seems to imply that bitcoin revenue becomes increasingly more important for the company.
Analysts reported a shortfall in meeting expectations across other names in the payments space as well, including at PayPal.
The Model Glitch In PayTM's IPO
Given consensus views on the fall in meeting expectations in this space, analysts might consider PayTM's lukewarm IPO to be an indicator of the same. This would be a false positive. The driving factor behind the reported underperformance of the IPO is India's United Payments Interface (UPI).
The Indian government has long been interested in a high adoption of digital payments by citizens. Towards this end, the country's central banking authority - the Reserve Bank of India (RBI) - funded the development of the UPI, which connects the country's banks and financial institutions (along with the likes of Google Pay) together so that users can transfer cash among themselves within seconds. To further this, RBI even oversaw the development of a single app called BHIM that users can download and configure to link with their bank accounts.
Furthermore, there are no transaction charges or limits on daily transactions. This is unlike with, say, Venmo and Cash App where a U.S. user will have to incur fees for cross-transfer of funds. The Indian government seems disinclined to allow fees to be introduced in this sector any time soon.
As a result, India's digital payments sector registered 10 billion more transactions in the past year than China's 15 billion and is set to account for over 70% of all payments by volume by over 500 million users by 2025.
In this environment where all barriers to entry by financial institutions - both big and small - have been reduced or altogether eradicated, analysts should have questioned what PayTM's unique selling point was. The answer would have been "none".
PayTM also hopes to be a primary destination for loan-seekers, with ambitions to have 1 million users in this category by the end of the fiscal year. Now, the company isn't registered as a financial institution; it partners with banks and other financial institutions who (in reality) offer the loan in exchange for the equivalent of a finder's fee. PayTM isn't the only "online business" that offers this facility nor was this practice introduced by "online businesses"; the country has long had an extensive network of independent "loan agents" who helped match loan-seekers with qualified lenders.
It's a problem when experienced/self-styled market professionals simply copy a forecasting model known to work elsewhere instead of building a model from scratch that takes into account key landscape features and specific externalities. The stock is currently under enormous selling pressure.
In India's case, the payments landscape had been leveled to accomplish a larger and more important national objective. This is a cultural differentiator between the East and West.
Note: for a comprehensive analysis of the "decoupling" of the East and West, refer to this article written earlier for full context.
Final Notes And Recommendation
In terms of landscape, there are two key factors that affect the payments space in the U.S.:
- There is a massive glut of digital financial services firms battling for market share across "standard" seller and buyer segments as well as the crypto wallet space.
- Increasing inflationary pressures tend to drag down consumption which, in turn, threatens transaction volumes for financial services.
Echoes of the second factor can be found in vehicle retail sales trends in the course of the analysis for Rivian as well as the analysis for the streaming market in light of Roku missing analysts' expectations.
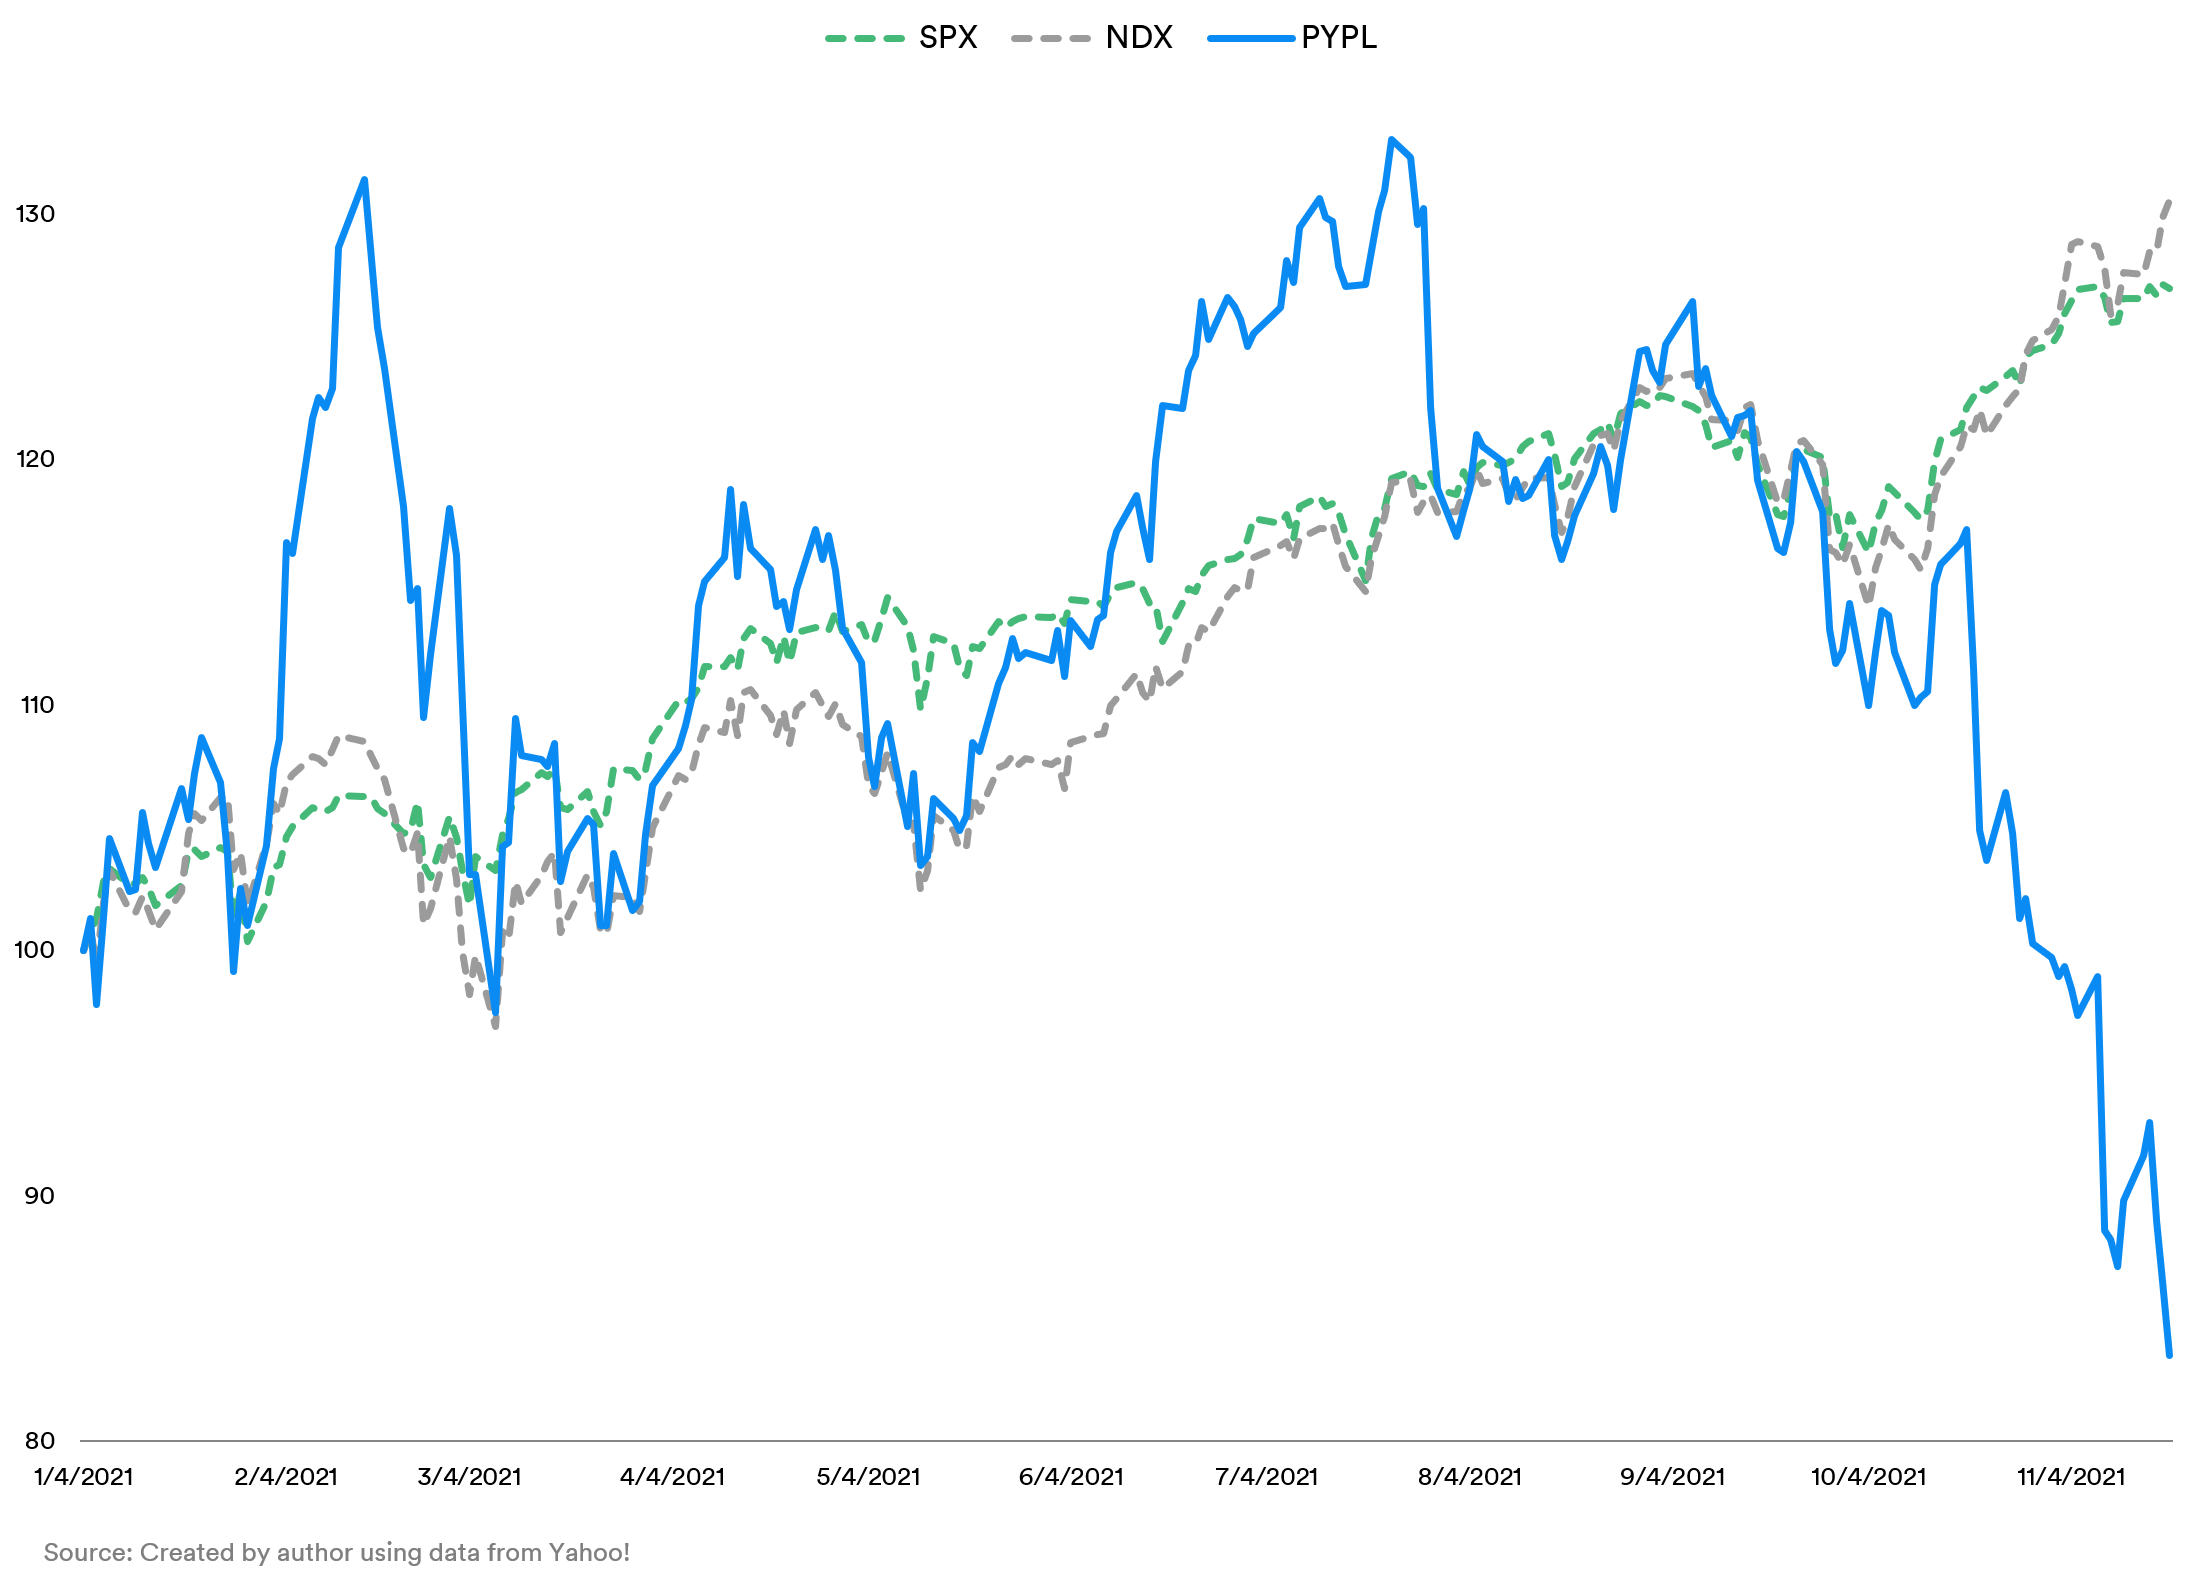
The YTD performance of PayPal's stock relative to the benchmarks Nasdaq-100 (NDX) and the S&P 500 (SPX) shows the stock's trajectory declining around the Q2 update.
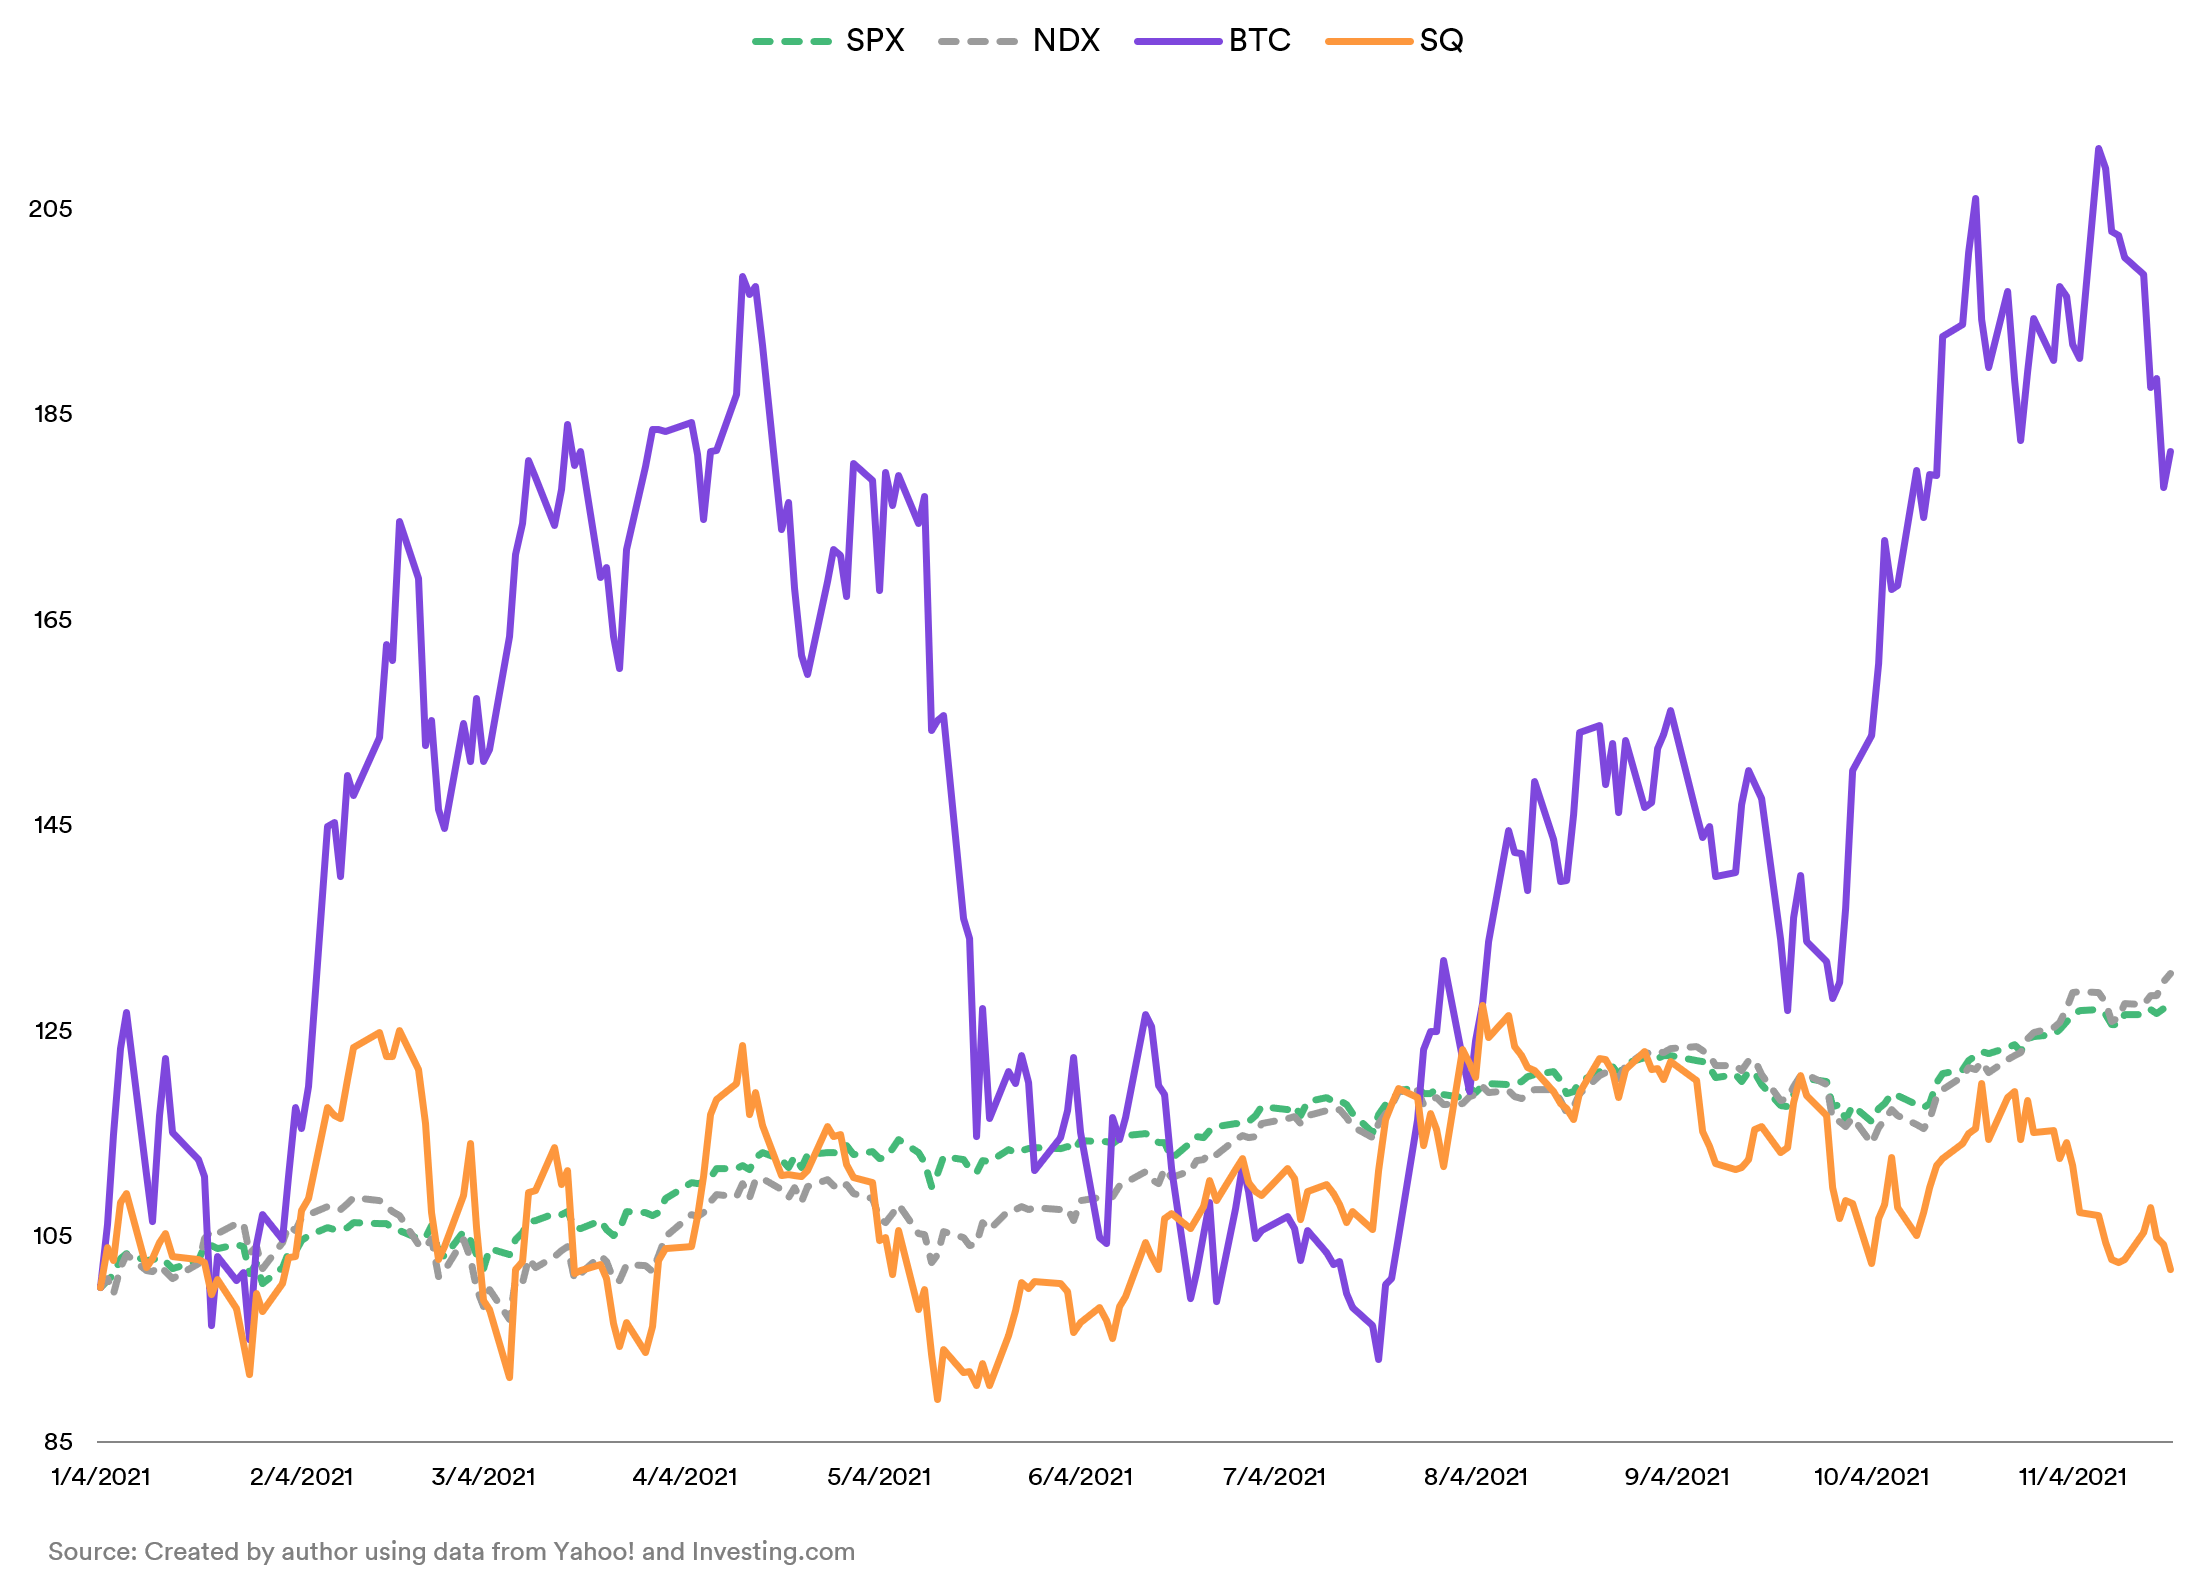
Square's performance might have been propped by the stellar performance in Bitcoin over the past year. However, investors in the crypto space have historically borne witness to high volatility, innovations and disruptions. At this stage of the space's evolution, it's perhaps unreasonable to expect the company to be preferred over the many other crypto wallet services. While the YTD performance of the stock shows some outperformance against the benchmarks early on, this too has been flagging since around the Q2 update.
In terms of "standard" market reach, the PayPal/Venmo combination is a very strong proposition and the line-item performance shows solid discipline. But stock trajectories have a "roof" and "floor": the former is defined by expectations and the latter by fundamentals.
When it comes to PayPal, the "floor" is solid while the "roof" is lowering. This poses a quandary for investors currently holding the stock: hold this stock until economic outlook improves or go elsewhere for value? Investors currently not holding the stock might want to consider the fact in recent history, under similar economic conditions, valuations tend to be relatively higher in the technology/industrials sector.
On the other hand, Square is relatively new on the block and was delivering results in line with expectations until it entered the crypto business. An interesting side-effect of this has been that the stock's trajectory has shown some correlation with that of Bitcoin. Short-term plays based on Bitcoin trajectories but with the stock is possible via fractional shorting/investing or leveraged instruments.
On a long-term basis, the battle for market share in the digital payments space is heating up. Both companies have made acquisitions in the "Buy Now, Pay Later" segment (PayPal bought Paidy; Square bought AfterPay) to bolster their technology as well as offering, which indicates that neither company is backing down from pursuing growth. This is altogether a good sign. However, given the macroeconomic conditions, investors would be hard-pressed to find this translating to stock performance in this sector for some time.
The facts presented form the core of the reasoning behind neither company receiving a recommendation for inclusion into an investor's "core" portfolio. Despite both companies' strong line-item performance, market reach and leadership vision (with PayPal scoring a little higher than Square), the current state of the payments landscape and the macroeconomic outlook are significant co-related factors weighing against them.