Khosrork/iStock via Getty Images
As a value investor, my focus is not on charts or recent stock price action, but rather on growth of earnings. For (equity) REITs, the best measure of this is AFFO/share, discussed in more detail below.
Some prominent authors on Seeking Alpha argue that REITs paying low dividend yields are much better positioned to grow rapidly. Certainly, many such REITs do have a track record of strong growth.
But other REITs, with one example being STORE Capital (STOR), pay comparatively high dividends and also have a record of strong growth.
Perhaps paying low dividends helps, but the evidence says that it is neither a necessary nor a sufficient condition for strong growth. Profitability must enter somehow. It does and you will see why and how here.
I show below how to accurately evaluate the rate of growth produced by selling shares. You will also see why the most easily obtained parameter that can be used to compare the ability of REITs to grow is not any kind of spread, but rather the ratio of cap rate for new properties to dividend yield.
A cautionary note: if you are looking for a shallow, rah-rah pump piece, this is not it.
Setting the Stage
The following is focused mainly on the issuance of shares of stock. The specific details of how REITs expand their real estate portfolio through development, redevelopment, acquisitions, and capital recycling are a topic for another day, as are details of internal growth.
I have been blessed to spend a good bit of time during the past couple years interacting with Chris Volk, mostly about his forthcoming book. He took three REITs public, most recently STORE Capital.
In the process, I have learned things that enabled the analysis below. Any errors, of course, are mine and not his.
Just in case you are new to REITs, here is a quick primer on the acronyms:
REIT Acronyms Author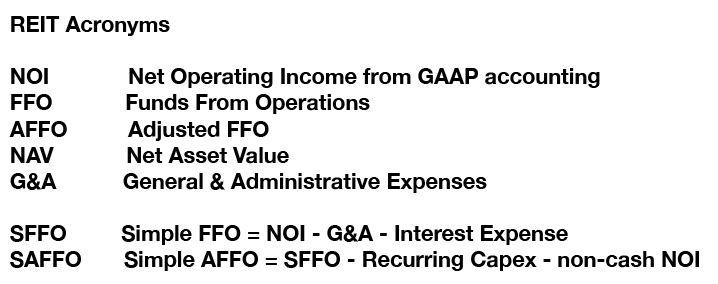
Traded AFFO Yield
At any moment, Mr. Market is willing to pay some multiple of AFFO for a specific REIT. The inverse of this is the Traded AFFO Yield.
Today, a lot of quality REITs have Traded AFFO Yields of 2.5% to 5%. That is to say, they are priced at 20x to 40x AFFO. Here are some examples using annualized Q3 AFFO/share from REITbase.net and current stock prices.
REIT | Ticker | Q3 FFO / Share | Q3 AFFO / Share | Ratio | Price | Price / AFFO | Traded AFFO Yield |
STORE Capital | (STOR) | $0.50 | $0.48 | 97% | $34.24 | 17.7 | 5.7% |
Realty Income | (O) | $0.85 | $0.88 | 104% | $71.41 | 20.2 | 4.9% |
W.P. Carey | (WPC) | $1.46 | $1.16 | 79% | $80.66 | 17.4 | 5.8% |
Federal Realty Trust | (FRT) | $1.51 | $1.19 | 79% | $138.00 | 29.0 | 3.4% |
Regency Centers | (REG) | $1.12 | $0.85 | 76% | $75.70 | 22.3 | 4.5% |
Camden Property Trust | (CPT) | $1.36 | $1.13 | 83% | $166.90 | 36.9 | 2.7% |
AvalonBay Communities | (AVB) | $1.96 | $1.69 | 86% | $248.90 | 36.7 | 2.7% |
Sun Communities | (SUI) | $1.92 | $1.96 | 102% | $196.22 | 25.0 | 4.0% |
Invitation Homes | (INVH) | $1.40 | $1.16 | 83% | $42.92 | 37.0 | 2.3% |
Prologis | (PLD) | $1.30 | $0.77 | 59% | $153.70 | 50.1 | 2.0% |
Crown Castle | (CCI) | $1.73 | $1.68 | 97% | $194.70 | 28.9 | 3.5% |
American Tower | (AMT) | $2.86 | $2.41 | 84% | $266.60 | 27.7 | 3.6% |
Boston Properties | (BXP) | $1.73 | $1.31 | 76% | $125.60 | 24.0 | 4.2% |
Alexandria Real Estate Equities | (ARE) | $2.04 | $1.51 | 74% | $209.00 | 34.7 | 2.9% |
The numbers for PLD are probably too low and a one-quarter aberration. But this article is more concerned with big picture theory and perspective than with specific REITs. So, that too will have to be an exploration for another day.
Since dividends typically run 80% of AFFO, the dividend yield is typically about 80% of the Traded AFFO Yield. If the Traded AFFO Yield is 2.5%, the dividend yield is typically near 2%.
Accretive Share Issuance?
Every REIT has the option to issue shares, raise equity, and purchase or develop additional properties. In general, one likes to see them do that when the process is accretive to the value of the current shares. In particular, one likes to see AFFO/share increase as a result.
Yet investing new equity by adding to the properties a REIT owns generates profits that have no relation to the Traded AFFO Yield just discussed. Instead, they reflect the Investment AFFO Yield.
We will first see how one can evaluate the growth produced. Later, we will unpack the Investment AFFO Yield.
Here is a concrete example of issuing shares to generate increased value for existing shareholders. For simplicity, we assume here first that the only growth is external growth.
Example of pure external growth Author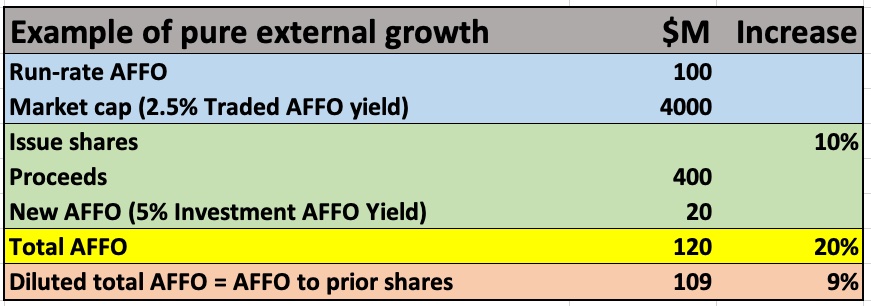
Here, the rows shaded blue show the starting point, with an AFFO of $100M and a market cap of $4B. The stock is trading at a 2.5% AFFO yield (or 40x AFFO).
The first two rows shaded green illustrate the issuance of shares equal to 10% of the pre-existing shares, generating $400M as new equity. In this action, the REIT has sold 9% of the company to the new shareholders. The share of AFFO owned by the prior shareholders has dropped from $100M to $91M.
Investing that $400M produces $20M of new FFO, using a 5% Investment AFFO Yield. The third row shaded green shows this.
Next, we add this to the previous AFFO to get the new total AFFO, on the row shaded yellow. But the prior shareholders only have rights to 91% of this. So, we divide the total AFFO by 1.1 to properly include the impact of the equity issuance.
This lets us see, on the row shaded orange, that the prior shareholders have seen their AFFO/share increase by 9%. The new shareholders get the full benefit of the increase in AFFO, since they were not diluted. Their portion increases by 20%, from $9M to $11M.
The mathematics that summarizes this calculation is quite simple and is illustrated here:
Equation for AFFO/sh growth Author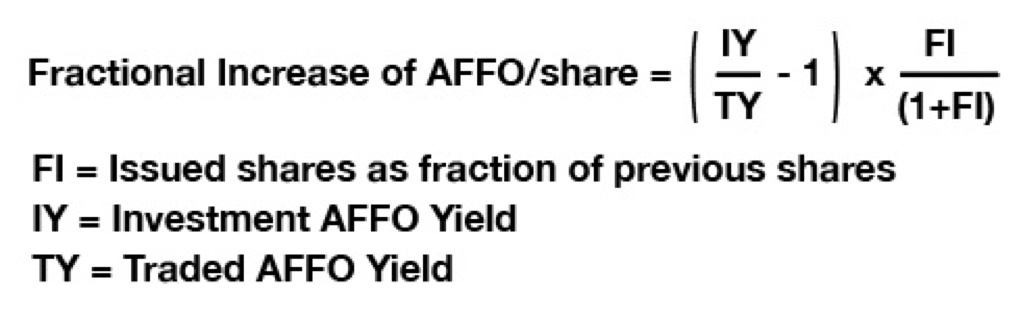
What is notable here is that issuing shares is accretive if the Investment AFFO Yield exceeds the Traded AFFO Yield. That is the only requirement.
It is also notable that the spread between these two yields is not what matters. Their absolute value also does not matter. What matters is their ratio. We will see how this plays out below.
Including Internal Growth
It is also simple to include internal growth, from rent increases and from investing retained funds. That increased income is also diluted by the share issuance.
To find the total increase of AFFO/share, one just adds the fractional internal growth to the total AFFO on the line shaded yellow above.
Here is how this plays out by adding 4% internal growth of AFFO to the above discrete example:
Growth including internal growth Author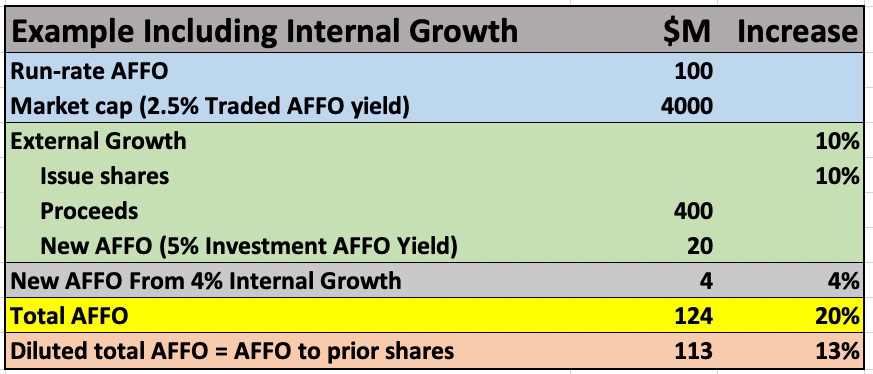
Here the section shaded green evaluates the addition to AFFO from external growth, just as in the above example. The row shaded gray shows the addition to AFFO from internal growth. The row shaded yellow shows the new total AFFO including both internal and external growth. The bottom row shows the diluted total AFFO that can be attributed to prior shareholders.
We can also include internal growth in the mathematical expression for this calculation, as follows:
Equation for AFFO/sh growth including internal growth Author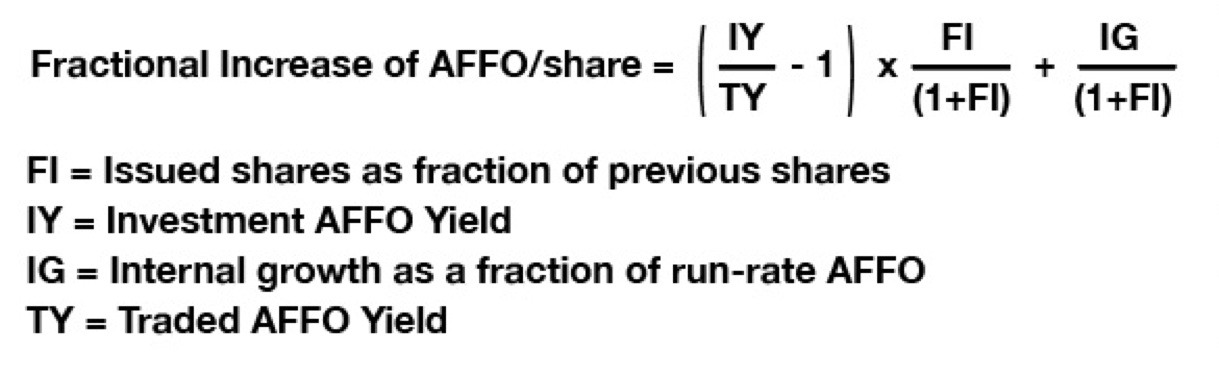
The accretion could be positive even when the Investment AFFO Yield is less than the Traded AFFO Yield, thanks to the internal growth. But, in that case, there would be little point in issuing shares because the net impact would be to reduce the growth.
It may be helpful to see this relationship on a contour plot. This is shown here for an internal growth rate of 4% and a share issuance of 10%.
Growth contour plot against Investment and Traded AFFO Yields Author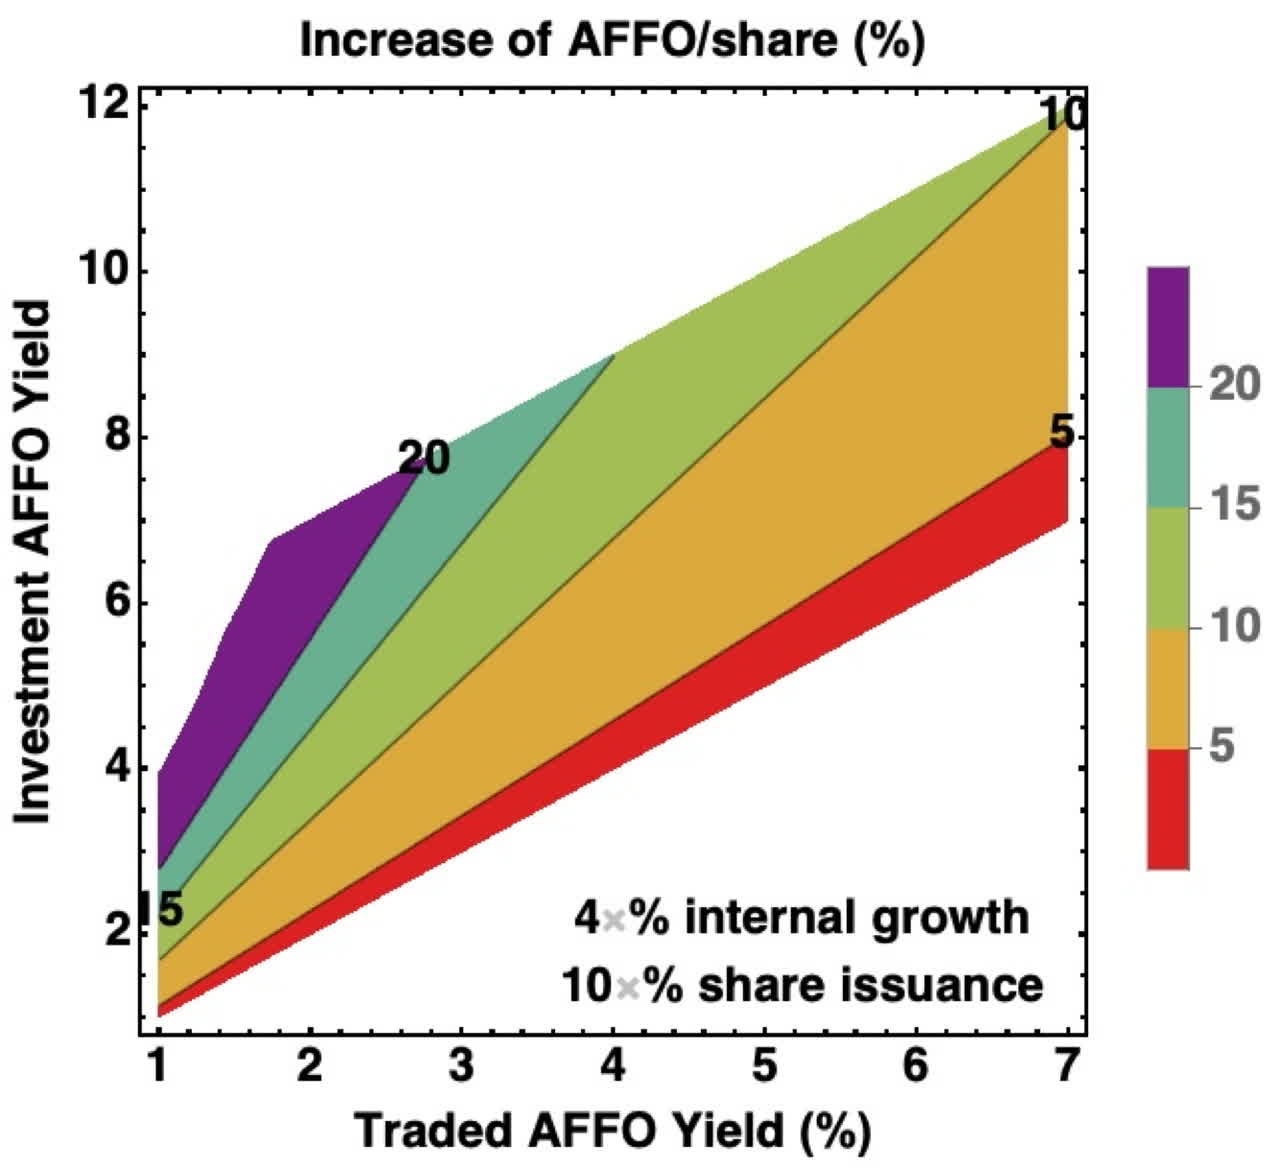
The shaded band shows Investment AFFO Yields from the Traded Yield to 5% more than that. The colors show regions where the rate of increase of AFFO/share lies between the values shown on the labeled contours.
It is worth noting that 10% is a fairly large rate of share issuance for any established REIT, though some REITs issue more than that. Many REITs could not keep up with the acquisition or development activity that would be needed to absorb that much capital. Those that issue less will obviously grow at smaller rates than would be implied by this chart.
Quite a few REITS are not far from the contour showing a 10% increase of AFFO/share for 10% share issuance combined with 4% internal growth. Roughly speaking, this means they are generating 6% AFFO/share growth externally.
Here are three examples that span the range, approximating the internal growth at 4% in each case. The internal growth is actually a bit larger for STOR and a bit smaller for WPC.
REIT | Traded Yield | Investment Yield | Implied Growth |
STOR | 5.7% | 10% | 10.5% |
WPC | 5.8% | 8.8% | 8.3% |
SUI | 4.0% | 6% | 8.2% |
CPT | 2.7% | 5.5% | 13.1% |
STOR and SUI both have a history of issuing shares at near a 10% rate. CPT has not issued nearly that many. With their current high valuation, it would be very accretive to ramp up their development activity. WPC has been in transition, leaving it unclear what their rate of share issuance will be going forward. (Links are to relevant articles by me.)
Of course, most REITs do not manage 10% AFFO/share growth. Few can grow their assets fast enough to sustain a 10% rate of share issuance and maintain portfolio quality. Some of them have weaker internal growth. And some of them do not have a high enough Investment AFFO Yield.
Evidently, what you need to know to understand whether issuing shares is accretive is the Investment AFFO Yield. That is straightforward.
What Investment AFFO Yield Is
Chris Volk’s V-formula lets one calculate the yield produced when a REIT invests new equity. We can write it like this:
Formula for Investment AFFO Yield Author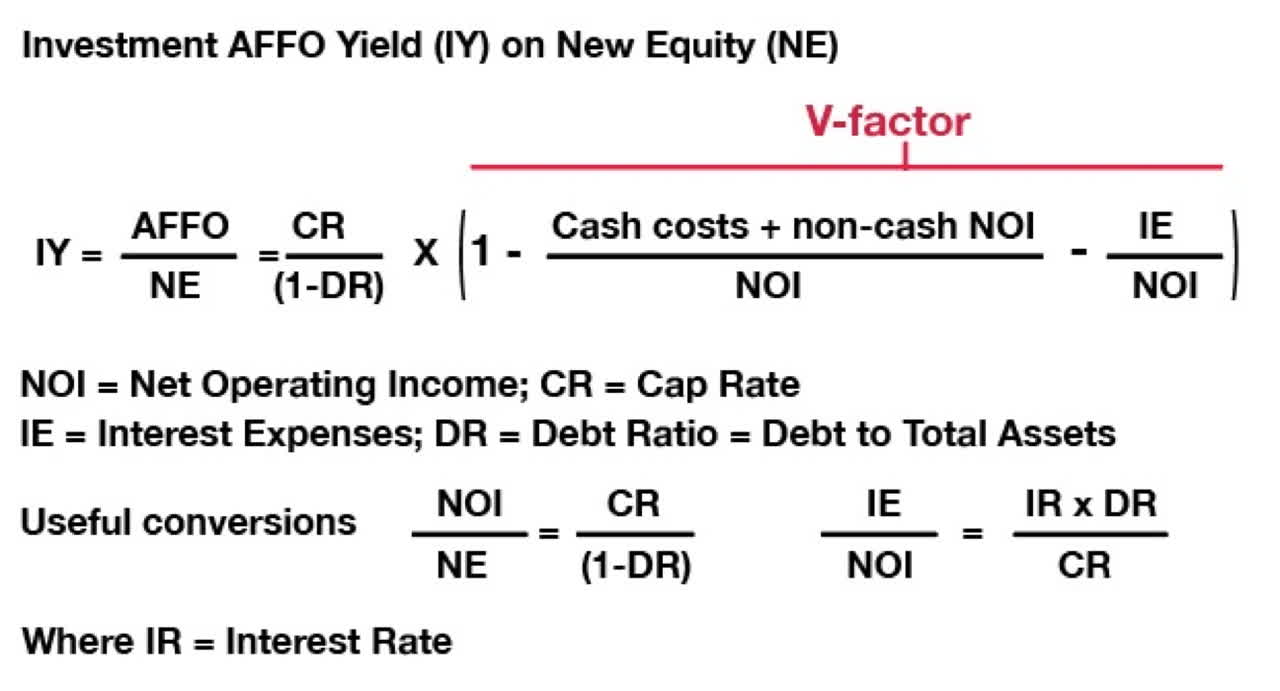
The cash costs include General & Administrative (“G&A”) costs, recurring capex, and anything else. If there is preferred stock and one wants the yield to common, one must include their dividends too as cash costs.
Here the cap rate (“CR”) is the cap rate for new property purchased or developed with the new equity. REITs typically have a target amount of leverage and seek to invest over time in leverage-neutral ways. They tell you what that leverage is, which gives you the Debt Ratio.
If what you have is a cash cap rate, which is likely for new property and for development, then you need not worry about the non-cash contributions to NOI. When analyzing an entire REIT, those can become quite significant.
Suppose the interest rate is 3%, the cap rate for new properties is 5%, and the Debt Ratio is 33%, all of which are common values. Then, the interest expenses are 20% of NOI. These are the tail, not the dog, when it comes to profitability.
The ratio of AFFO to NOI is what is labeled above as the V-factor. For cash NOI, it varies from above 70% for some triple-net lease REITs to below 60% for some REITs with lots of recurring capex.
If you are a math person and look at the V-formula, you can see two things. 1. The primary determinant of investment yield is the cap rate. 2. Larger Debt Ratios create more profits. Larger cap rates and debt also, of course, may add risk.
Using the numbers from the earlier paragraph, and a V-factor of 60%, one finds an Investment AFFO Yield of 4.5%. Here are three other cases shown in a table:
Examples of Investment AFFO Yield Author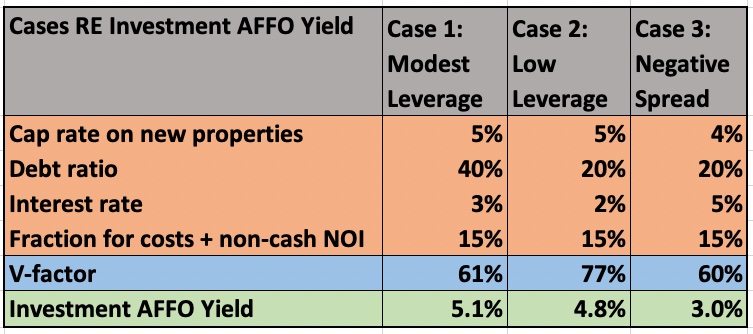
The first two cases shown are not atypical for blue-chip REITs today. Some REITs do worse and some do better, depending mainly on the cap rate.
An interesting case is shown as Case 3. Here there is a negative spread, with the cap rate of 4% below the 5% interest rate. Yet the investment is still profitable.
The punch line is that one does not have to know anything about NAV, or WACC (weighted average cost of capital), or (cap rate to interest rate) spreads to evaluate the growth of AFFO. For Case 3, if the Traded AFFO Yield were 2.5%, selling shares and investing the proceeds would still turn out to increase AFFO/share.
One note: The analysis shared here has ignored details regarding the treatment of stock-based compensation. That is a small effect and also a topic for another day.
Evaluating Investment AFFO Yield
For new property where you have a cash cap rate, it is not hard to put together the numbers needed.
From the Income Statement, you can find the G&A costs and evaluate the NOI. From the Balance Sheet and/or from company presentations, you can find the Debt Ratio.
From SEC filings (or often from presentations or earnings calls) you can find the Interest Rate for new debt. And you can find the cap rate from presentations or earnings calls.
How Many Shares to Issue?
Investors tend to talk of share issuance as though it is a completely independent knob. The REIT can just do it in any amount at any time.
The reality is different, though. It takes time to develop an investment pipeline. One cannot just pick up the phone and order good investments like ordering pizza from Domino's.
In addition, it takes people both to manage an investment pipeline and to manage properties. Developing a team of people takes a lot of time, and adding people is a slow process.
One of the most important numbers you hear from any REIT is their guidance for acquisition and development spending net of dispositions. But this is not the amount of money they need to raise by selling shares.
You can estimate the needed equity from share sales as follows. First, the REIT will want to keep leverage constant. So, take the total guidance and subtract the fraction that corresponds to their Debt Ratio to get the amount of new capital needed.
Second, the REIT will first fund these costs with retained funds. The retained funds include retained cash from real estate operations, and any other funds available for investment.
A specific example of the latter is Equity Lifestyle (ELS). They generate 16% of NOI from ancillary earnings and use it plus retained earnings to drive growth.
So, evaluate retained funds and subtract it from the total new capital. What is left is what will have to be funded by share issuance.
The fraction of shares that must be issued is then the capital needed from share issuance divided by the Market Cap.
Summary of Calculation
To evaluate the rate of growth of AFFO/share a REIT will produce, you only need to know four numbers. These are
- The Traded AFFO Yield
- The Investment AFFO Yield
- The fraction of shares to be issued
- The rate of internal growth of AFFO
The market tells you the Traded AFFO Yield. To know the Investment AFFO Yield you need four numbers. These are
- The weighted average cap rate for acquisitions and development.
- The Debt Ratio
- The costs, as defined above, as a fraction of NOI.
- The interest expense as a fraction of NOI
To know the fraction of shares to be issued, you need three additional numbers. These are
- The Market Cap
- The guidance for net acquisition and development spending
- The retained funds
So, it takes only 11 numbers to get an excellent handle on how much a given REIT will grow AFFO/share.
A Cheaper Approximation
Most likely, you are not a REIT geek like me. So, you may find a shortcut more useful.
You can take a first cut at the outcome more simply, as follows.
- Approximate the Traded AFFO Yield as 1.25 times the dividend yield. The factor of 1.25 is accurate to about 10% and corresponds to an 80% AFFO payout ratio.
- Approximate the Investment AFFO Yield as the cap rate mentioned in an earnings call. (The other factors in the V-formula often net out close to 1.)
- Estimate the share issuance based on history.
- Estimate the rate of internal growth as 4%.
- Plug these numbers into this formula discussed further above:
Formula for growth of AFFO/share Author
The Best Easy Metric
Qualitatively, what drives the rate of growth is the ratio of yields. This ratio is primarily determined by the ratio of cap rate to Traded AFFO Yield. The easily found related number is the ratio of cap rate to dividend yield. This ratio is a better metric than any absolute numbers or any spread to indicate rate of earnings growth. The higher the better.
Examples of REIT stocks very attractive today by this metric, at opposite ends of the range of dividend yields, are STOR and Invitation Homes (INVH). INVH had not been on my radar; this research has put it there.
Two examples of REITs that are not attractive by this metric are these apartment REITs: BRT Apartments (BRT) and Washington Real Estate (WRE). Both pay a dividend yield above 4% in a sector where cap rates are often pushing into the 4s or even lower. They probably cannot grow AFFO without diluting their shareholders.
I hope to produce another article to compare and contrast the approach discussed here with other ways of thinking about REIT growth.
Do Your Due Diligence
A REIT that looks great by the calculation here may or may not be the investment you want. Consider their level of debt, their liquidity, and their management of their debt maturity ladder.
If the REIT gets relatively high cap rates, examine how they approach reducing the associated risks. If they get low cap rates, consider how frothy the markets they play in are and whether they could stay profitable with more cap rate compression.
In addition, high growth is not the only reason to buy a REIT. Your personal circumstances may lead you to care more about income. Nothing wrong with that, so long as the payout is sustainable and the REIT is otherwise healthy.
The Core Portfolio at High Yield Landlord emphasizes finding undervalued REIT stocks with significant and sustainable dividends. STOR is a large holding. In my personal portfolio, though, I hold some REIT stocks paying lower dividends and oriented toward high growth. We discuss all of these and others in our chat room.
If you want access to our entire Portfolio and all our current Top Picks, feel free to join us for a 2-week free trial at High Yield Landlord.
We are the largest real estate investment community on Seeking Alpha with over 2,000 members on board and a perfect 5/5 rating from 400+ reviews:
![]()
For a Limited Time - You can join us at a deeply reduced rate!
Start Your 2-Week Free Trial Today!