
Igor Kutyaev/iStock via Getty Images
Flow Traders (FLTDF) stock tanked at every investor update in 2021 as the company did not meet shareholders’ expectations. On top of this the dividend payout was reduced to finance growth. In spite of this the outlook for the company has improved as it is expanding the business and high inflation forces central banks to raise rates thereby raising the general level of volatility. When the stock continues the recent downward trajectory to levels below €27 or if the VIX index will spike materially, this stock may present an interesting opportunity.
Financing growth
The Flow Traders results presentation on the 10th of February was rather brief but contained enough information to tank the stock by nearly 10%. The gist of the communiqué was that the company is focusing on growth and therefore reduces the dividend payout ratio.
By the end of 2020, Flow Traders had 554 FTE in the payroll, a number which had increased to 613 on the 31st of December 2021. This growth is required as the company is expanding ‘market making capabilities in fixed income, crypto, FX and precious metals’. On the back of growth, the company proposed a final dividend of €0.35, with the total for 2021 becoming €1.35. Since the company got listed, the dividend pay-out ratio ranged from 63 to 78 percent, but has now been revised downward to 51%.
After the Q3 2021 trading update, the stock steadily climbed from a low of EUR 28.92 to a level of EUR 35.64 just prior the Q4 results presentation. Needless to say many investors were disappointed learning that the increased volatility in the final quarter of 2021 did not materialize in a higher dividend and consequently dumped the stock.
Hopes up, stock down
This trend of investors moving the stock higher in anticipation of the next trading update has been a recurring theme in 2021, see figure 1. The figure shows the volatility (red), the stock price (blue) and the dates of the trading update for each quarter. During each of the trading updates, the stock moved sharply lower at the same day, or briefly thereafter. The company has not been able to live up to the expectation of investors which is easily explained as 2020 was a stellar year which was very unlikely to be repeated.
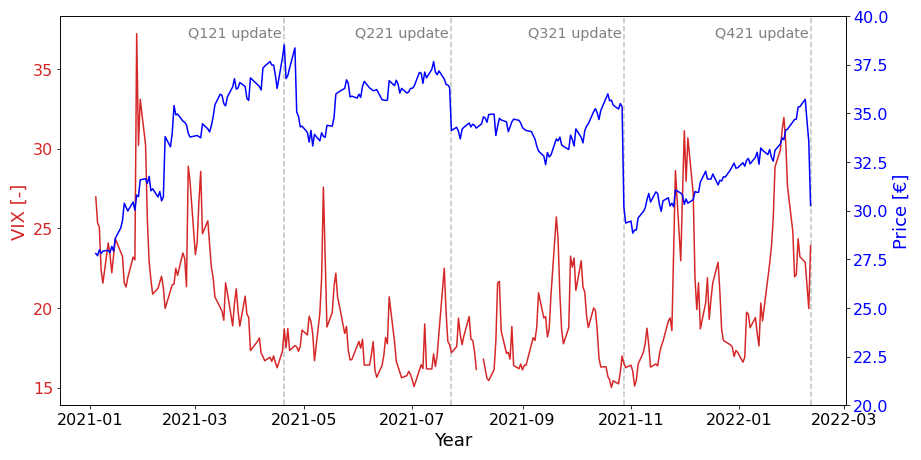
Figure 1 - Volatility, stock price and trading updates (Yahoo finance, Flow Traders, chart by author)
What drives earnings?
Given the sharp declines in stock price following each quarterly trading update, it seems many investors do not entirely understand how volatility is tied to the earnings of this company. The reasoning that elevated levels of volatility automatically translate into higher earnings requires some nuance. The next three graphs visualize why increased volatility does not necessarily lead to higher earnings.
The first graph (figure 2) shows how the actual VIX is correlated to the average VIX per quarter. The VIX averaged over a quarter gives a sense of how volatile markets have been. In this respect Q1 and Q2 2020 have been highlighted to show what happened when the pandemic started. In March 2020 there was a huge spike in volatility which raised the average for the entire quarter to a high level. Nevertheless, the graph clearly shows that Q2 2020 was more volatile on average.
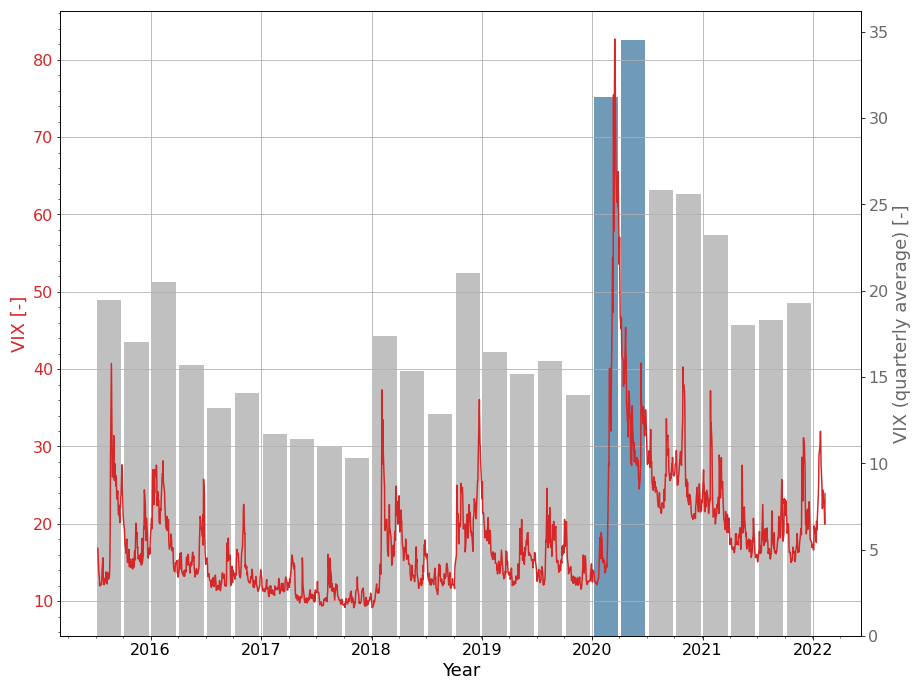
Figure 2 - Correlation between VIX and VIX (quarterly averaged) (Yahoo Finance, Flow Traders, chart by author)
Although the initial scare of the pandemic eased in Q2 2020 and the VIX stayed below 50 after April 3rd, there was still some heavy trading going on which made the second quarter more volatile on average. Traders and investors rightfully perceived the second quarter as more volatile, yet this did not translate into higher earnings compared to Q1 2020, see figure 3.
Again H1 2020 has been highlighted in blue to show that earnings per share in Q2 were actually much lower than in Q1, in spite of the average volatility (red dots) in Q2 being higher. The point is that the average volatility in a quarter is not what drives earnings for Flow Traders. This may go against ones gut-feeling, but this is one of those instances where perception differs from reality.
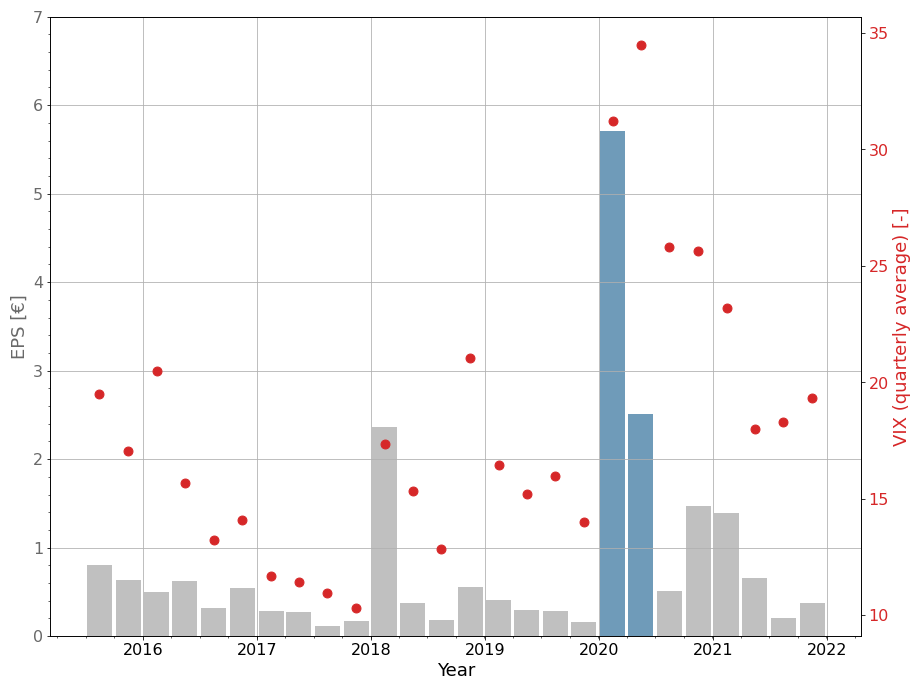
Figure 3 - Volatility (quarterly average) versus earnings per share (Yahoo Finance, Flow Traders, chart by author)
The disconnect is explained by the fact that during times of high volatility there is not only an increased amount of trades but the spread between buyers and sellers is also larger. This implies that an increase in volatility has an exponential effect on the earnings.
What also follows from the previous two figures is that the absolute level of volatility is more important than the relative volatility, or in this case the quarterly average. Although the second quarter may have felt more volatile (relative), more money was made when volatility briefly spiked to a level over 80 (absolute) in the first quarter.
This exponential relation between earnings and VIX becomes clear when the two are plotted against each other, see figure 4. In this figure the maximum volatility measured during a quarter is plotted against the earnings per share for each quarter. Only one single volatility value per quarter is used as the maximum (absolute) is more representative for earnings than the quarterly average (relative).

Figure 4 - Maximum quarterly volatility versus earnings per share (Yahoo Finance, Flow Traders, chart by author)
The trendline (red) in figure 4 shows the relation between VIX and EPS indeed is non-linear. At the same time it should be realized the trendline is not a perfect correlation. Many arguments could be raised why this representation isn’t flawless and proof is given in figure 5. The VIX spike in Q4 2018 did not have the same effect on earnings as the spike in Q1 of the same year.
The key-take away of the trendline in figure 4 however is that investors should not expect potential outsized returns when the VIX is elevated, or stays elevated for a significant amount of time. Instead, one should only look at the absolute level of the VIX. Chances of high returns materially increase when the VIX spikes above a level of 37, depicted by the grey line in figure 4. When this level is not reached, there is little reason to frantically buy this stock in anticipation of significantly higher earnings.
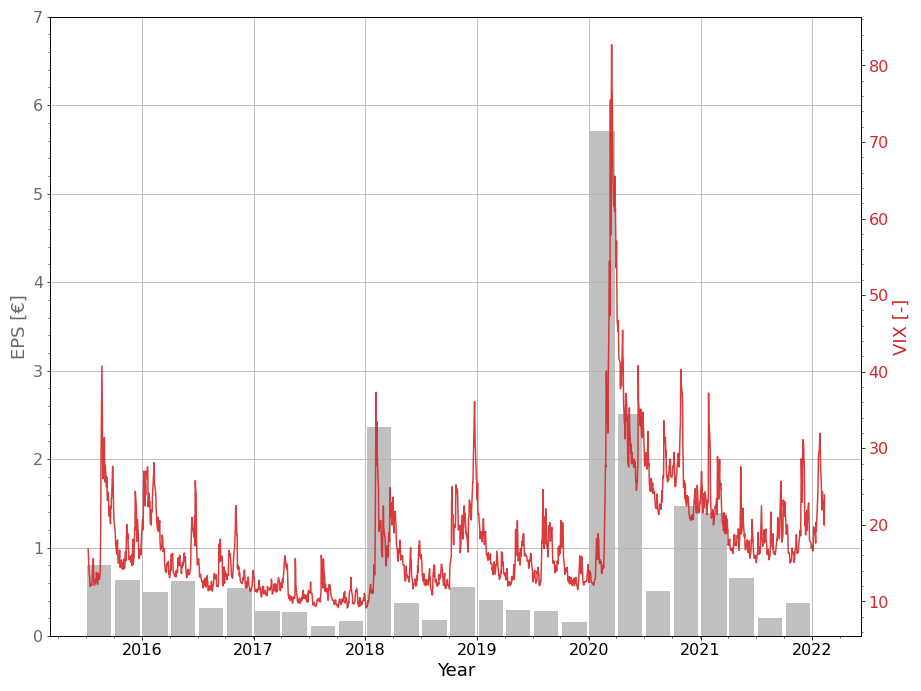
Figure 5 - VIX versus EPS (Yahoo Finance, Flow Traders, chart by author)
Central banks driving volatility
In November 2021 Fed chair Jerome Powell was ready to retire the word ‘transitory’, and only 3 months later the question is not when the Fed will start to hike interest rates, but rather by how much. Obviously a lot has changed with US inflation rising to the highest level in 40 years, as prices increased by a staggering 7.5% in January.
Pressure is building for the FED to act, with the possibility of a ‘ big-bang’ 50-basepoints hike in March. On the other hand:
The Fed is leery of spooking financial markets, which have required diligent handholding in recent years to avoid a knee-jerk tightening of financial conditions and repeats of episodes like the 2013 "taper tantrum," which was widely seen as a communications misstep.
Whether it will be a 25 or 50 bps hike in March, it will be pointed out the Fed is behind the curve fueling speculation about the next step. That said, the Federal Reserve presents a relatively clear path when compared to their European counterpart.
In August 2021 the ECB updated the monetary policy strategy:
In support of its symmetric two per cent inflation target and in line with its monetary policy strategy, the Governing Council expects the key ECB interest rates to remain at their present or lower levels until it sees inflation reaching two per cent well ahead of the end of its projection horizon and durably for the rest of the projection horizon, and it judges that realised progress in underlying inflation is sufficiently advanced to be consistent with inflation stabilising at two per cent over the medium term. This may also imply a transitory period in which inflation is moderately above target.
In the remainder of the press release this statement is dissected into several parts, but the most interesting may be the following:
Finally, the sentence that the forward guidance “may also imply a transitory period in which inflation is moderately above target” makes explicit that rate forward guidance that is committed to avoiding premature tightening may imply that inflation runs moderately above the target for a temporary period.
Some readers may remember the ECB tightened too prematurely in 2011, which prompted Mario Draghi to deliver the famous ‘whatever it takes’ remark. This situation perfectly explains why the ECB chose to specifically mention the word ‘premature’ in its guidance. The mere fact there is fear of repeating past mistakes, creates a perfect setup for a policy which will be behind the curve.
To complicate matters the European Union is actually very little of a union when it comes to financing of governments. This becomes painfully clear when the rates on government bonds for the different member states are compared, such as the spread between Italian and German bonds. Still, the European Central bank determines policy for the entire bloc and as a result the governors of the different national central banks, who are also on the Governing Council of the ECB which sets the rates, are constantly reaching out to the media to offer their opposing views.
Effectively we now have policymakers creating an environment of elevated volatility. Although the case has just been made that elevated volatility does not translate into higher returns by definition, the likelihood of the VIX spiking above the ’37-threshold’ is higher in such an environment, not to mention the potential effect of current geopolitical tensions. On top of this there is an entire generation of investors who simply haven't experienced the behavior of markets when not supported by a low interest rate policy.
Valuation
In my previous coverage of FLTDF I noted one should not invest in this company for the gains in stock price. Instead this company is to be considered a dividend stock. After the latest quarterly update it appears investors hoping to make a quick buck are finally capitulating as earnings remain subdued compared to 2020.
Obviously the company makes more money when volatility is higher, but in the end it remains a business like any other. Exxon (XOM) for example also makes more money when the oil price is higher, the only difference is that volatility is the oil of Flow Traders.
If all the noise is filtered, FLTDF is just a business that wants to grow earnings and subsequently distributes a part of these earnings to shareholders. In times of high earnings a ‘special dividend’ is paid after which it reverts to the mean as visualized in figure 6.
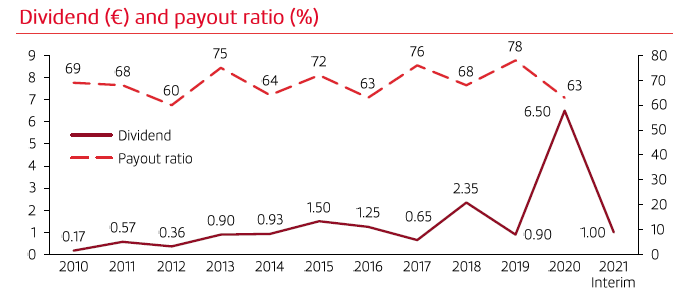
Figure 6 - Dividend and payout ratio (Flow Traders)
It should be noted this figure is outdated as the 2021 total dividend amounted to €1.35 and the pay-out ratio was 51%. More importantly however, even with this lower pay-out ratio, the general trend of dividend per share is pointing upward.
The ability to simultaneously grow the amount of employees, lower the pay-out ratio and still distribute a dividend which aligns with the long term upward trend, while volatility was modest in 2021, is a clear sign management is diligently working on a long term plan to grow the business while remaining committed to its shareholders.
Conclusion
For Flow Traders 2021 has been a relative uneventful year. This has affected earnings leading to sharp declines in stock price at the quarterly trading updates.
In spite of this the outlook for the company has improved. The reduction in payout ratio for example was done to finance growth which should benefit shareholders over the long term. The growth plans indicate Flow Traders is expanding into fixed income, crypto, FX and precious metals. Areas in which the specialism of this company can be put to good use.
Additionally high inflation has prompted central banks to take action and as a consequence volatility has risen over the past months. While this by itself is not sufficient to generate elevated returns, the likelihood has increased especially given current affairs in geopolitics.
Although the outlook is improving, I am not yet bullish on this company. Nevertheless, as the company is trading on the Amsterdam mid-cap index ((AMX)) I’ve initiated a small position to keep better track of it. When the stock continues the recent downward trajectory to levels below €27 or if the VIX index will spike materially above the 37-threshold, I will consider expanding this position to a meaningful holding in my portfolio.