hanibaram
Investment Thesis
Last week, I reviewed the Invesco S&P 500 High Dividend Low Volatility ETF (SPHD), concluding that its 4.25% estimated dividend yield was attractive for income investors. Still, all other investors should avoid it due to its poor growth and profitability features. Today, I want to review another fund with a similar name: the Franklin U.S. Low Volatility High Dividend ETF (NASDAQ:LVHD). LVHD will yield a respectable 3.50% but may appeal more to investors than SPHD because it prioritizes the low volatility factor by overweighting defensive sectors like Consumer Staples and Utilities.
Unfortunately, LVHD still suffers from the same low growth problems as SPHD, which will cause it to underperform in bull markets significantly. Furthermore, LVHD's lower starting yield means investors will have to wait approximately 16 years to achieve a yield on cost the same as SPHD. While I have a more positive view of LVHD than I did previously, these types of ETFs are not for me; therefore, I have rated it a hold. I look forward to discussing why in greater detail next.
ETF Overview
Strategy Discussion
LVHD tracks the QS Low Volatility High Dividend Index, selecting 50-100 U.S. companies from the Solactive U.S. Broad Market Index, a broad Index of 3,000 stocks across all size segments. QS screens for profitable companies that have the potential to pay relatively high sustainable dividend yields based on a proprietary methodology. Final selections are determined based on the attractiveness of their price and earnings volatility. To improve diversification, the Index limits individual components to a 2.5% weighting, sectors to 25%, and REITs to 15%. Reconstitutions occur annually, and the Index rebalances to its target weightings quarterly.
SPHD appears to follow a similar strategy, though its methodology is transparent. One consistent theme is that SPHD offers a higher dividend yield, while LVHD is much less volatile. I will highlight these metrics, among others, shortly in my fundamental analysis of the two ETFs.
Sector Exposures and Top Holdings
One thing that LVHD and SPHD have in common is that they both overweight defensive sectors like Consumer Staples and Utilities. However, LVHD's total exposure to these sectors is 45.82%, and SPHD's is 32.47%. Meanwhile, a broad-based portfolio like the SPDR S&P 500 ETF (SPY) has 9.98%. Investing in these sectors is an easy way to reduce your portfolio's volatility.
Morningstar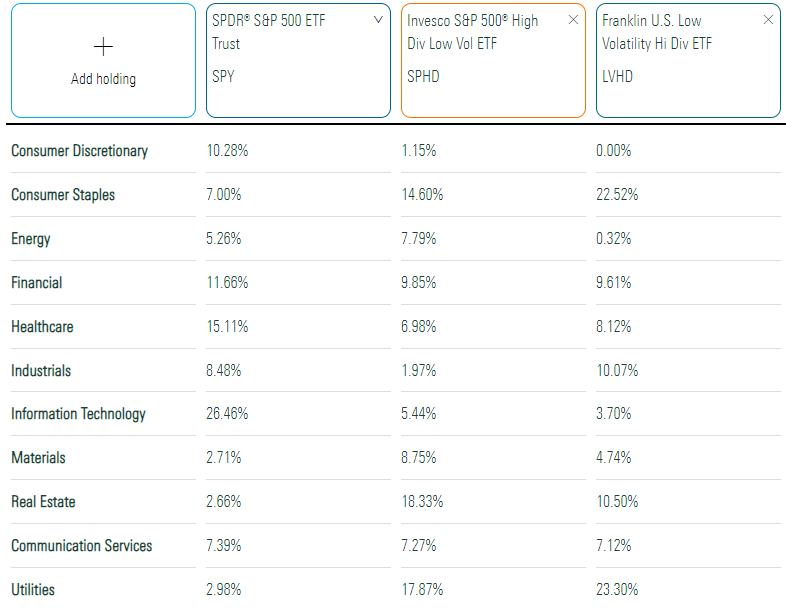
This table illustrates how LVHD is less diversified than SPHD, despite having twice the number of holdings. Also, there's minimal exposure to Energy stocks, which may be problematic if inflation remains high.
LVHD's top ten holdings, totaling 25.92%, are listed below. They include Gilead Sciences (GILD), Air Products and Chemicals (APD), and Philip Morris (PM). These holdings provide some insight into the Index methodology because they're primarily large-cap companies, indicating that size is a likely factor. Recall how selecting companies with sustainable future dividend payments is one key objective. Large-cap companies are generally in a much better position to do so because they're much more profitable.
Franklin Templeton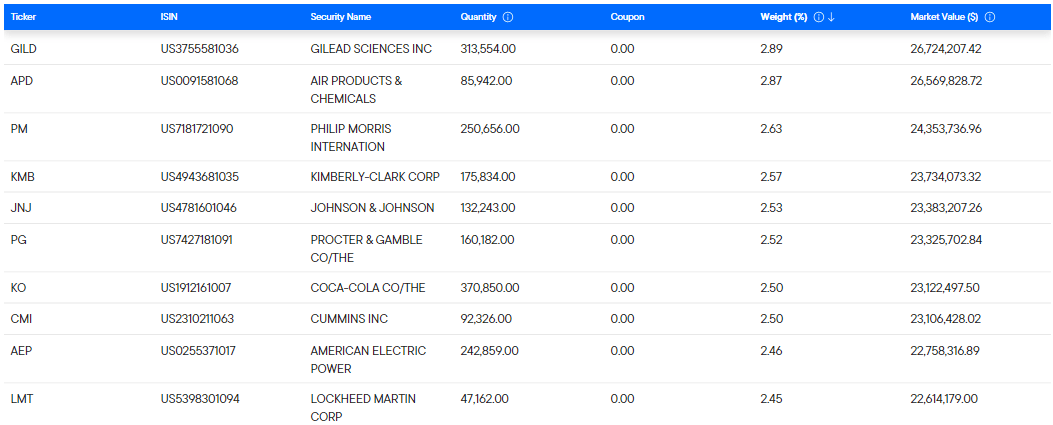
Performance Analysis
Low Volatility ETFs vs. The Broad Market
LVHD launched on December 28, 2015, so its track record of how well it protects investors in market downturns is limited. In a previous article, I noted how terrible it performed after the pandemic. Like most low-volatile ETFs, LVHD only modestly performed better in the Q1 2020 drawdown, then significantly lagged the broader market during the rebound. Unfortunately, unless you had impeccable timing, you likely came out behind, and that's my warning for low-volatility ETFs in general. They may be a good temporary solution but often don't work when held for extended periods.
To illustrate, I've analyzed how 30 low-volatility ETFs performed vs. the SPY over the five most significant drawdowns in the last decade. I've matched up the length of the drawdown with the subsequent recovery period to be as fair as possible. For example, the market's second-most significant drawdown lasted three months from January - March 2020. Therefore, the recovery period measured was also three months, from April - June 2020. The only exception is the most recent drawdown from January to September 2022, where the recovery includes only October's returns.
The Sunday Investor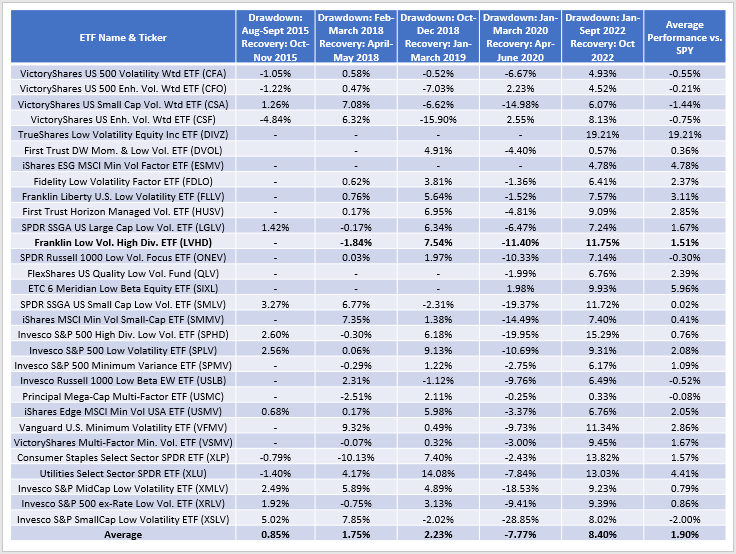
Low-volatility ETFs are a relatively new concept, with all these funds launching after the Great Financial Crisis. However, they outperformed SPY by 0.85% on average between August 2015 and November 2015. They also outperformed by 1.75% between February and May 2018 and 2.23% between October 2018 and March 2019. These are modest figures but provide some confidence if the holding period is limited. Notably, LVHD has outperformed SPY by 7.54% during that third drawdown, so it deserves some credit.
More recently, through the pandemic, investors lost confidence, with low-volatility ETFs underperforming by 7.77% on average between January and June 2020. The underperformance continued for the remainder of the year and most of 2021. For those two full years, LVHD lagged SPY by 28.95%. Low volatile stocks weren't nearly as popular as so-called "pandemic stocks" like Amazon (AMZN), and investors would have been much better off just doing nothing rather than searching for protection.
Through October 2022, low-volatility ETFs are outperforming SPY by 8.40% on average this year. However, consider how well the Utilities Select Sector ETF (XLU) is performing. XLU has outperformed SPY by 13.03% through October and 15.53% YTD through November 25.
LVHD Performance vs. SPHD
The following graph highlights how LVHD has gained an annualized 10.04% since January 2016 compared to 8.66% for SPHD. The reason is a much lower Q1 2020 drawdown (24.32% vs. 30.92%), leading to much better risk-adjusted returns (Sharpe and Sortino Ratios).
Portfolio Visualizer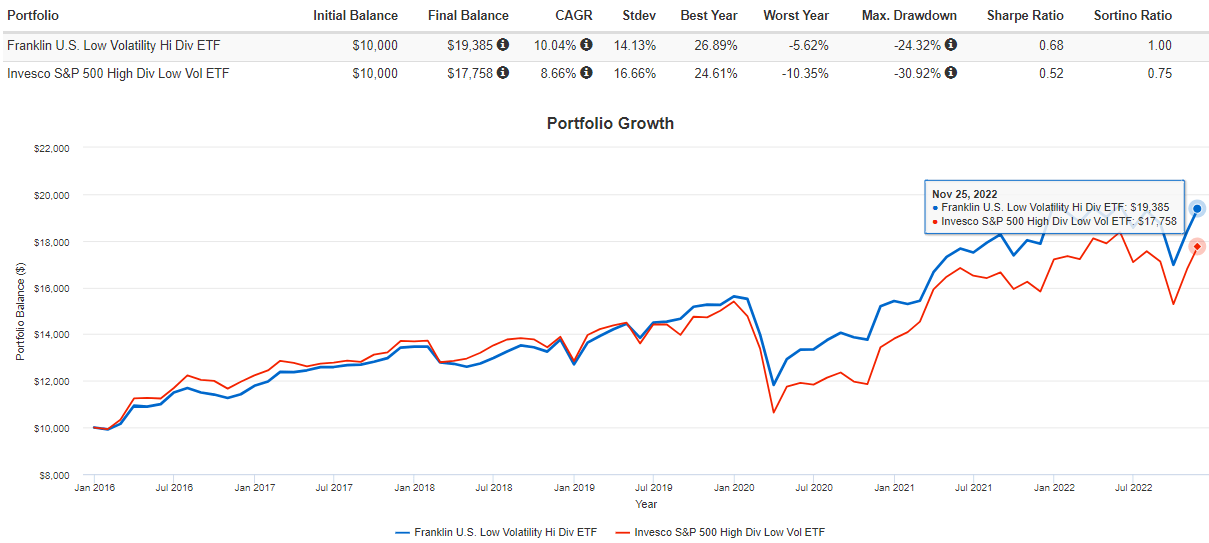
In exchange, LVHD's income was much lower. Based on an initial $10,000 investment in January 2016, LVHD's total portfolio income this year was $487, with all four quarterly dividend payments made. SPHD's YTD portfolio income of $604 is missing one monthly payment, so annualized, investors can expect $659 for the whole year. With the 2016 income levels listed below, LVHD and SPHD's six-year annualized dividend growth rate is 9.09% and 6.21%.
Portfolio Visualizer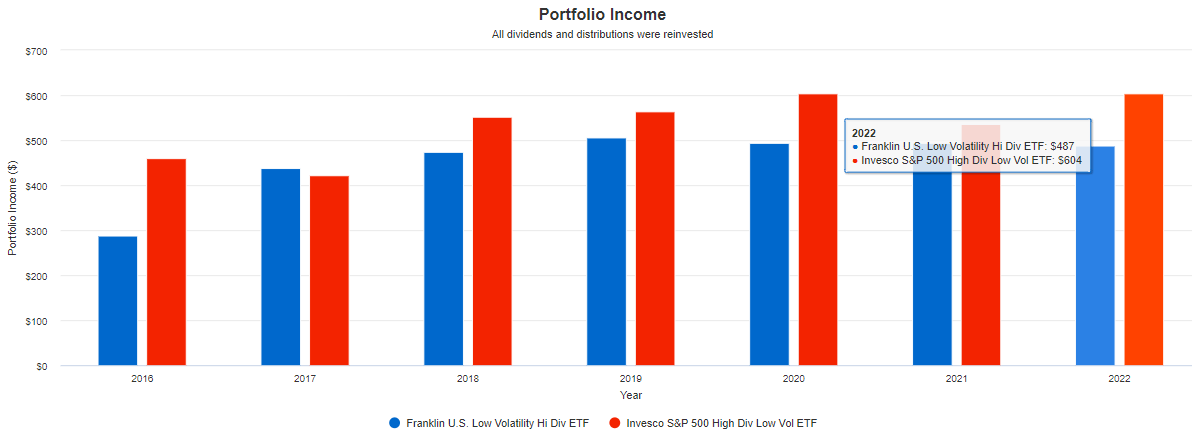
This chart illustrates the importance of a high starting yield for income investors. Even though LVHD has experienced better dividend growth, it will take about ten more years for the yield on costs to be the same at these growth rates.
Fundamental Analysis
Next, let's look at how LVHD, SPHD, and XLU compare based on their current fundamentals. I've included a variety of metrics in the table below, including their concentration, volatility (beta), dividends, growth, and valuation.
The Sunday Investor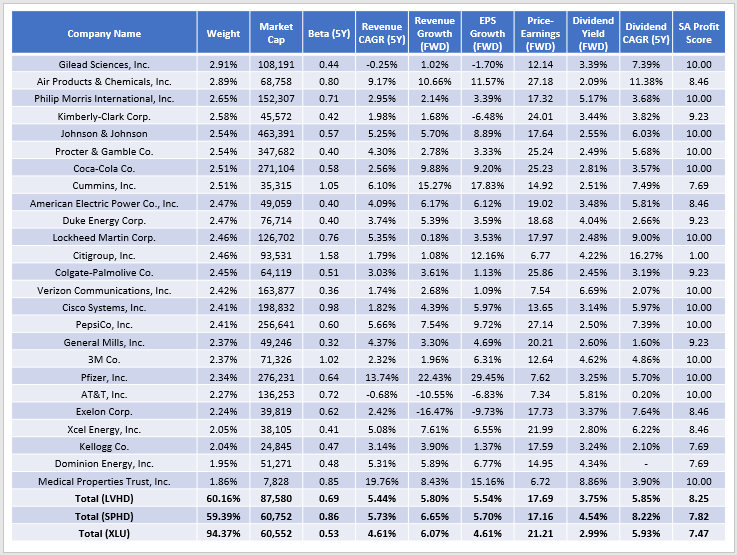
LVHD's five-year beta of 0.69 is much lower than SPHD's 0.86, and it's one of the lowest I've come across for a multi-sector ETF. However, its sales and earnings growth are low compared to SPHD. It trades at 17.69x forward earnings, has a 3.75% gross dividend yield (3.48% after fees), and its constituents have grown dividends by 5.85% per year over the last five years. Therefore, I expect future dividend growth to subside, and don't consider LVHD to be a stronger dividend growth ETF.
Initially, I hypothesized that a 50/50 split between SPHD and XLU would produce a superior portfolio than LVHD. However, the fundamentals don't support this strategy. While this portfolio would result in a near-identical five-year beta and dividend yield, LVHD still has the following:
- a better one-year estimated EPS growth rate (5.54% vs. 5.16%)
- a lower forward price-earnings ratio (17.69x vs. 19.19x)
- a higher profitability score (8.25/10 vs. 7.65/10)
These figures indicate LVHD deserves some credit, as it doesn't sacrifice as much on valuation and profitability. LVHD also experienced lower drawdowns and faster recoveries than my hypothetical 50/50 portfolio, as shown below.
Portfolio Visualizer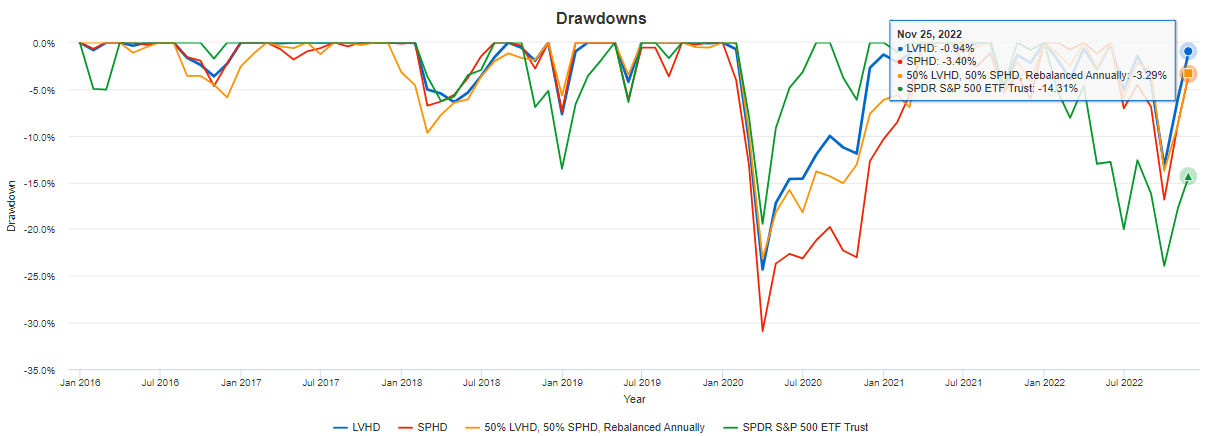
Still, low-volatility investors need to be prepared for underperformance if held for the long term. SPY has gained an annualized 12.29% since January 2016, 2.25% per year, better than LVHD. I don't like investing at the extremes, so I don't consider LVHD or SPHD appropriate core holdings.
Portfolio Visualizer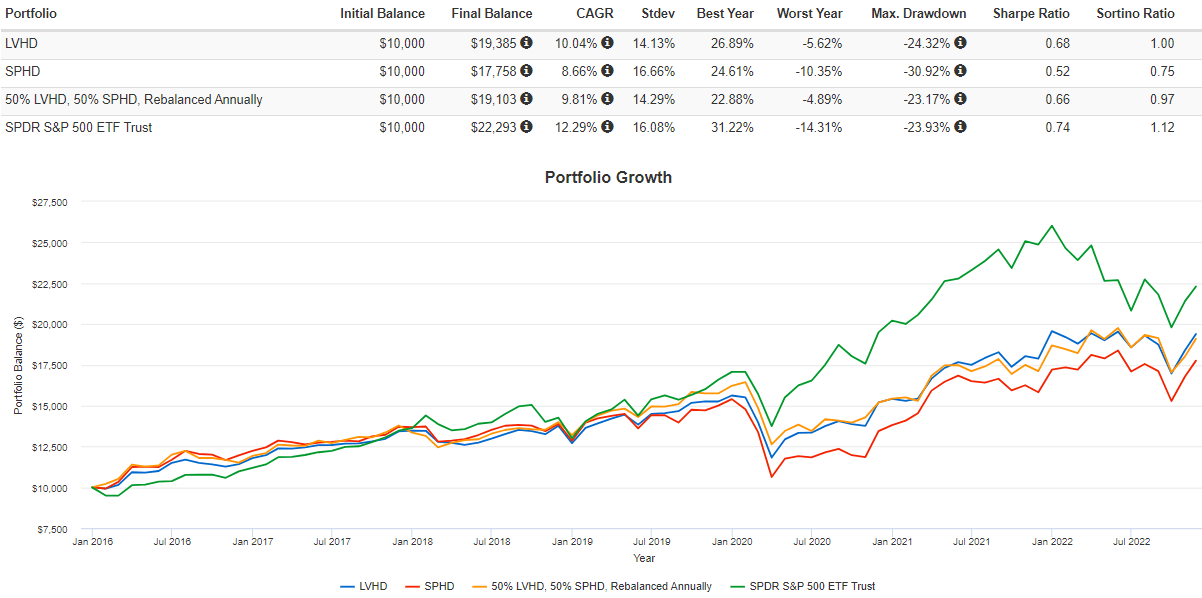
Investment Recommendation
In light of LVHD's strong performance during this year's more traditional crash, I am upgrading my rating to a hold from last year's sell rating. Today's portfolio is more defensive, reflected in its low 0.69 five-year beta. Still, I don't recommend holding LVHD for long. These ETFs often significantly underperform during market recoveries, and the drawdown outperformance isn't enough of an offset. One suggestion is to match the drawdown length with how long you hold it once the recovery begins to limit underperformance.
The critical areas of concern are LVHD's slow sales and earnings growth rates. These metrics strongly suggest significant underperformance in a bull market. This article also demonstrated how it would take an additional ten years since LVHD's inception (16 years in total) to match SPHD's yield on cost. Therefore, it's not the best product for income investors, and I view it as too extreme for my liking. Thank you for reading, and I look forward to answering any questions in the comments section below.
The Sunday Investor Joins Income Builder
The Sunday Investor has teamed up with Hoya Capital to launch the premier income-focused investing service on Seeking Alpha. Members receive complete early access to our articles along with exclusive income-focused model portfolios and a comprehensive suite of tools and models to help build sustainable portfolio income targeting premium dividend yields of up to 10%.
Whether your focus is High Yield or Dividend Growth, we’ve got you covered with actionable investment research focusing on real income-producing asset classes that offer potential diversification, monthly income, capital appreciation, and inflation hedging. Start A Free 2-Week Trial Today!