herkisi/iStock via Getty Images
The Invesco S&P SmallCap 600 Pure Value ETF (NYSEARCA:RZV) targets U.S. small-size pure-play value stocks while paying (almost) no attention to quality.
This is a maximalist approach based on the S&P SmallCap 600 Pure Value Index which allowed it to distill an appealingly priced mix with a phenomenal amount of stocks trading at a good discount to their respective sectors without using a multi-component overextended model. Of course, this has something to do with the size discount as the weighted-average market cap of RZV currently equals to just $1.26 billion, as per my calculations, with only 16% of the holdings technically being mid-caps (valued at over $2 billion).
How cheap is the RZV portfolio? This consumer discretionary (over 29%) and industrials (16.8%) heavy basket has about 71% of the net assets allocated to 99 stocks with a B- Seeking Alpha Quant Valuation grade and better (out of 150 currently present in the portfolio). Though this is a few percent lower than its mid-size equities-focused peer, the Invesco S&P MidCap 400 Pure Value ETF (RFV) had about a week ago, the level is still tremendously high compared to most large-size value blends I have dissected to date.
Digging deeper, M/I Homes, Inc. (MHO), an Ohio-based builder of single-family homes, is RZV's largest holding at the moment sporting 1.7% weight. Valued at ~$1.7 billion, MHO has an A+ Quant Valuation grade even despite its recent blockbuster rally; the stock surged by almost 23% in the last twelve months defying the bearish party on the Street.
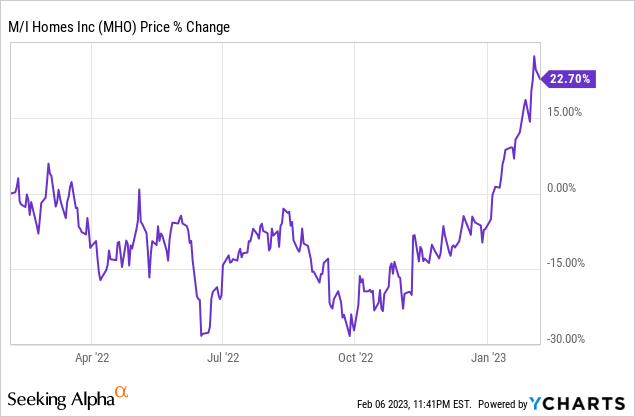
This is a value story I like.
Seeking Alpha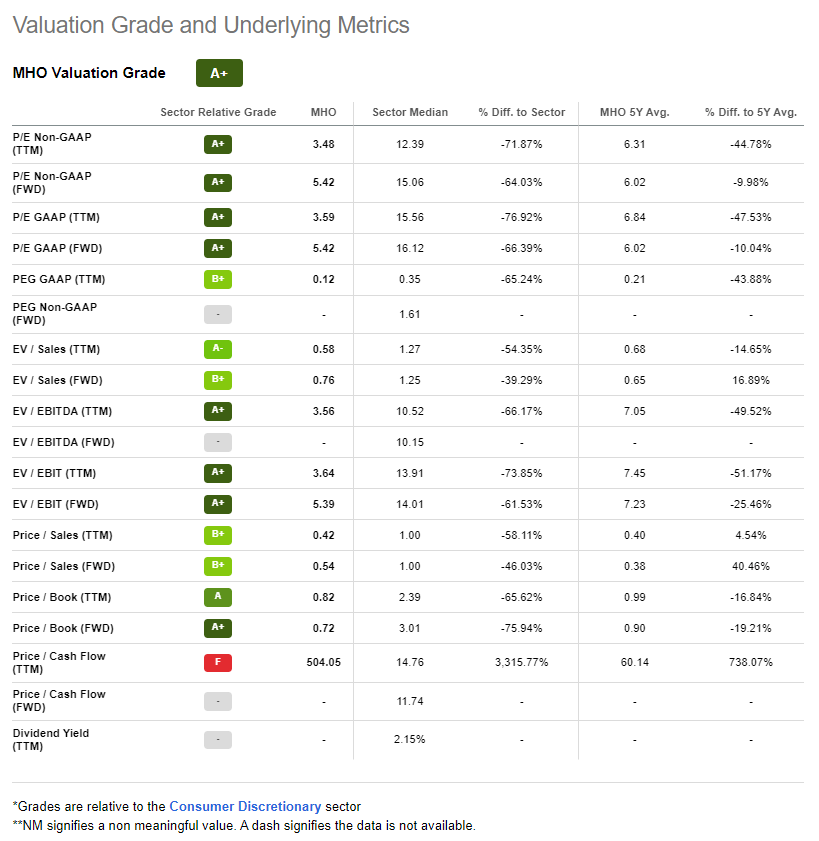
What I do not like is its working capital story being the key reason for a compressed net operating cash flow and sky-high P/Net CFFO ratio.
Now, what can RZV's earnings yield tell us? A necessary remark is that the ETF has a sizeable exposure to financials, close to 11%, so we have few choices when it comes to portfolio-wise metrics as the sector cannot be valued using cash-based ratios, with EBITDA also of no relevance. Long story short, my analysis showed that the weighted average stands at roughly 8% (an inverted 12.5x P/E), a solid level being more likely the consequence of the size, quality, and soft growth discounts. I believe the high-single-digit EY chimes well with the single-digit forward EPS and revenue growth rates (8.8% and 6.7%, as per my calculations). Just as a quick reminder, the S&P 500 index currently offers an EY of less than 4.9%.
To give a bit more color, the S&P SmallCap 600 Value Index, which is less dogmatic in its pursuit of cheaper companies than its pure-value analog, thus stocks with an overlap of growth and value characteristics can qualify for inclusion, has a P/E of around 12x, as per the data from the SPDR S&P 600 Small Cap Value ETF (SLYV).
For better context, the median EV/EBITDA multiples for each sector group of stocks (with real estate and financials removed) in its portfolio are juxtaposed with the sector medians I obtained from the Seeking Alpha Valuation Grade data are presented below, and they are telling.
Created using data from Seeking Alpha and the fund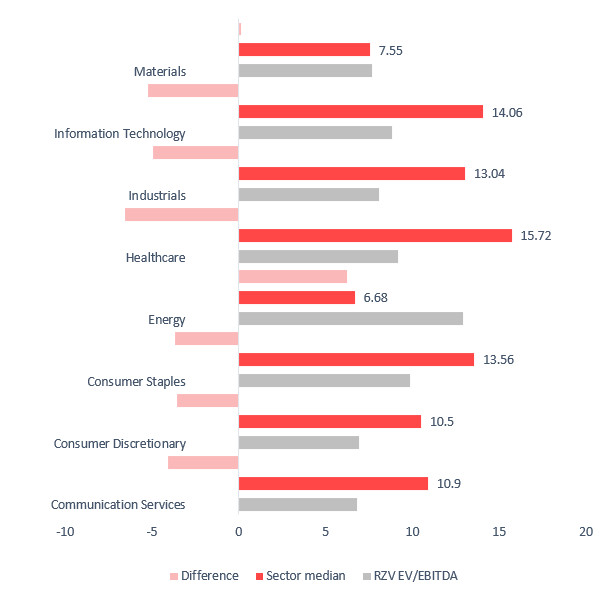
In almost all cases except for energy (surprisingly) and materials (a measly difference), RZV's median ratio is considerably lower.
Delving deeper, I decided to model the following scenario. If the fund had no exposure to the financial sector at all, with its weight (close to 11%) equally redistributed between the remaining 130 holdings, the weighted-average operating cash flow yield would be around 8.8%, which translates into a Price/Cash Flow ratio of only 11.4x. This is not a rock-bottom level, as there are sectors like energy where the median multiple is in single-digits, though still a solidly discounted one.
Quality: The risk of value traps percolating into the mix
RZV has significant exposure to companies with the bottom lines swamped with red ink. In essence, the S&P 600, the parent index, does not compromise on profitability precisely like its bellwether counterpart S&P 500, requiring candidates to deliver positive LTM net earnings, yet in reality, between reconstitutions, a solid deal of constituents might encounter any headwinds denting their net income, so the fact that 14% of the pure value ETF's net assets are invested in loss-making names is not surprising.
Regardless, as accounting profits tend to fluctuate, with headwinds at times having a one-off nature like write-downs in the oil & gas industry, a parameter I would focus on here instead is the share of stocks with a B- Quant Profitability grade and better since the grade relies on a composite of capital efficiency metrics like ROTC, margins, and cash metrics, which I believe is much more reliable that the net margin taken in isolation.
Unfortunately, less than 33% is a level too low and risky for my taste, especially considering that the problem is aggravated by ~23% of the holdings having a D- grade and lower, pointing to serious issues either regarding capital efficiency or margins or both.
As for the debt problem, more than 42% of the companies have the Debt/Equity above 100%, which is a precariously high level, especially in a scenario when interest rates do not go down as smoothly as some investors might be forecasting, and there are reasons for that.
Performance: A vigorous start to 2023 but bleak longer-term returns
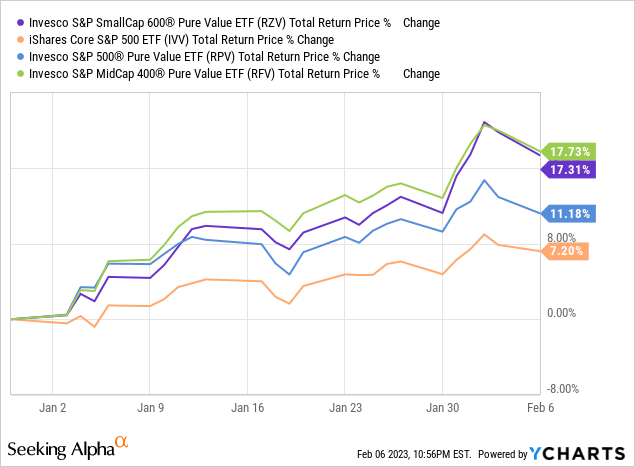
RZV has had a racy start to 2023, delivering a ~17.7% return and thus trouncing the Invesco S&P 500 Pure Value ETF (RPV) but marginally underperforming RFV. It has also beaten the iShares Core S&P 500 ETF (IVV), which is worth appreciating as RZV also outperformed IVV last year and in 2021, and by a solid margin.
However, longer-term returns are of course far from stellar, precisely as in the case of other value strategies.
Incepted in March 2006, RZV was incapable of beating the S&P 500 ETF during the April 2006 - January 2023 period, with the compound annual growth rate delivered being around 2.2% lower and with a harrowing standard deviation of over 30%. RFV and RPV did better.
| Portfolio | RZV | IVV | RFV | RPV |
| Initial Balance | $10,000 | $10,000 | $10,000 | $10,000 |
| Final Balance | $30,968 | $43,737 | $44,415 | $41,215 |
| CAGR | 6.95% | 9.16% | 9.26% | 8.78% |
| Stdev | 30.39% | 15.65% | 25.02% | 23.20% |
| Best Year | 62.67% | 32.30% | 59.74% | 53.51% |
| Worst Year | -41.16% | -37.02% | -43.01% | -47.79% |
| Max. Drawdown | -72.27% | -50.78% | -63.58% | -69.71% |
| Sharpe Ratio | 0.33 | 0.57 | 0.44 | 0.43 |
| Sortino Ratio | 0.52 | 0.83 | 0.65 | 0.64 |
| Market Correlation | 0.82 | 1 | 0.89 | 0.88 |
Created using data from Portfolio Visualizer
Regarding the standard deviation, this is a perennial problem for RZV; for example, the three- and five-year annualized figures stand at 36.6% and 33.2%, respectively.
Investor takeaway
RZV is a small-cap maximalist value fund with a smart-beta value score-weighted index relying on a composite based on book value, earnings, and sales multiples.
The main conclusion of today's note is that RZV is not for the faint-hearted. First, its volatility is simply painful. Regardless of the timeframe used, be it the one since its inception or the three-, five-, or even one-year based, the standard deviation tends to fluctuate in the low-to-mid-30s. Second, quality is something of a perennial concern owing to the size and value factors, so the risk of value/yield traps influencing its performance is not to be forgotten as the quality-agnostic approach could always backfire, especially in a scenario when the Fed does not pause the hawkish cycle anytime soon.
Certainly, RZV has comparatively large AUM of $360 million, adequate liquidity, and an apparently reasonable expense ratio of 35 bps. But this alone does not make the investment vehicle a Buy.