Pgiam/iStock via Getty Images
This article's primary focus is on Principal Financial Group, Inc. (NASDAQ:PFG)
Investment Thesis
Here we tell why Principal Financial Group, Inc. investors need Risk/Reward ratio comparisons in 2023 far more than Price/Earnings ratios in 2025.
Every investment involves a forecast of the future. Those forecasts must encompass the uncertainty of the future. The more future time is involved the larger the risk potential and the reward prospects. Both aspects should be compared to one another, and that balance accepted/rejected by the investor's need and purpose.
Sciences of nature in the world around us operate in terms of accepted, evidenced rules of outcomes. Everything else is happenstance, and involves uncertainty. Many natural uncertainties appear to relate to "variables".
When those variables themselves appear to lack forecast-able outcomes, as in investing, it often is because humans are involved. Humans, as sentient beings, are known to change their minds - and their rules of behavior.
That classifies such behaviors as "games" where "strategy" of behaviors becomes part of the game of "playing the players". Games like WAR and INVESTING.
The players with the most (and best) resources have the best prospects of winning the game's events. In the investing war, the advantage usually favors the institutions. They recognize that in the investing game the resources being invested are BOTH capital and time.
Because investing performance is measured over time (which cannot be replaced once spent) it needs respect when committed. Because uncertainty increases with time commitment, the astute investors are quick to adjust their strategies to recognize change.
This is why near-term price expectations need constant attention. Institutions have the resources to demand - and get - attention. They won't wait for 4 years to find out a mistake was made.
Description of Primary Investment Subject
"Principal Financial Group, Inc. provides retirement, asset management, and insurance products and services to businesses, individuals, and institutional clients worldwide. The company operates through Retirement and Income Solutions, Principal Global Investors, Principal International, and U.S. Insurance Solutions segments. The U.S. Insurance Solutions segment provides specialty benefits, such as group dental and vision insurance, group life insurance, and group and individual disability insurance, as well as administers group dental, disability, and vision benefits; and individual life insurance products comprising universal, variable universal, indexed universal, and term life insurance products in the United States. It also offers insurance solutions for small and medium-sized businesses and their owners, as well as executives. Principal Financial Group, Inc. was founded in 1879 and is based in Des Moines, Iowa." - Source: Yahoo Finance
Yahoo Finance
Risk and Reward Balances
MM forecasts are of reasonable-to-expect price limits, both higher and lower. Their range, split by current market price, defines the balance of gain vs. loss prospects. Figure 1 shows those upper and lower limits of price change on the given date for each of the stocks identified by reader traffic on Yahoo and other internet services.
Figure 1
blockdesk.com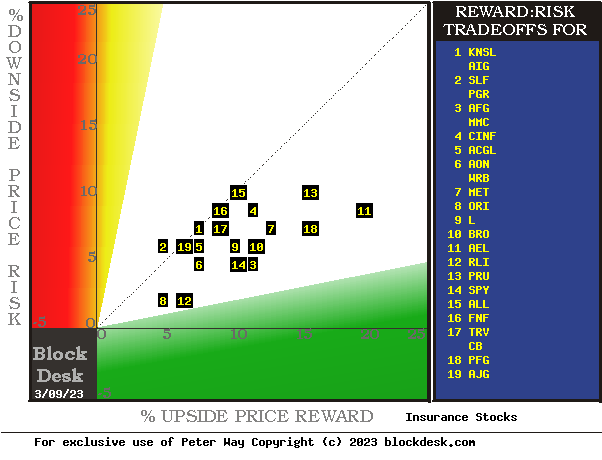
(used with permission)
Upside price rewards are from the behavioral analysis (of what to do right, not of errors) by Market-Makers [MMs] as they protect their at-risk capital from possible damaging future price moves. Their potential reward forecasts are measured by the green horizontal scale.
The risk dimension is of actual price draw-downs at their most extreme point while being held in previous pursuit of upside rewards similar to the ones currently being seen. They are measured on the red vertical scale.
Both scales are of percent change from zero to 25%. Any stock or ETF whose present risk exposure exceeds its reward prospect will be above the dotted diagonal line. Capital-gain attractive to-buy issues are in the directions down and to the right.
Our principal interest is in PFG at location [18]. A "market index" norm of reward~risk tradeoffs is offered by SPY at [14]. Most appealing by this Figure 1 view may be AEL at [11].
This map provides a good visual comparison of the two most important aspects of every equity investment. There are other aspects of comparison which this map sometimes does not communicate well, particularly when general market perspectives like those of SPY are involved. Where questions of "how likely' are present other comparative tables, like Figure 2, may be useful.
Figure 2
blockdesk.com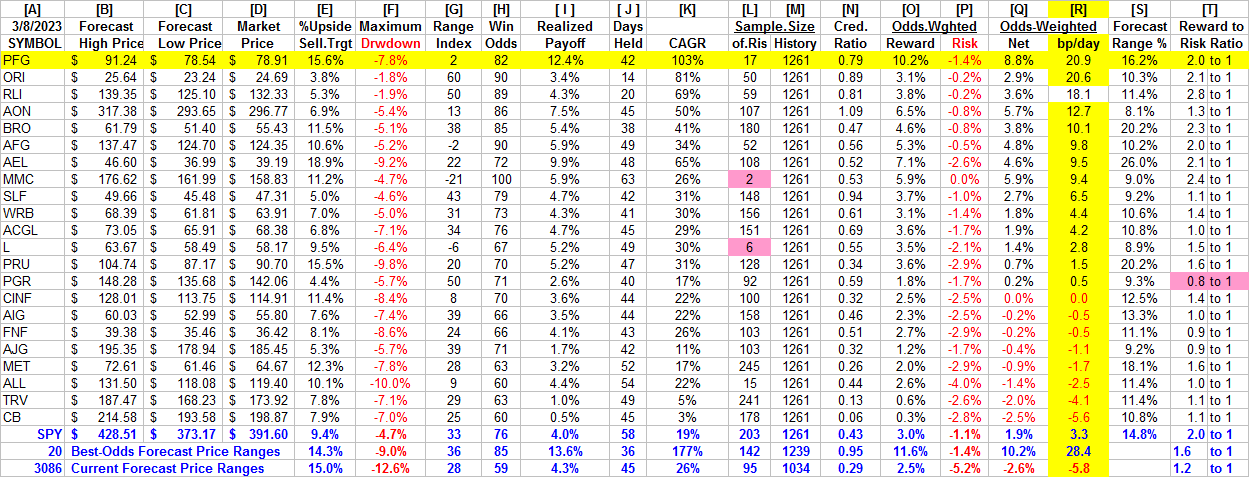
Source: Blockdesk.com (used with permission)
Column headers for Figure 2 define investment-choice preference elements for each row stock whose symbol appears at the left in column [A]. The elements are derived or calculated separately for each stock, based on the specifics of its situation and current-day MM price-range forecasts. Data in red numerals are negative, usually undesirable to "long" holding positions. Table cells with yellow fills are of data for the stock of principal interest and of all issues at the ranking column, [R].
Readers familiar with our analysis methods may wish to skip to the next section viewing price range forecast trends for PFG.
Why do all this math?
Figure 2's purpose is to attempt universally comparable answers, stock by stock, of a) How BIG the prospective price gain payoff may be, b) how LIKELY the payoff will be a profitable experience, c) how SOON it may happen, and d) what price draw-down RISK may be encountered during its holding period.
The price-range forecast limits of columns [B] and [C] get defined by MM hedging actions to protect firm capital required to be put at risk of price changes from volume trade orders placed by big-$ "institutional" clients.
[E] measures potential upside risks for MM short positions created to fill such orders, and reward potentials for the buy-side positions so created. Prior forecasts like the present provide a history of relevant price draw-down risks for buyers. The most severe ones actually encountered are in [F], during holding periods in effort to reach [E] gains. Those are where buyers are most likely to accept losses.
The Range Index [G] tells where today's price lies relative to the MM community's forecast of upper and lower limits of coming prices. Its numeric is the percentage proportion of the full low to high forecast seen below the current market price.
[H] tells what proportion of the [L] sample of prior like-balance forecasts have earned gains by either having price reach its [B] target or be above its [D] entry cost at the end of a 3-month max-patience holding period limit. [ I ] gives the net gains-losses of those [L] experiences.
What makes PFG most attractive in the group at this point in time is its ability to produce earnings most consistently at its present operating balance between share price risk and reward. Credibility of the [E] upside prospect as evidenced in the [I] payoff is shown in [N]. Where for these stocks the most fatal (pink-fill) deficiencies lie.
Further Reward~Risk tradeoffs involve using the [H] odds for gains with the 100 - H loss odds as weights for N-conditioned [E] and for [F], for a combined-return score [Q]. The typical position holding period [J] on [Q] provides a figure of merit [fom] ranking measure [R] useful in portfolio position preferencing. Figure 2 is row-ranked on [R] among alternative candidate securities, with PFG in top rank.
Along with the candidate-specific stocks these selection considerations are provided for the averages of some 3300 stocks for which MM price-range forecasts are available today, and 20 of the best-ranked (by fom) of those forecasts, as well as the forecast for S&P500 Index ETF (SPY) as an equity-market proxy.
As shown in column [T] of figure 2, those levels vary significantly between stocks. What matters is the net gain between investment gains and losses actually achieved following the forecasts, shown in column [I]. The Win Odds of [H] tells what proportion of the Sample RIs of each stock were profitable.; 87% by PFG, 90% by ORI, and 89% by AON. Also contributing is the size of [I], with PFG some 3x the size of RLI.
Recent Trends of Primary Subject PFG Forecasts
Figure 3
blockdesk.com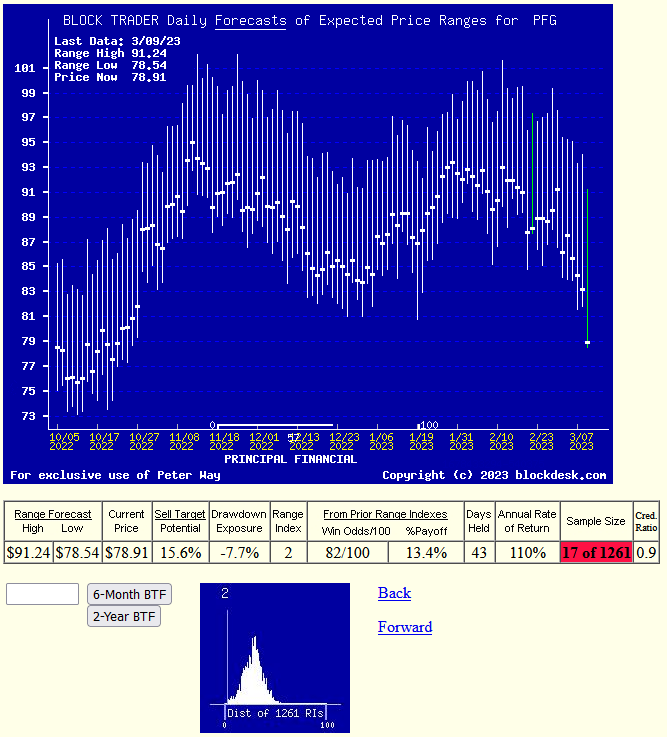
used with permission
This is NOT a typical "technical analysis CHART" of PAST stock price history. Instead its vertical lines are a daily-updated visual forecast record of price range limits expected in the coming few weeks and months. The heavy dot in each vertical is the stock's closing price on the day the forecast was made.
From that market price point an explicit definition is made of the price reward and risk expectations which were being made at the time, with visual support of the balance between risk and reward. The measure of that balance is the Range Index. Here the RI indicates that only 2% of the full forecast range of from $91 to $78 is downside, leaving a much larger 98% of the range to the upside.
Having such precise price expectation measures makes it much easier to make direct comparisons between all securities at each point in time, as was done in Figure 1.
The recorded histories of price range forecasts make it possible to understand how well each security performed in subsequent markets. It also reinforces under what Risk~Reward balance circumstances better forecasts were able to be made in the past and as in Figure 2, may be made at present for the future.
Conclusion
The notion of "which investment today?" is being answered by Institutional Investor circles saying that Principal Financial Group, Inc. is the best capital gain opportunity in the Insurance Stocks set.