HAKINMHAN
Has your mortgage rate gone up? How about credit card debt? If you want to get on the right side of rising interest rates, maybe you should take a gander at some floating rate investment vehicles, such as CEFs Pioneer Floating Rate Fund (NYSE:PHD) and Invesco Senior Income Trust (NYSE:VVR).
Since our 1st article on these two funds, in late November 2022, they have both beaten the S&P 500 by a wide margin, thanks to their hefty monthly distributions, which their management teams have increased multiple times over the last 12 months.
VVR has had the strongest return, at 12.54%, vs. 7.87% for PHD, and 4.26% for the S&P 500. All of that outperformance has come from distributions, as both funds have had modest price declines during this period:
Hidden Dividend Stocks Plus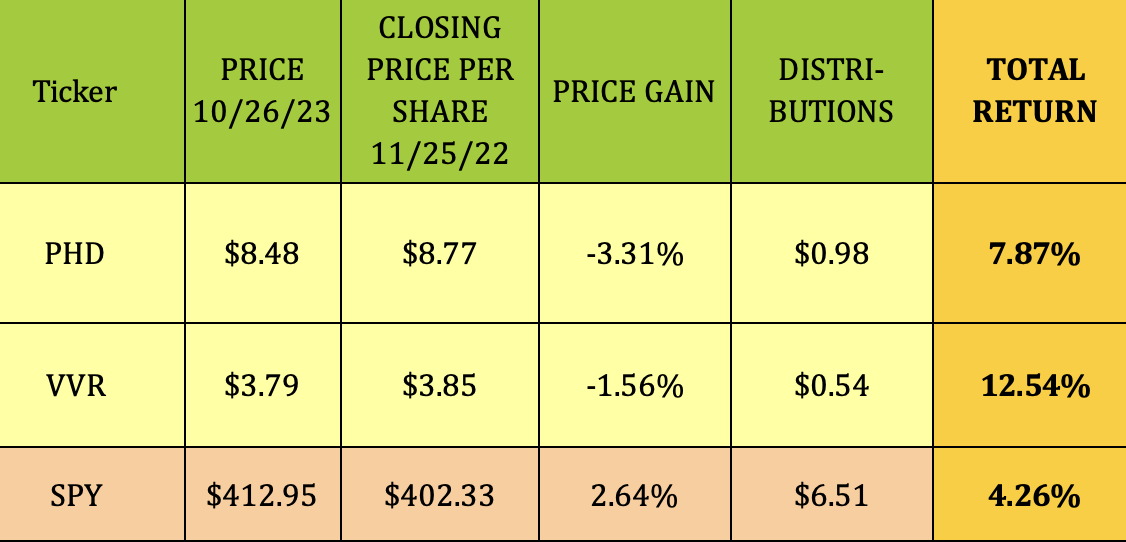
Fund Profiles:
PHD invests mainly in floating-rate loans in order to provide investors with a high level of current income. Its secondary objective is to provide capital preservation in a manner consistent with its primary goal.
VVR also seeks to provide a high level of current income, consistent with the preservation of capital. Similar to PHD, VVR invests mainly in floating or variable senior loans.
VVR is much larger than PHD, with more than 10X the average daily volume, and more than 3X PHD's asset base. VVR began in 1998, and had 492 holdings as of 9/3023, vs. 301 for PHD.
Both funds use the leverage of ~32.5% in order to goose returns, which pumps up their expenses a bit - PHD has a ~4% expense ratio, vs. 3.57% for VVR.
Hidden Dividend Stocks Plus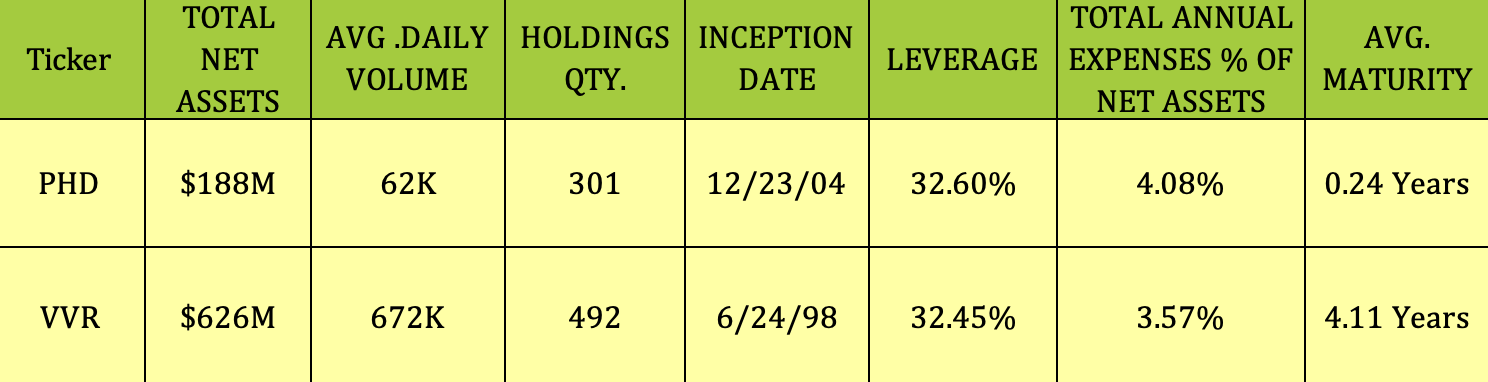
Holdings:
PHD biggest maturity exposure is in 3-5 year maturities, at ~50%, followed by 5-7 years, at 27.74%, and 1-3 year years, at 15%.
PHD site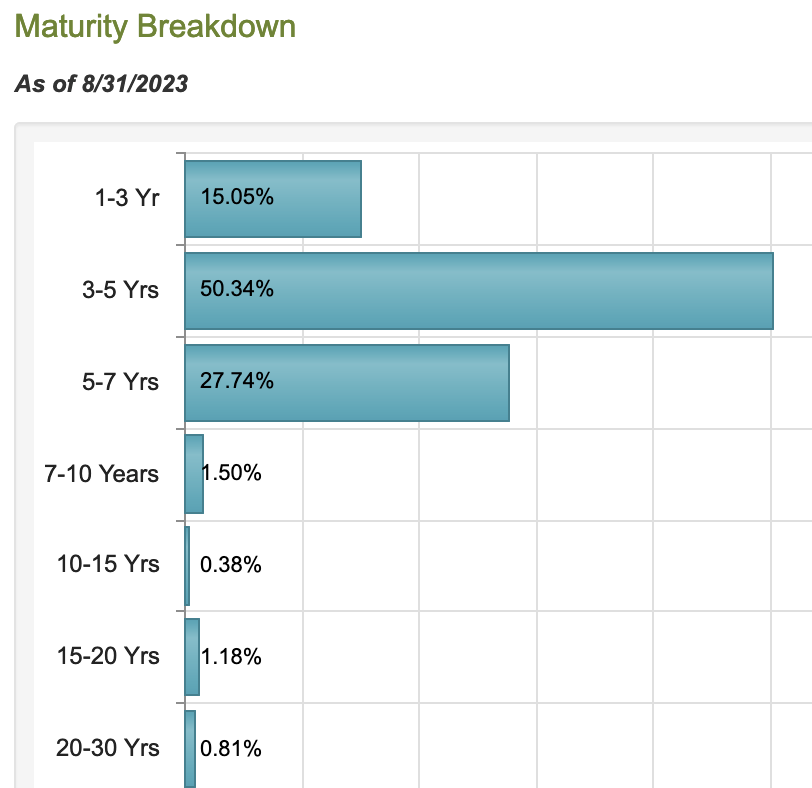
VVR's maturity exposures is more heavily weighted toward 5-7 years, at 34.59%, vs. 50.34% for PHD. Its 1-3 years and 3-5 years exposures are lower than those of PHD, at 9.61% and 41.39%, respectively.
VVR site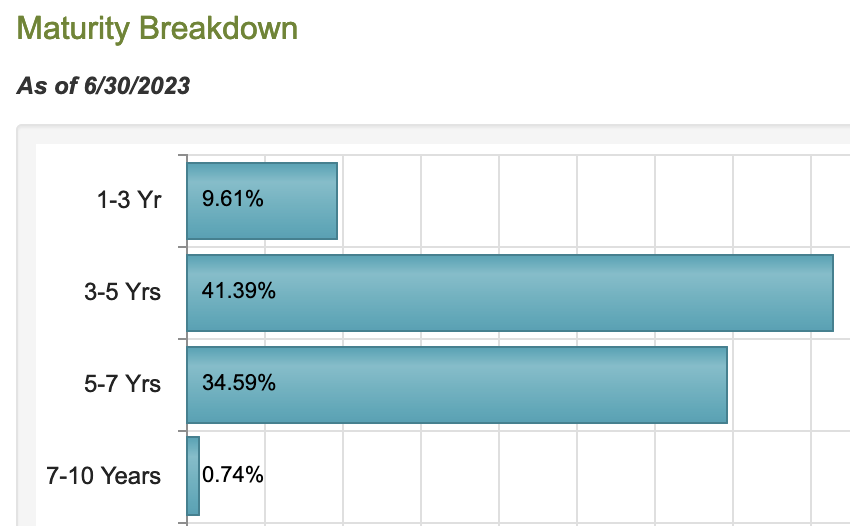
Quality-wise, PHD's main exposures are in non-investment grade tranches BB, at 20.14%, and B, at 61.42%, with some additional exposure to CCC, at 8.64%, and non-rated, at 5.10%:
PHD site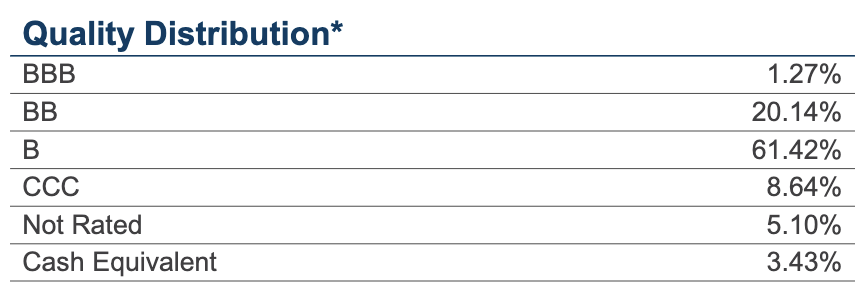
VVR has much more exposure to non-rated investments, at 43.25%, with its BB-rated and B-rated exposures much lower than those of PHD, at 14.76% and 32%, respectively:
VVR site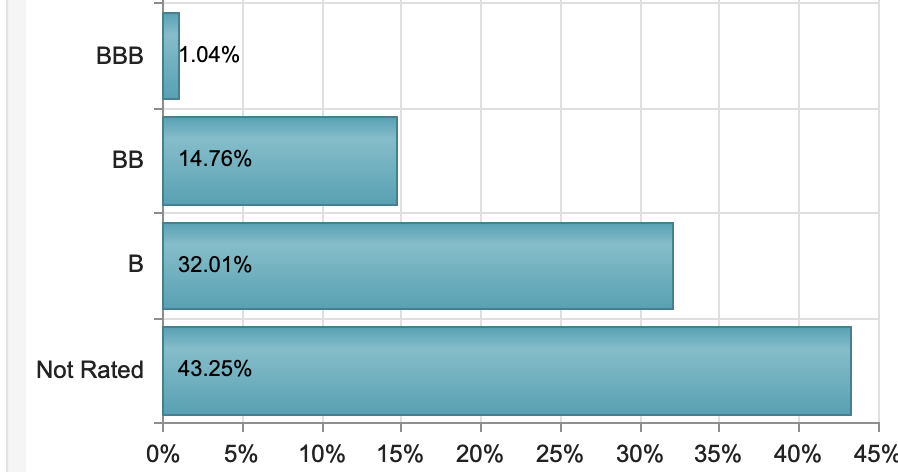
PHD's top five sectors are Consumer, Capital Goods, Health Care, Tech, and Communications - and comprise ~63% of its holdings. The average life of its holdings is 4.16 years, with a duration of 0.24 years:
PHD site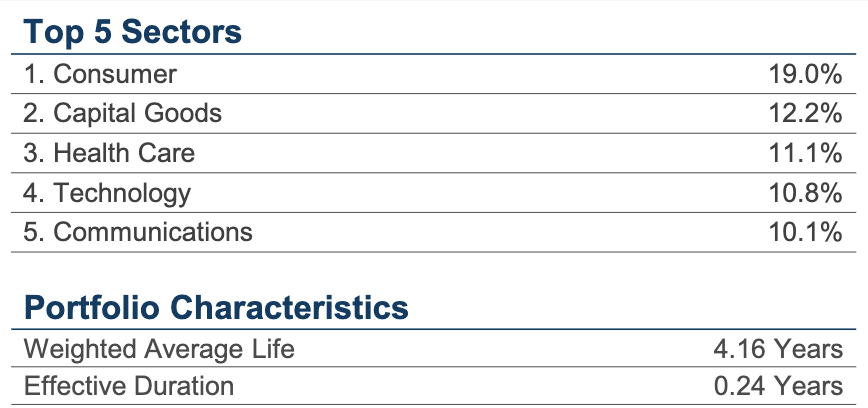
As of August 2023, VVR's top five sectors were Service, at 15.6%, Healthcare, at 8.58%, Gaming, at 8.35%, Manufacturing, at 7.45%, and Chemicals, at 6.81%.
VVR site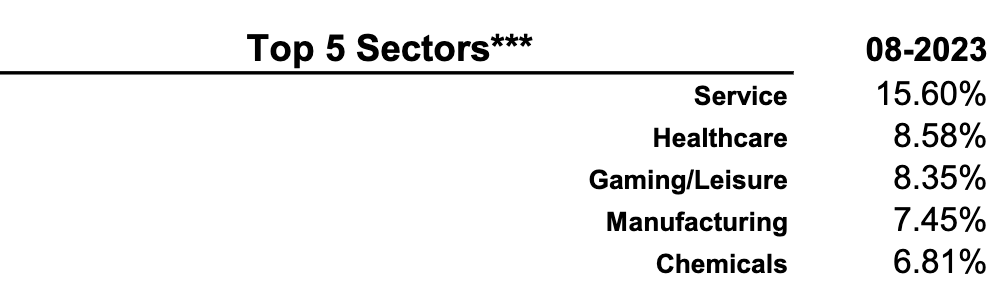
PHD's top 10 holdings' coupons range from 8.93% to 10.88%, and comprise just 11.14% of its portfolio.
PHD site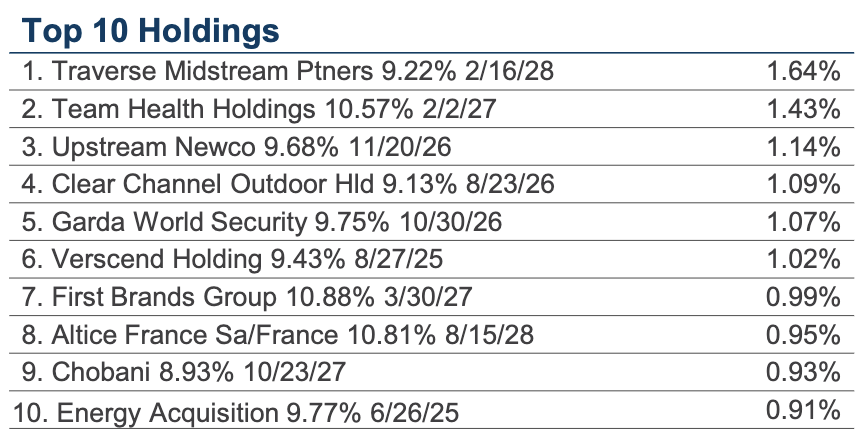
VVR's top 10 is headed up by Quad Energy Corp, at 3.22%, with smaller exposures to familiar companies, such as PetSmart, American Airlines (AAL), United Airlines (UAL), and Carnival (CCL). The top 10 comprises 13.5% of VVR's portfolio.
VVR site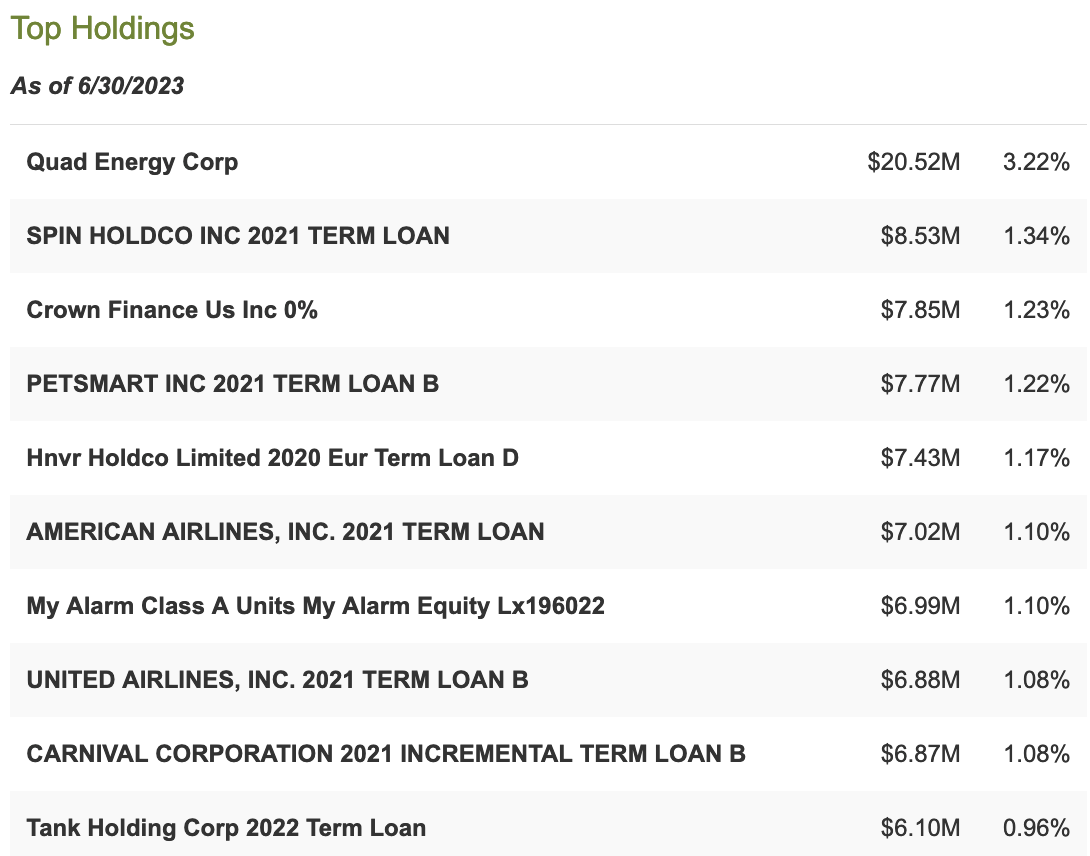
Dividends:
The rising interest rate environment has enabled both PHD and VVR to raise their monthly distributions several times over the past year.
PHD has had six hikes, raising its monthly payout by 23%, from $0.075 to $0.0925.
PHD site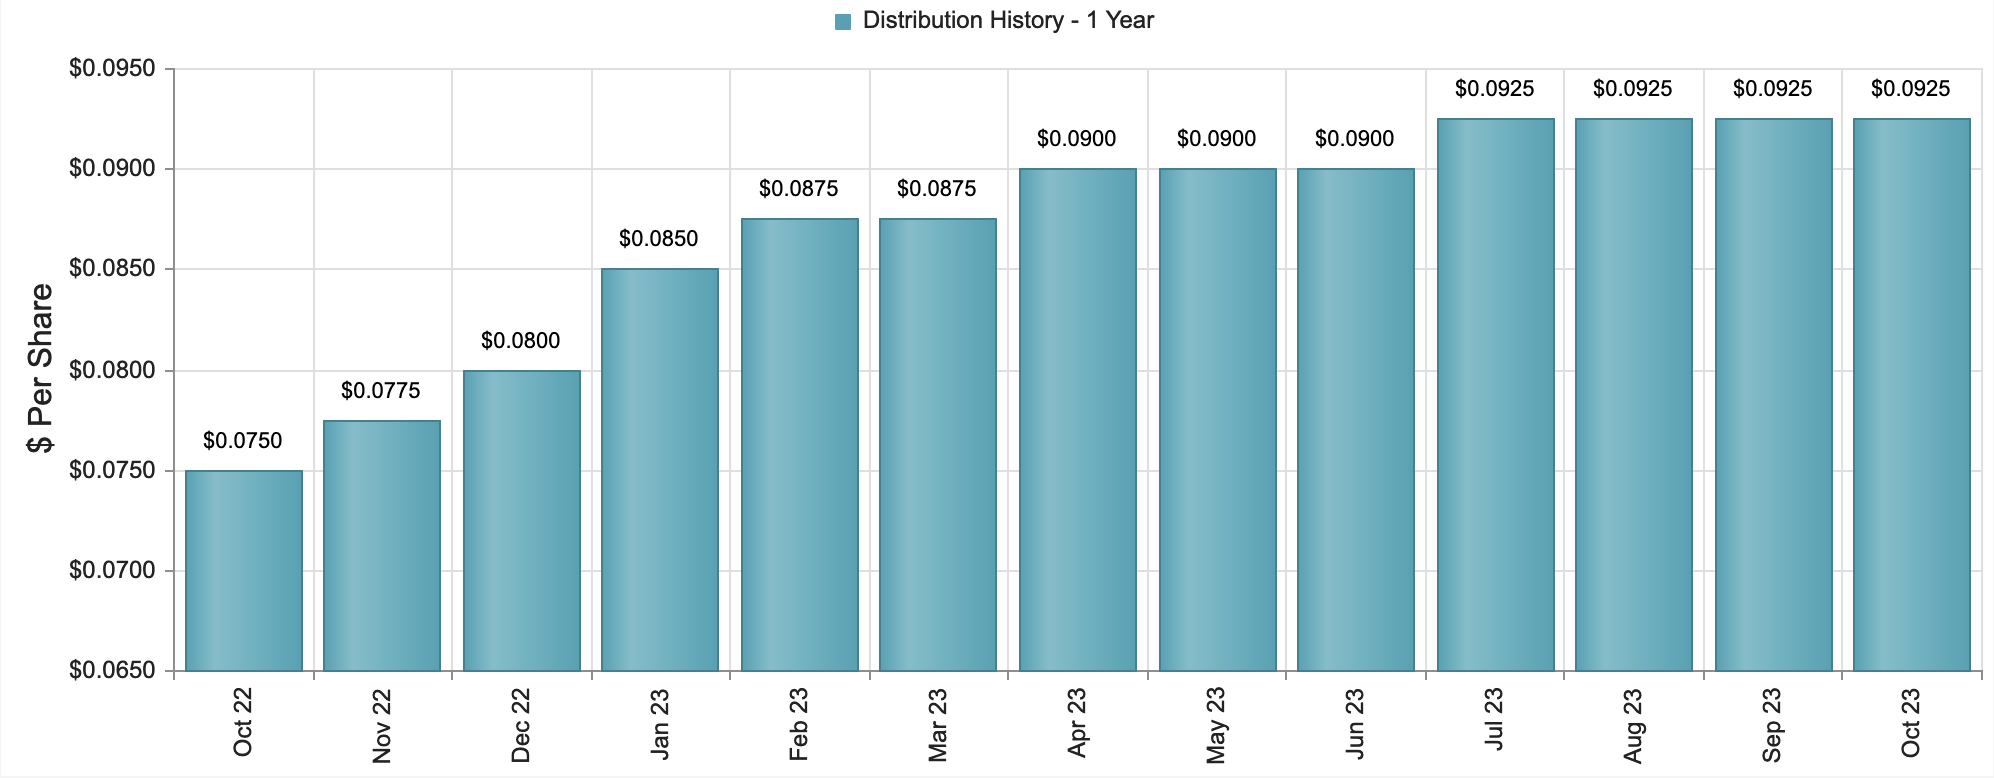
VVR has had two hikes, raising its monthly payout by 34%, from $0.032 to $0.043, but VVR also paid a special distribution of $.1559 in December '22:
VVR site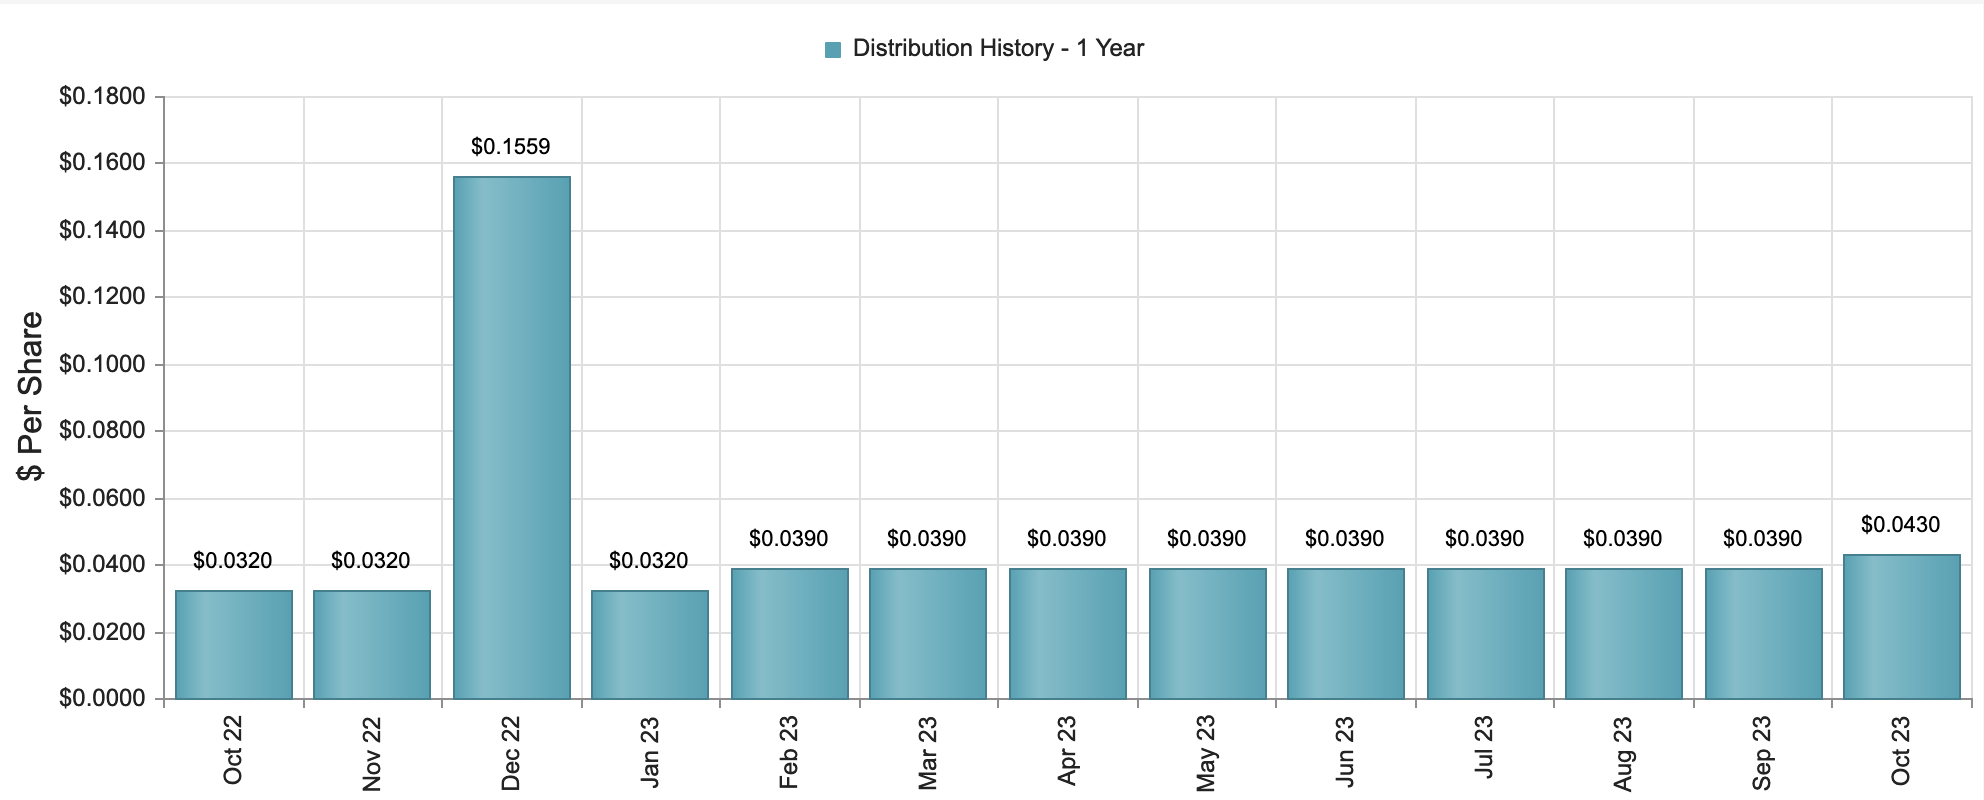
At their current rates, PHD yields 13.09%, while VVR yields 12.35%, based on their 10/26/23 intraday prices/share. They should both go ex-dividend on ~11/1423, with a ~11/20/23 pay date. VVR has a much higher five-year dividend growth ratio of 11.95%, vs. 3.84% for PHD:
Hidden Dividend Stocks Plus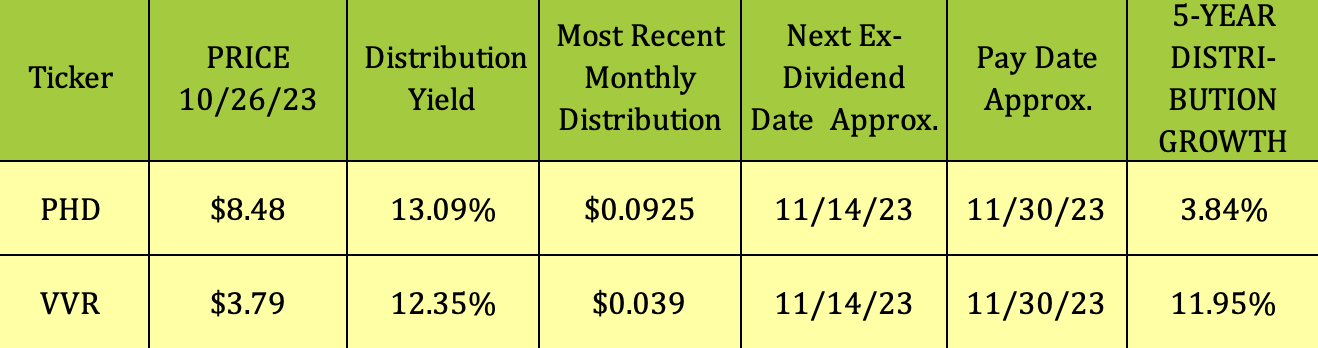
Performance:
As of 9/30/23, PHD had a three-year price return of 4.27% and a three-year NAV return of 5.81%. Its five-year returns are 4.02% and 3.51% for price and NAV, respectively.
PHD site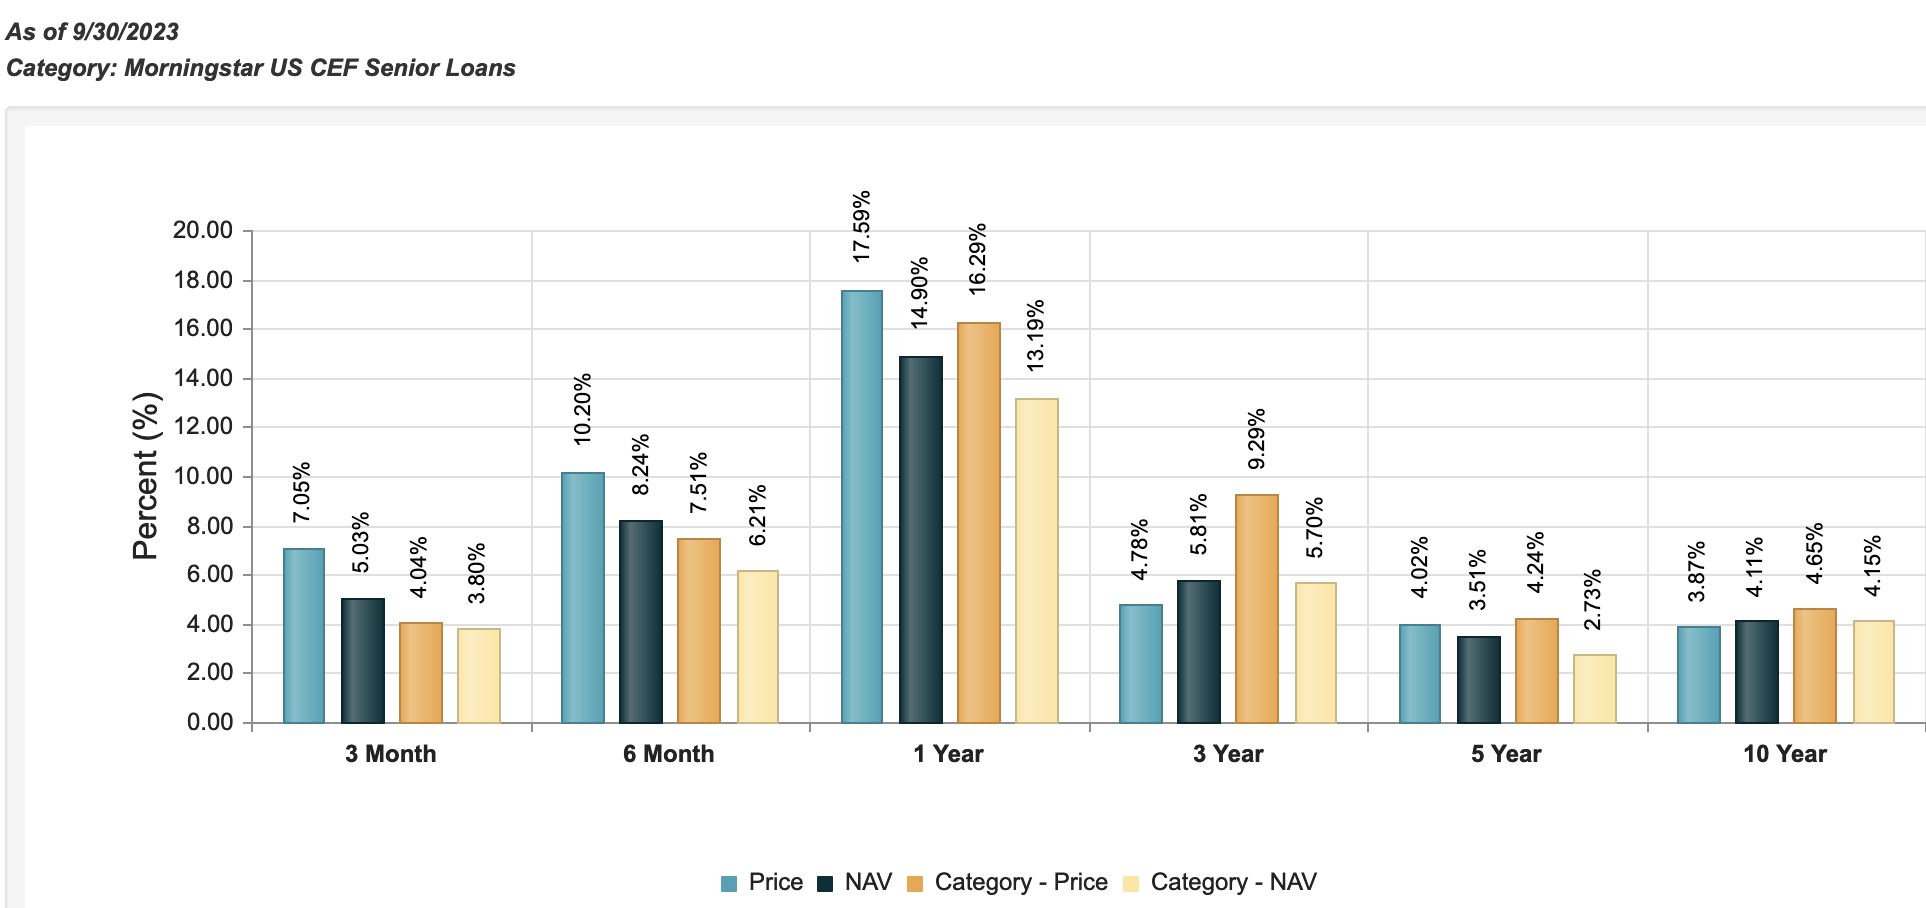
VVR has much higher long-term returns than PHD. It has a three-year price return of 12.71% and a three-year NAV return of 8.51%. Looking back further, its five-year returns are 7% and 4.35% for price and NAV, respectively.
VVR site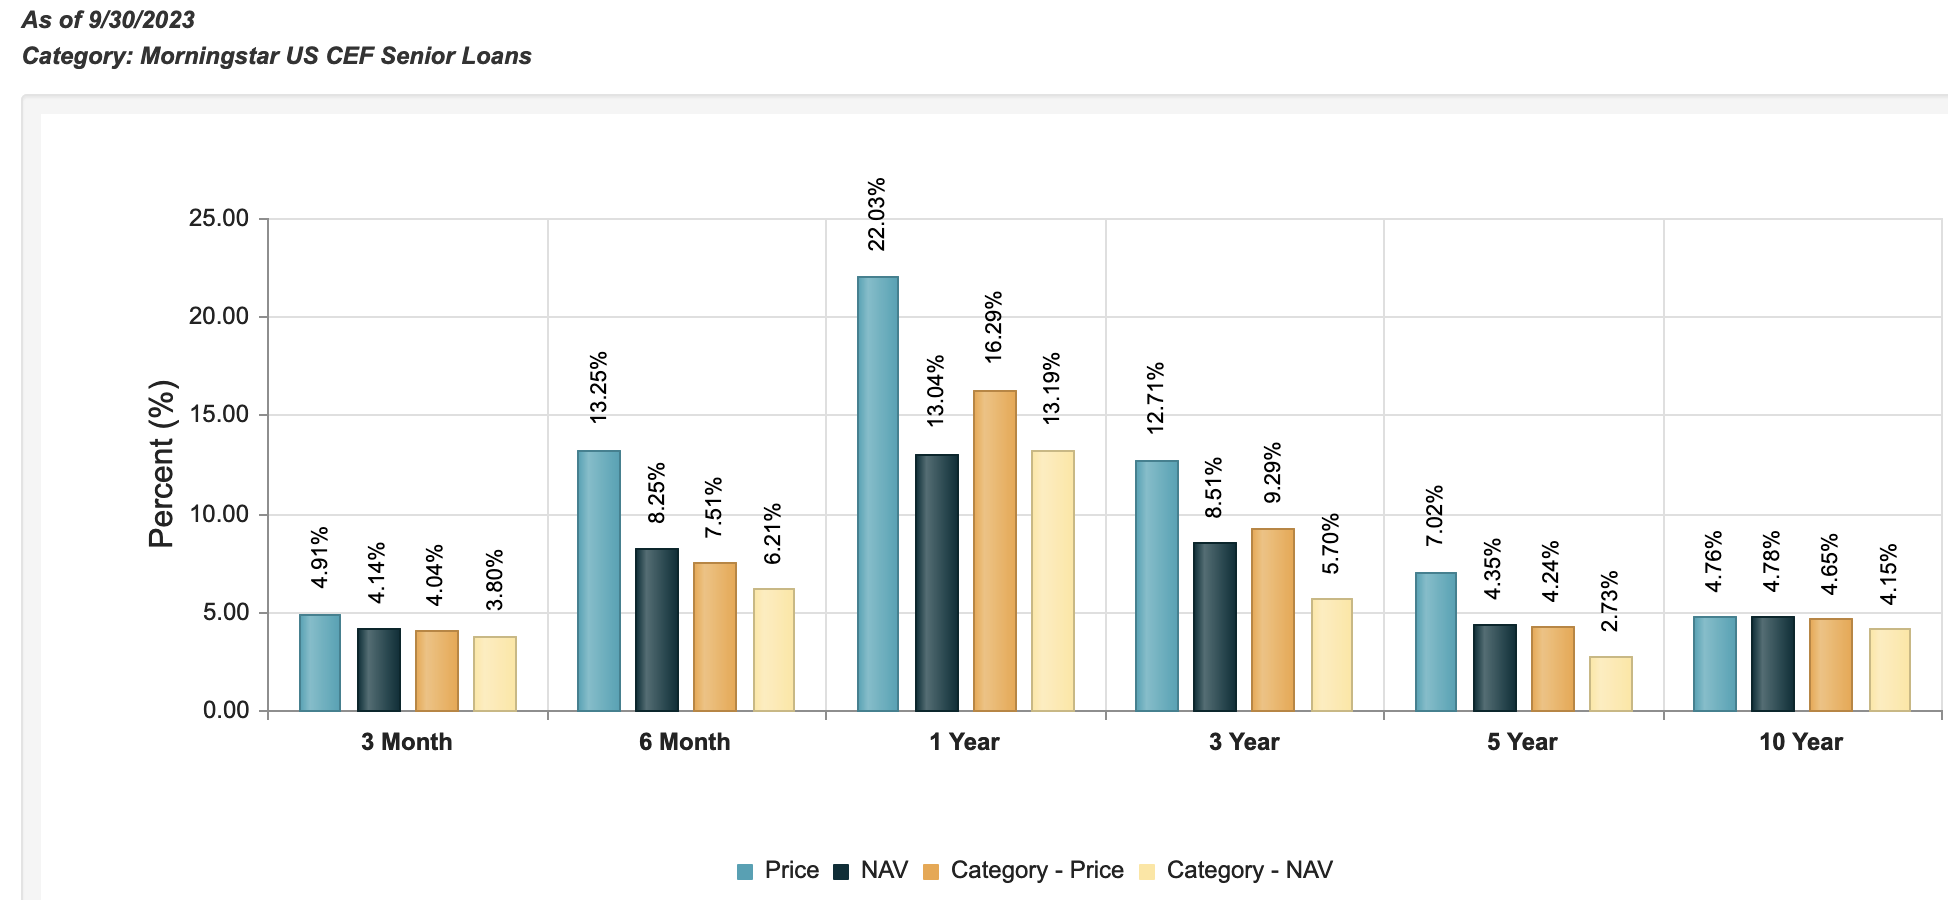
Valuations:
Buying CEFs at discounts to NAV that are deeper than their historical averages can be a useful strategy due to mean reversion. Daily NAV values are calculated after the close of each market trading day.
As of the 10/25/23 close, PHD was selling at a much deeper discount than VVR. Its 15.72% discount was deeper than its one-year average price/NAV while being over 2X its three-year average. It also was a deeper discount than the five-year average price to NAV.
VVR also was selling at a discount, which was 7.88% as of the 10/25/23 close. However, that discount was smaller than its one-, three-, and five-year average discounts to NAV/share.
Hidden Dividend Stocks Plus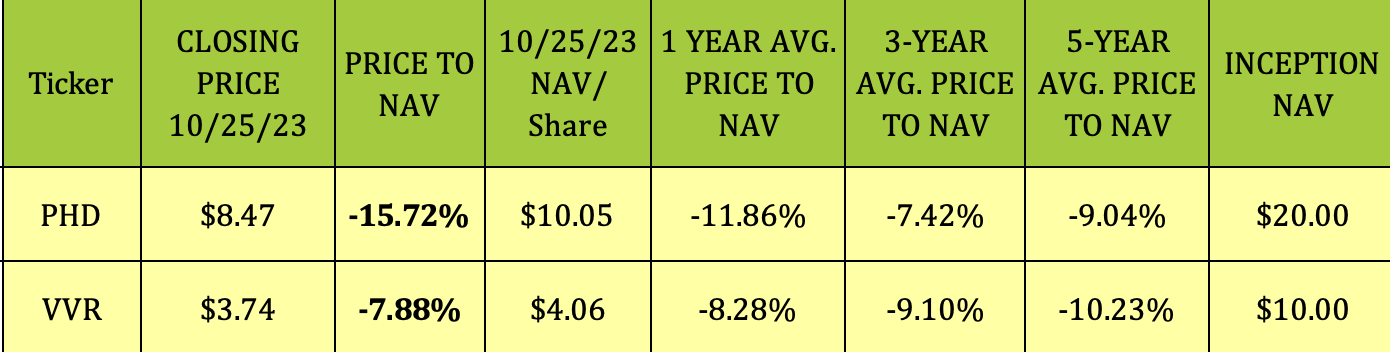
Parting Thoughts:
While PHD has a much larger discount to NAV vs. its historical averages than VVR does, it has trailed VVR by ~467 basis points over the last ~11 months. Both funds did outperform the S&P during this period, however.
The funds' longer-term performance shows VVR with much higher long-term returns than PHD. At its 10/26/23 price of $3.79, VVR is 6% above its 52-week low of $3.55, while PHD is only 2.2% above its 52-week low of $8.30. Both funds are oversold on their long-term stochastic charts.
While we formerly favored PHD, due to its deeper discount, VVR has a better long-term track record. We advise waiting for a further pullback in VVR shares - trying to buy a deeper discount than its historic averages.
All tables are furnished by Hidden Dividend Stocks Plus, unless otherwise noted.
Our Marketplace service, Hidden Dividend Stocks Plus, focuses on a diverse group of undercovered, undervalued income vehicles, and special high yield situations.
We scour the US and world markets to find solid income opportunities with dividend yields ranging from 6% to 20%-plus, backed by strong earnings.
We publish exclusive articles each week with investing ideas for the HDS+ site that you won't see anywhere else.
There's currently a 20% discount and a 2-week Free Trial for new members.