champpixs
Thesis
The iShares BB Rated Corporate Bond ETF (NYSEARCA:HYBB) is a fixed income exchange traded fund. The vehicle represents a play on U.S. high yield bonds via its goal of tracking the ICE BofA BB US High Yield Constrained Index. When compared to other high yield ETFs, this fund on a first look should represent a more conservative take on the U.S. high yield market since it is focused on the BB band of the segment:
Default Rates (S&P)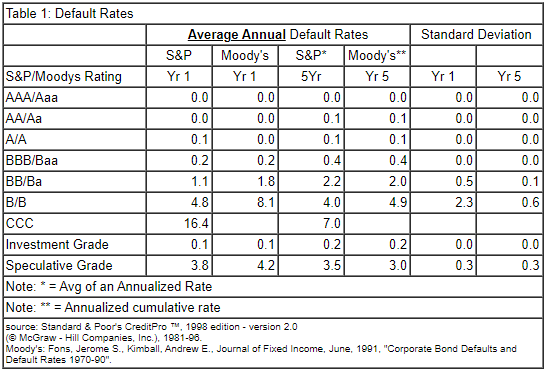
High yielding credits start with the BB band, which has the lowest 5-year probability of default, and end at the CCC band which is the riskiest one, exhibiting a 7% 5-year probability of default. It is ideal to use the 5-year time-frame because that is the average tenor of high yielding debt securities, and a portfolio is best analyzed from that viewpoint. Note the significant 5x jump in default risk that occurs once we move from the BBB investment grade band to the BB high yield band.
We called this article 'HYBB: Not The Conservative High Yield Fund You Expected', because on a first look basis, investing in the highest rated names should provide the most 'conservative' take on U.S. high yield. Mathematically, BB names have the lowest annual probability of default from the respective table when looking at the high yield cohort. Also from a structural standpoint, it is worth noting that this is an ETF and thus has no leverage, again representing the most conservative way to build a portfolio of high yielding credits.
In this article, we are going to analyze the strengths and weaknesses of HYBB, and asses if a retail investor is well served by investing in this ETF versus other available alternatives.
Holdings - mostly BB names
The fund contains mostly 'BB' credits, which make up over 90% of the collateral:
Collateral (Fund Fact Sheet)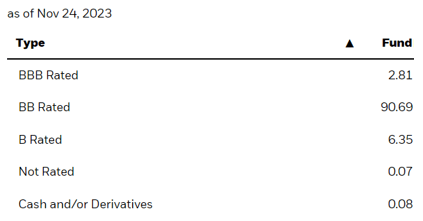
To note some bonds are rated 'BBB' and some are rated 'B' due to upgrades/downgrades that occur during the year. Credits that are originally rated 'BB' can migrate to a higher or lower band, depending on their fundamental performance and rating agency view.
The largest sectoral allocation in the HYBB portfolio is to 'Consumer Cyclicals' which account for 17.25% of the fund, followed by 'Energy' at 15.35% and 'Communications' at 11.69%.
Is HYBB truly more conservative? The analytics say no
Let us now have a look at whether the fund's build yields superior analytics to a standard HY fund, namely the widely used SPDR Bloomberg High Yield Bond ETF (JNK):
Analytics (Author)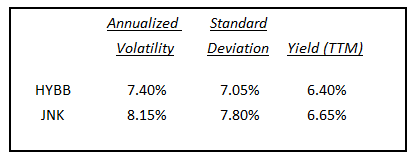
If we analyze the results we will find out that surprisingly it does not. The two vehicles have a very similar standard deviation and yield, while HYBB has a slightly better annualized volatility figure. We would have expected much more robust figures from HYBB, with volatility differentials around 1% to 2%. To note the analytics are derived from the Seeking Alpha platform solely, with the 'Annualized Volatility' and 'Standard Deviation' figures obtained from the Risk tab, while the yield can be found on the main page and represents a trailing 12 months one.
Performance wise, the risk analytics are validated, with the two vehicles having almost identical total returns:
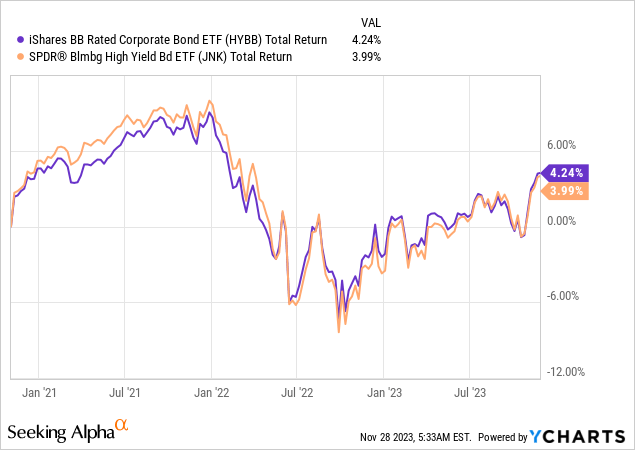
The total return figures match closely, as do the drawdowns. A more 'conservative' HY fund should exhibit shallower drawdowns, and less volatility versus a fund like JNK which contains a large segment of 'B' and 'CCC' rated credits. A retail investor who wants to have exposure to the high yield sector and wants to be 'conservative' does not find any additional alpha here in HYBB.
An investor also has to keep in mind the other factor that comes in when pricing high yield, namely 'Loss Given Default' or LGD. A credit might be 'CCC', but might have a lien on a factory or building that is worth more than the value of the debt, and thus the loss in a default scenario would be zero. Those types of credits for example are risky from a default probability perspective, but their market moves are much more conservative since an investor knows it will get the principal back for the bond.
Spreads are too narrow currently
With risk free rates at their peak, the next move in the fund will be driven by spreads. Currently BB HY spreads are at the bottom of their 3-year range:
BB Spreads (Ycharts)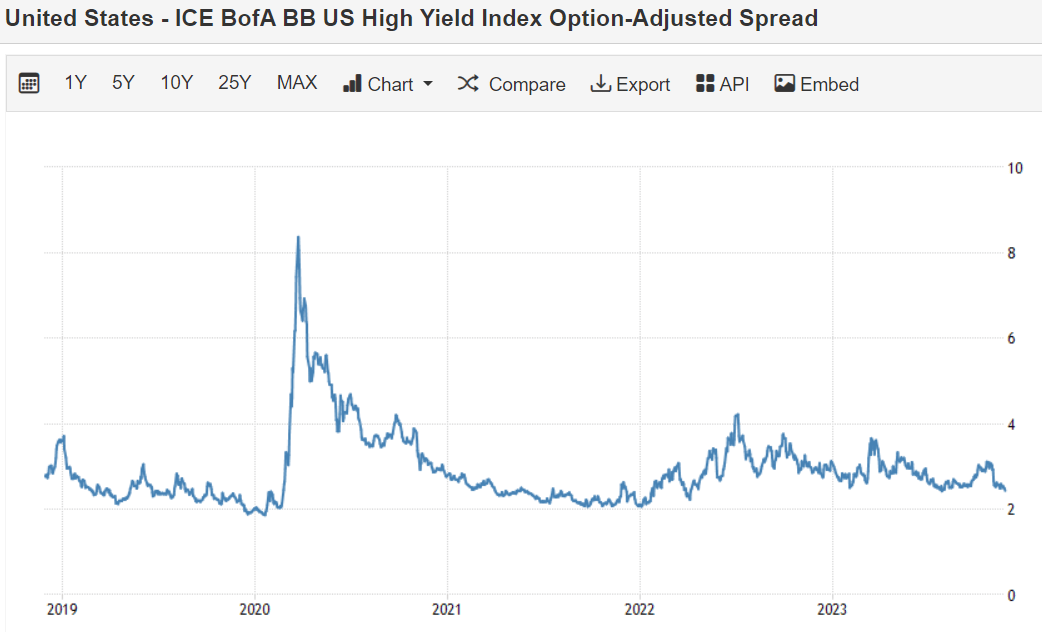
We can see how spreads for the BB index have fluctuated between 2% and 4% during normalized economic periods. During the market sell-off last year and in March 2023, the figure moved towards the top of the range, namely 4%.
We have had a significant market rally in the past few weeks, and increased discussions around a soft landing, factors which have pushed spreads towards historic tight levels. This is not going to last, with the next tremor set to push this up to at least 3%. Spreads are too narrow here, and should be sold, not bought.
While nobody can truly time the market, the range for BB spreads is very well established, and it is a matter of waiting for the next risk-off move in order to avoid the downside provided by spread widening.
Conclusion
HYBB is a fixed income ETF that offers retail investors' exposure to the U.S. BB high yield market. BB names represent the most conservative cohort from the high yield universe, with lower historical default rates when compared to their 'B' and 'CCC' peers.
The fund, however, does not display better analytics than the widely used JNK fund, ETF which contains 'B' and 'CCC' credits. HYBB has very similar volatility and standard deviation metrics, and its total return profile is nearly identical to JNK's. Despite its build, HYBB does not offer better risk rewards than JNK, a more liquid fund. With 'BB' spreads back at the bottom of their historic range currently, market factors also point towards selling HYBB rather than buying here. While the idea of segmenting the 'BB' high yield sleeve is commendable, the obtained results underwhelm. We are a seller of HYBB here.