Marcin_P_Jank
Caesars Entertainment (NASDAQ:CZR) hasn't risen much in price since my last article written in July 2022 here. I explained my worry about a potential U.S. recession, if it appeared, would be difficult for the company to deal with. Too much debt in a severe or prolonged economic downturn often leads to business asset sales, bond defaults/exchanges, and/or massive equity dilution to existing shareholders, especially at vacation/leisure destinations historically.
My current opinion has not really changed, because the balance sheet disaster since 2020 has not been addressed. I continue to rate shares a Sell. Let me lay out the bearish thesis.
Overleveraged Balance Sheet
To me, the risk of CZR trading under $10 a share in a deep recession scenario is not worth the limited upside potential in pricing, assuming a slow-growth U.S. economy next year. For gamblers, the investment proposition is Heads = I break even; Tails = I lose my shirt. Why put down a bet and flip the coin, with such crappy odds?
2023 was a Heads event, with a minimal share gain of +8% YTD and +6% since my bearish article 16 months ago. Travel economy demand was decent and labor wage pressures moderated somewhat this year. Yet, total interest expense has RISEN on the monster financial debt load of $12.3 billion at the end of September, with another $12.6 billion in long-term lease obligations. CZR has entered many casino property sale/leaseback deals with REIT VICI Properties (VICI) since 2017.
YCharts - Caesars, Financial Debt & LT Lease Obligations, Trailing 12-Month Interest Expense, Since 2019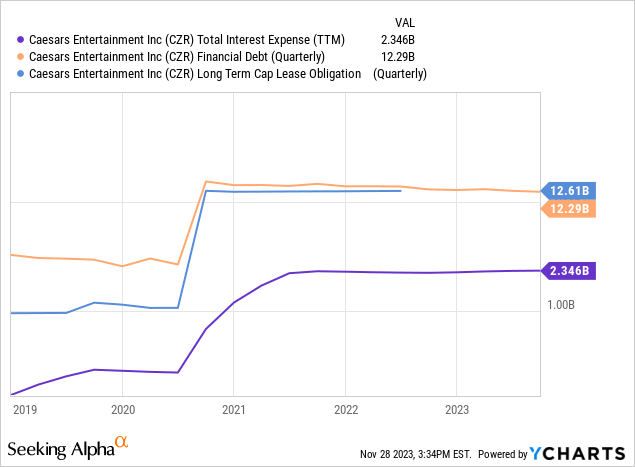
With the help of large tax-related accounting gains ($951 million), the company has reported net GAAP income this year. However, cash flows have barely grown, while the analyst outlook for 2024-25 calls for only minor operating profitability. This forecast is counting on travel spending moving in the right direction.
Seeking Alpha Table - Caesars, Analyst Estimates for 2023-25, Made November 27th, 2023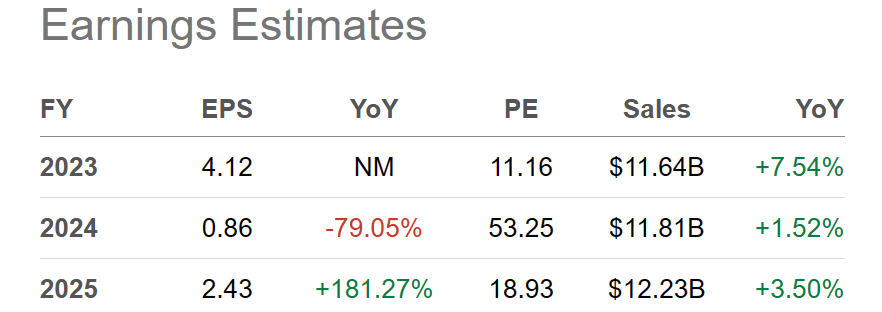
What this means for investors is even during a "good" year for the business, operating cash flows did not exactly cover interest expense. Honestly, since the 2020 COVID pandemic showed up and the company merged with Eldorado Resorts, operating income and cash flows have failed to match interest expenses. My question for readers is what will happen to Caesars in a recession, where sales decline at the same time as operating costs continue to advance?
YCharts - Caesars, Interest Coverage & Cash Flow vs. Interest Expense, Since 2015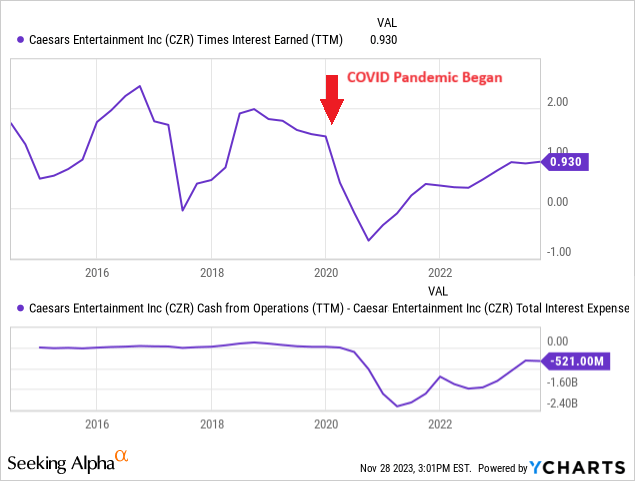
Another data point I don't like is the tangible book value number. If casinos, buildings, and land were worth considerably more than total debts and leases, shares would have a liquidation backstop, when necessary. Management could exchange this real estate location or that one for cash to cover maturing debts and interest expenses due, when revenue falls off a cliff during recessionary periods. (I am simplifying the choices to find cash fast.)
Alas, the combination of Caesars and Eldorado assets in 2020 created billions in new goodwill and intangibles, basically thin-air merger accounting that can evaporate when times turn rougher for a business. My view is this negative -$11 billion tangible book reading (roughly $51 per share) will hurt the enterprise's ability to raise new capital in the future, given sliding revenues and profits. $28.5 billion in total liabilities is quite a distance from the accounting hard asset value of its properties, gambling machines, vehicles, and furniture/equipment.
YCharts - Caesars, Tangible Book Value & Total Liabilities, Since 2014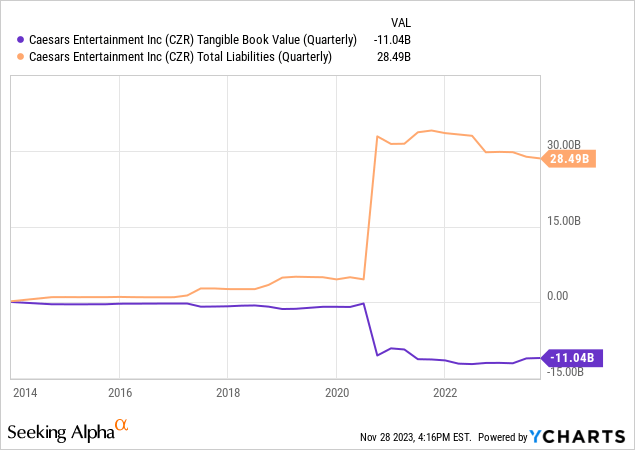
My suggestion for management to get out of this leveraged mess is to cut the negative tangible book value number and reduce debts to more manageable levels. How? You bite the bullet and do a major stock offering now, around $45 per share. Don't wait for far lower equity quotes to dilute owners later in 2024, after a recession has decimated the business. It sounds crazy but issuing 50% more ownership shares today would get the market capitalization closer to enterprise value and slash interest expense. Earnings per share might not decline as much as you would guess net-net (because high interest expense is eliminated), while margin and leverage ratios would improve dramatically. Sure, the stock quote might fall to $30 on the news. Nevertheless, shareholders wouldn't have to worry as much about sub-$10 possibilities in a deep recession.
YCharts - Caesars, Equity Market Cap & Enterprise Value (Equity + Financial Debt), Since 2019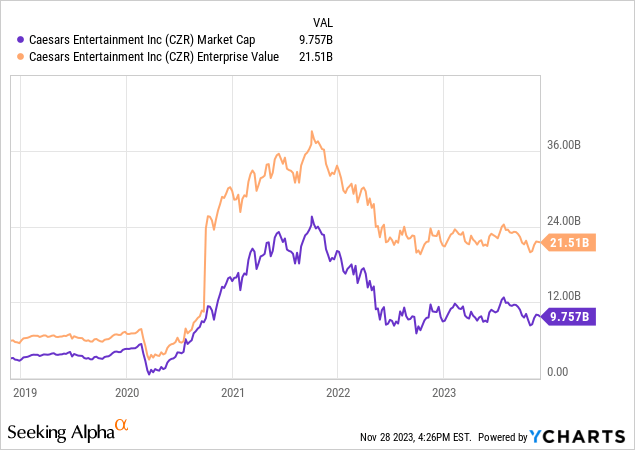
Weak Technical Momentum Since July
Of greater immediate concern, stock selling pressure has been accelerating since July 2023. Price is trending below its 200-day moving average, while seemingly in danger of slipping back beneath its 50-day. The share quote did reach a new 52-week low in late October.
Reviewing action in the Accumulation/Distribution Line, 20-day Chaikin Money Flow, and 14-day Ease of Movement calculations, a substantial imbalance of sellers vs. buyers has existed for four months running.
It could be Wall Street is already preparing for an approaching recession, "discounting" future trouble at Caesars. Bullish momentum indications are becoming more fleeting by the day, looking at my collection of 15 technical creations tracked regularly.
StockCharts.com - Caesars, 21 Months of Daily Price & Volume Changes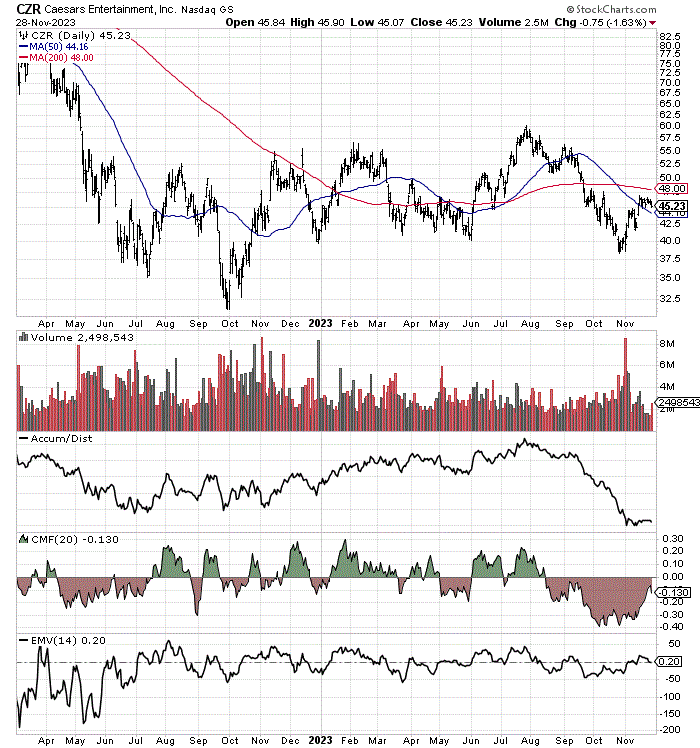
Final Thoughts
The valuation metrics for Caesars on an equity-only capitalization basis do not uniformly point to a risky investment proposition. Versus peers, a depressed share price from all the debt weighing on Wall Street projections can translate into a cheap "looking" entry today. For example, price to sales is on the low end vs. casino, gambling, and hotel peers/competitors. Lower valuations make sense with the extra going-concern risk in the event of a recession, as the income picture remains cloudy at best. In addition, standard enterprise valuation stats do not include the company's massive lease obligations (only traditional financial debt numbers). If you decide to include long-term property leases as debt, Caesars quickly becomes one of the more expensive picks on EBITDA and revenue.
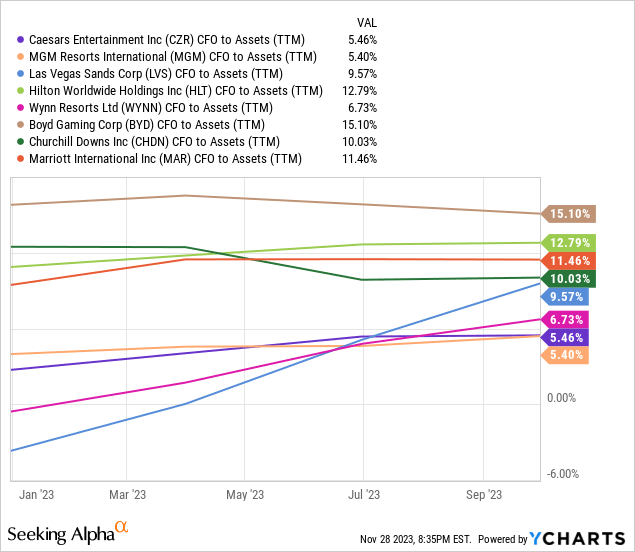
Excessive debts do produce very low margins for the business. Whether comparing income margins on sales (including the extraordinary CZR tax gains of 2023) or cash flow vs. total assets, Caesars sits on the weaker side of the industry spectrum for owner efficiency.
YCharts - Caesars vs. Major Casino, Gambling & Hotel Peers, Final Profit Margin, 12 Months YCharts - Caesars vs. Major Casino, Gambling & Hotel Peers, Cash Flow to Assets, 12 Months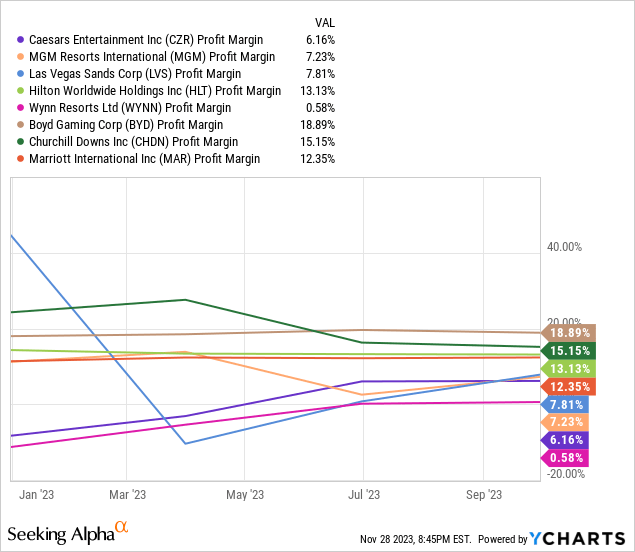
I absolutely would avoid this overleveraged pick as a function of sustainable earnings results. Peers and competitors are in a much smarter position for investors. Caesars sports the highest forward P/E ratio of the major casino names.
YCharts - Caesars vs. Major Casino, Gambling & Hotel Peers, Price to Forward Earnings, 12-Month Change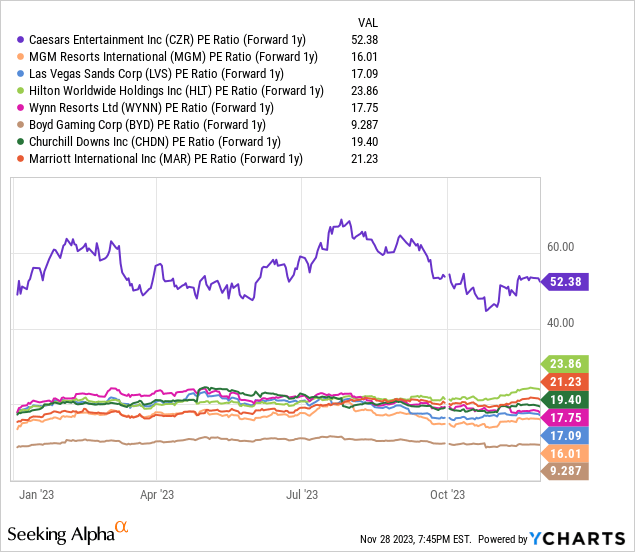
Can Caesars rise to $60 a share again in a strong-economy scenario? Absolutely, the best-case world for the company includes sales rising faster than worker wages (49,000 employees in December 2022) and interest expense (higher interest-rate debt rollovers). I think the odds of this rosy outlook becoming reality are low, with a 25% probability for optimists.
Let's say the remaining odds include a 25% chance of a slow growth, falling inflation environment (soft landing), which might allow the stock quote to fluctuate between $40-$50 during 2024, in my estimation.
Further, I place 25% odds on a mild recession next year, which would likely bring operating business losses and a material Caesars stock price decline below $30. Lastly, 25% odds of a deep recession remain, which could lead to a swift price shock down to $20, $10, or even lower per ownership share.
I would not ignore insolvency possibilities in a deep, multi-year recession. Asset sales, new partnership deals, and major equity raises could be the future for Caesars in a worst-case scenario, all a direct consequence of overextended leverage.
I rate shares a Sell and Avoid until debts are slashed or a stronger U.S. economy asserts itself.
Thanks for reading. Please consider this article a first step in your due diligence process. Consulting with a registered and experienced investment advisor is recommended before making any trade.