
Minakryn Ruslan/iStock via Getty Images
Investment Thesis
Gold prices continue to set new all-time highs almost every day, but you wouldn’t know looking at gold mining equities, including Barrick (NYSE:GOLD). Despite the bull market for gold, Barrick currently trades at a discount to its trailing historical averages and looks downright cheap when accounting for revenue to come if the rally sustains itself.
Barrick has a strong tier-one portfolio of gold and copper mines with many exciting projects in the works, some of which are ramping up production this year. Gold is well-supported by systemic changes in the global economy, while copper demand is set to double over the coming decade as the world urbanizes and electrifies. As a miner, Barrick is poised to see increasing profits as we enter the next commodity super cycle. In this article, I will cover the reason for gold’s rally and the support behind it, the future of copper, Barrick's strong and growing portfolio, their financial conditions that should lead to better shareholder returns, and the impact changing commodity prices will have on revenue.
Gold Market: Breakout Has Begun
Gold has continued its run that began at the end of February. Gold spot prices (XAUUSD:CUR) currently sit at $2336/oz which is near the all-time high in nominal terms. When adjusting for inflation, gold’s true all-time high occurred in February of 1979 when it peaked at $3000/oz in 2024 dollars.
In my last article, “The Gold Breakout Has Only Begun – Fundamental Analysis of Historic Performance” I covered the historical performance of gold and the reasons for gold’s current behavior. What follows is a brief summary of my findings, but I encourage anyone looking for details to see that article.
In the article I argue that gold is not the inflation hedge it is commonly marketed as, instead it is a commodity like any other metal driven by supply and demand. The long-term floor price of gold is therefore set by a base structural demand (which is independent of market cycles). Gold can rally higher during periods of economic uncertainty, but it ultimately falls back to the structural price which is not related to inflation.
Multi-year gold price trends have become correlated with the actions of the Federal Reserve over the last twenty years. We are currently in a bullish pattern, which is identified by rising gold prices while the Fed raises the Federal Funds Rate. As seen in the graph below, in prior cycles gold prices rose moderately during rate hikes, began to run up while rates remained flat, and skyrocketed once the Fed cuts rates. The rally in gold prices can last several years following rate cuts, but gold eventually gives back some of its gains during economic expansions (look at 2013). At this point gold falls back to its structural price which is higher than it once was before the run up. We are starting to see this pattern again because gold prices have risen during this cycle’s rate hikes and the gold price has taken off the more rate cuts are talked about.
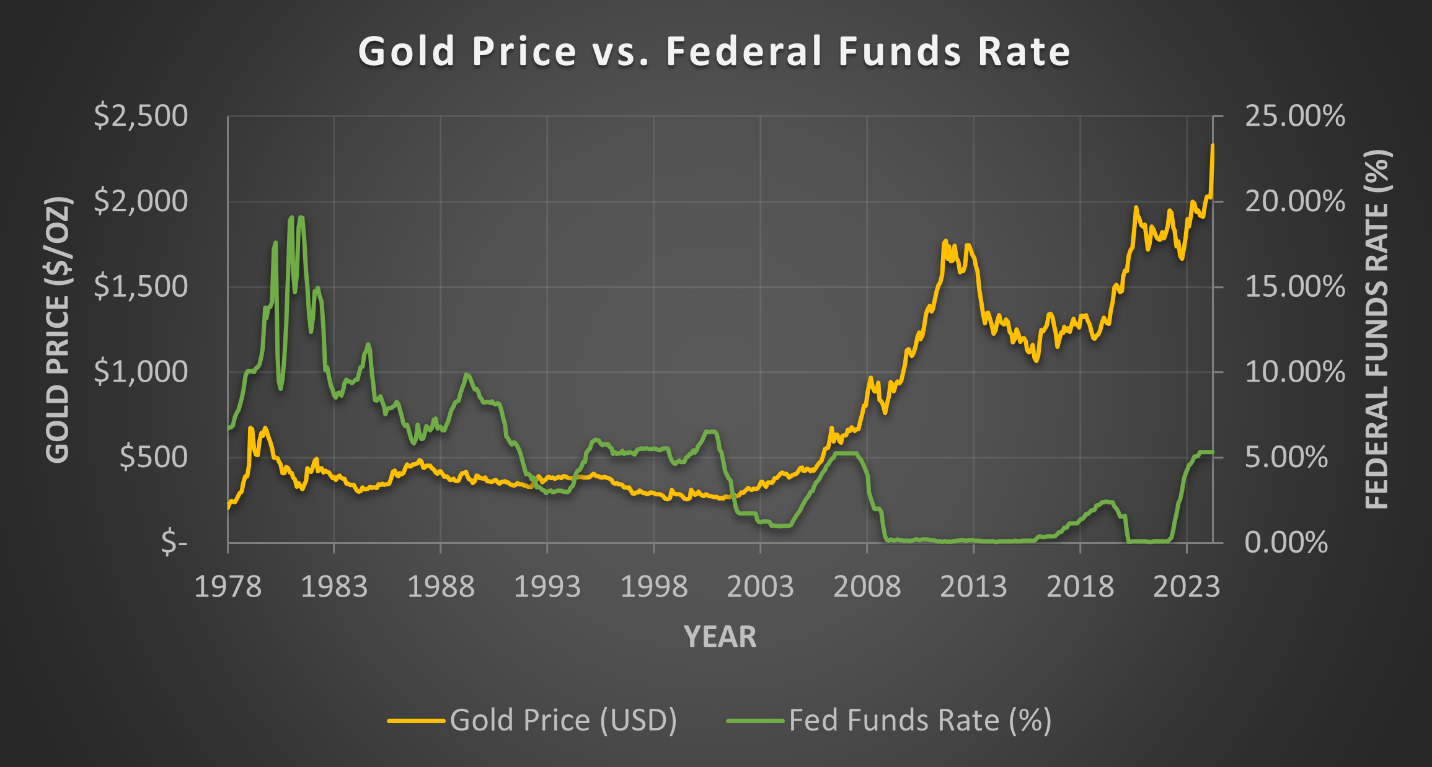
Gold price vs. federal funds rate from 1978 to present (World Gold Council, St. Louis Fred, chart by Author)
Despite increasing gold prices, consumers in advanced economies have been selling their gold. On the other hand, central banks in emerging markets, especially China, have been purchasing gold as part of their goal to reduce their dependence on the US dollar. Additionally, China is the only major market to see increasing retail demand for gold. This is likely caused by the weak property market and overall uncertainty Chinese citizens currently feel.
Copper Market: Strong Future Demand
Demand for copper is growing rapidly due to increased urbanization and electrification. The transition away from fossil fuels will increase the demand for copper, but it will only represent around 25% of the total copper demand. Building construction (28%), infrastructure (16%), and industrial applications (12%) are the true drivers of copper demand.
In an extremely detailed report by S&P Global, global refined copper usage is currently 25 million metric tons (MMT) per year. 2035 demand is expected to double to roughly 50MMT as shown in the graph below. However, planned new mine supply by 2035 will not be sufficient to meet this demand. In their “Rocky Road Scenario”, which assumes mine developments continue at the current pace, the global copper supply will be 9.9MMT short per year by 2035.
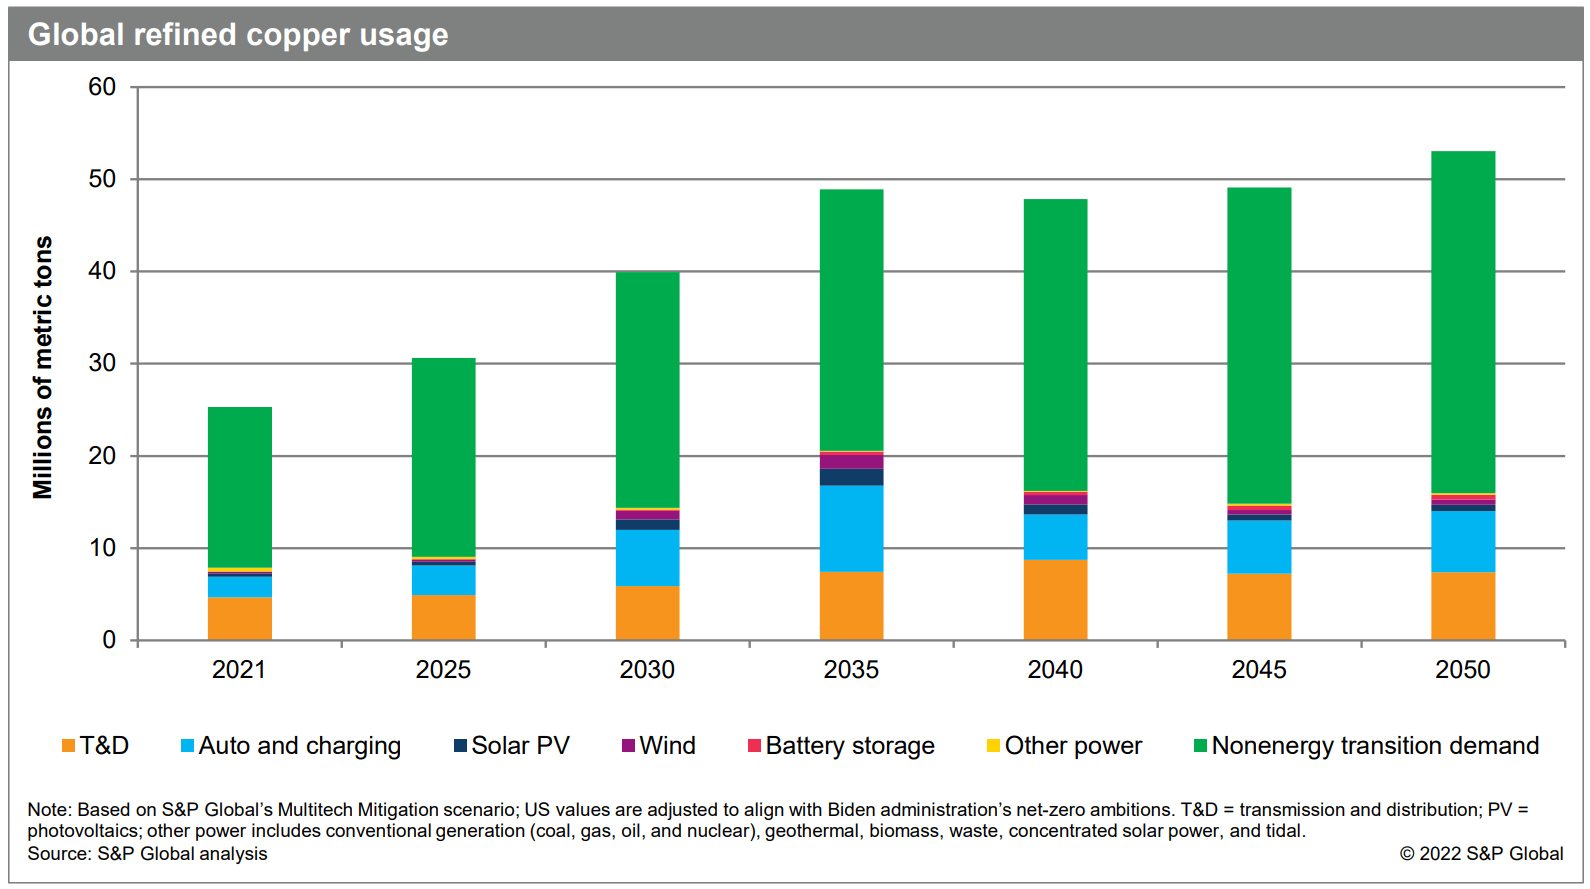
Global refined copper usage (S&P Global – The Future of Copper)
The supply of copper is limited by mining and recycling production. As the world’s demand for copper has increased, more copper resources have been discovered leading to a perpetual 40 years of reserves. Therefore, future copper demand can be met from a resource perspective; however, the industry has been underinvested in and the long lead times—usually around 20 years—needed to develop a mine mean the likelihood of supply matching demand over the next decade is very low.
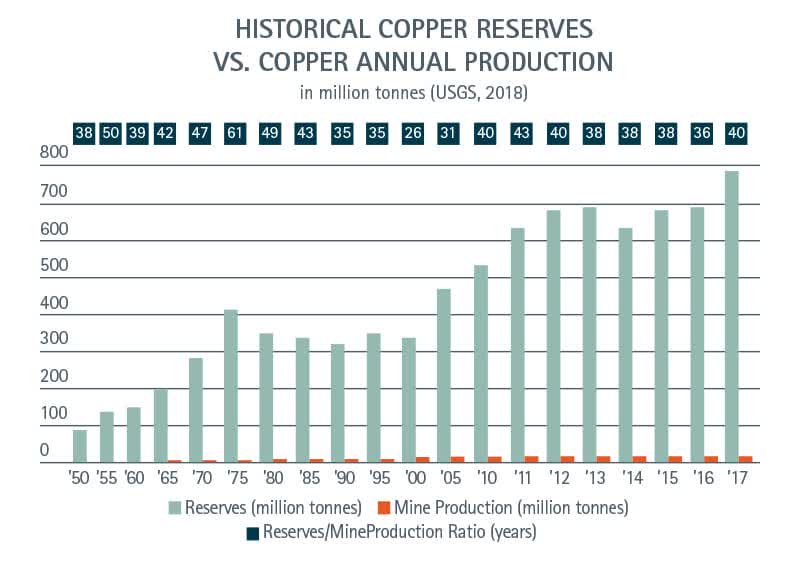
Historic copper reserves vs production (Copper Alliance)
The mismatch of supply and demand will lead to higher copper prices in the coming years. Analysis by Wood Mackenzie expects copper to reach at least $5.00/lb within 5 years. For the copper supply gap to be closed, they see the need for $23 billion per year in mine investment for the next 30 years. The current copper mine pipeline has approximately 17MMT per year of production potential. However, when accounting for the time to production and likelihood of permitting there are only 2.5MMT of supply coming soon. The remainder of the pipeline is early-stage or high-risk projects that are not guaranteed to be completed because of permitting risks, financial feasibility concerns, or a lack of funding. Copper recycling is one avenue for filling in the supply gaps, but there is insufficient recycling capacity to fill the gap. By 2050 they predict 45% of copper demand could be met by recycling.
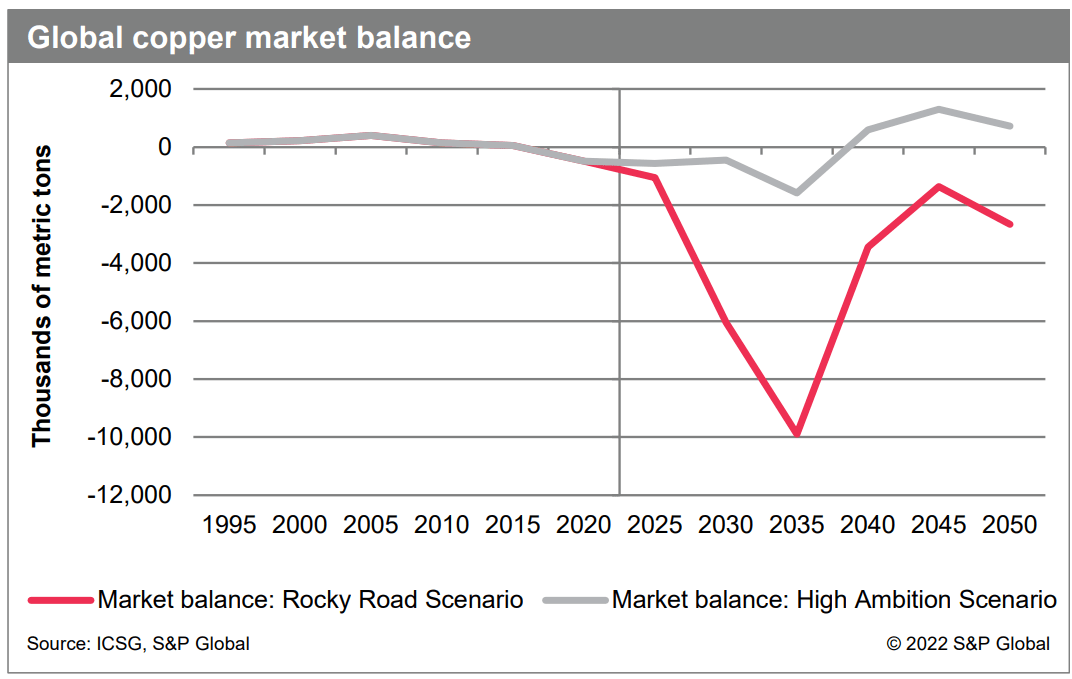
Global copper market balance (S&P Global – The Future of Copper)
Mark Bristow’s Strategy at Barrick
Mark has been at the helm of Barrick since its merger with Randgold, which Mark Founded. While most large gold mining companies use M&A as their primary growth tool, Barrick has expanded its focus on finding and developing new ore bodies. In this respect, Barrick operates as both a senior producer with multiple high production mines, and as a junior miner conducting the exploratory work necessary to identify new sites with potential. Barrick’s exploration efforts are a mix of brownfield exploration at their existing mine sites, and greenfield exploration located across Africa, and specifically in Nevada and Canada.
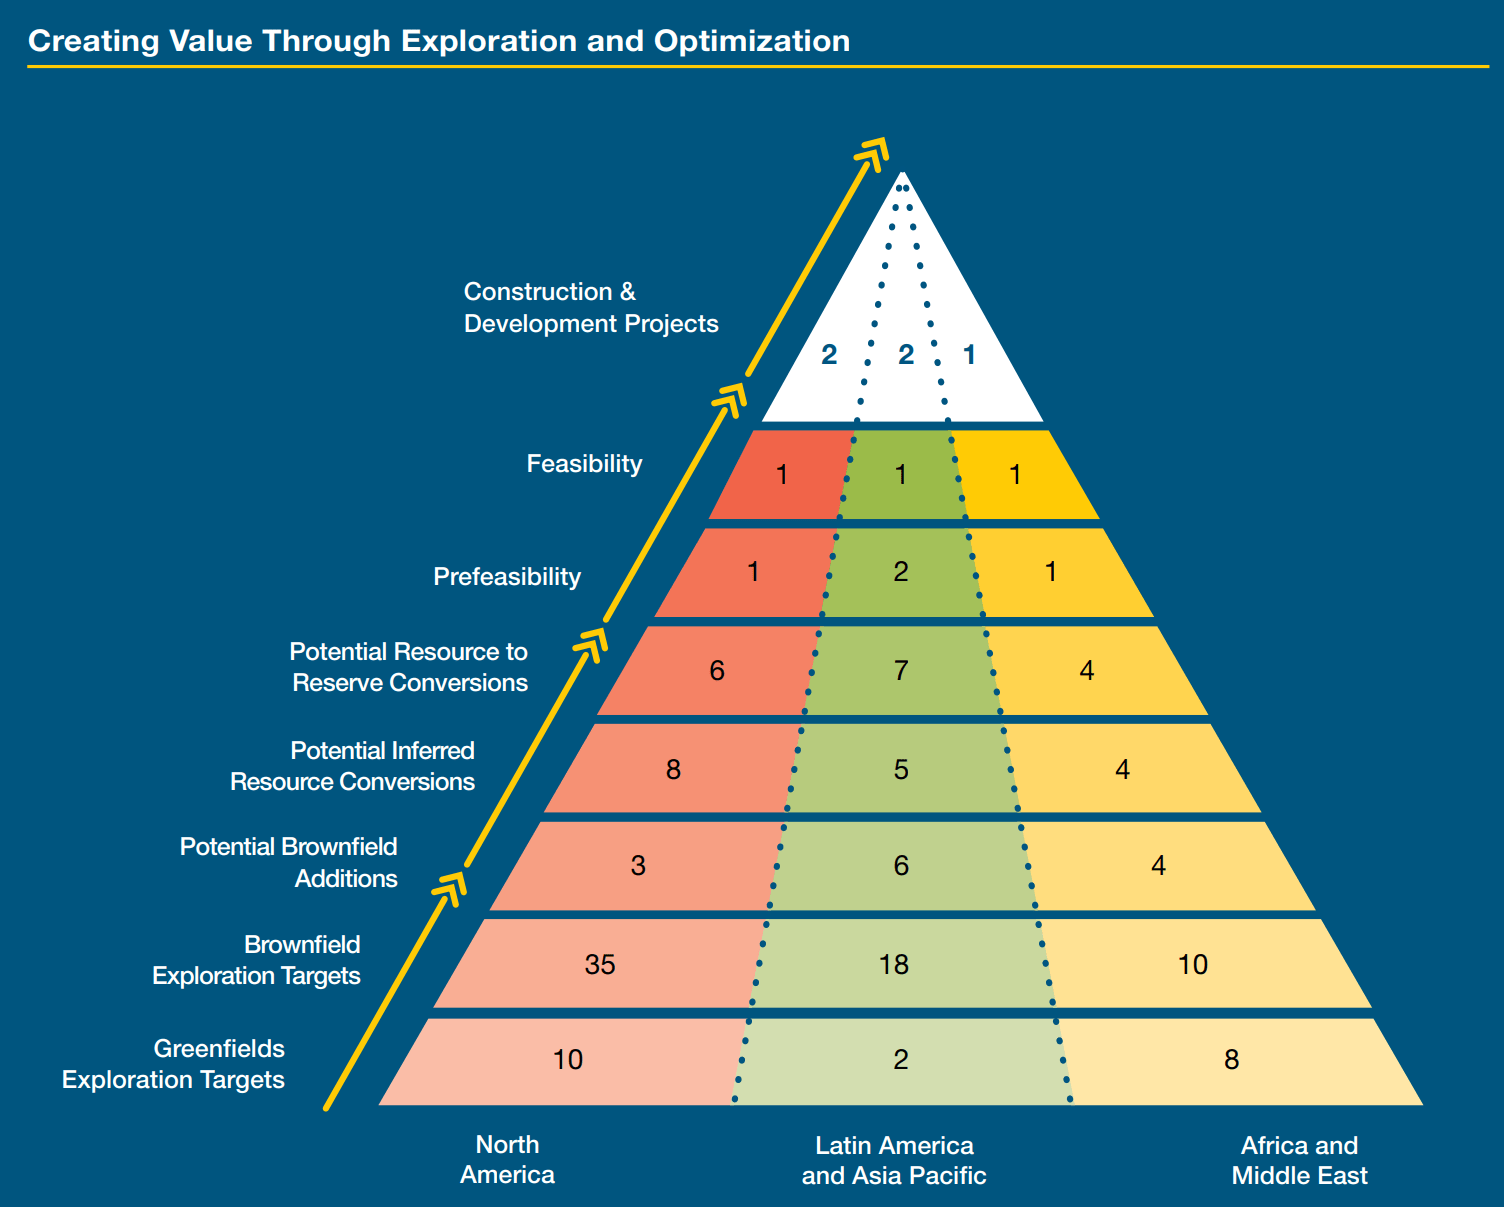
Project pipeline (Barrick 2023 Annual Report)
Focusing on exploration rather than on M&A is better for the company and investors in both the near-term and long-term. Despite taking longer, mine development is the better option because it is accretive to production. M&A on the other hand requires paying a premium for reserves without actually increasing production, it merely moves numbers from one company to another. A perfect example is when Newmont (NEM) acquired Newcrest late last year for $16.8B. The market didn’t approve of the merger due to the high premium Newmont was paying. This resulted in a steep sell off, and despite being a larger company, Newmont’s market cap is almost identical to what is was a year ago before the merger.
In an interview with Kitco Mining, Mark stated that the gold mining industry is ex-growth in terms of total gold production. For mining companies to continue to be profitable, they need to focus on extending the life of their existing mines by exploring for nearby resources. Barrick’s goal is find as much or more gold and copper each year than they mine and so far this strategy has worked, with 2023 marking the third year in a row to meet this objective.
Another differentiator for Barrick is their focus on community engagement using Community Development Committee’s that provide Barrick a direct link to community members, and help determine the community resources that Barrick can invest in. This is part of Barrick’s “social license to operate” which is their unique take on ESG. The benefits of this strategy can clearly be seen in the following quote:
And so, Mali, we have been through many challenges in Mali over the years.
I think I have been through 16 different governments and three coups. We are still operating. And we have a very strong social license in Mali. Doesn’t mean to say we don’t have challenges. And I think there is a message to the industry that that is an important component of mining today. – Mark Bristow, Q3 2023 Earnings Call.
Production, Resource Reserves, and Future Expansions
Barrick is a global mining company that is willing to work in harder jurisdictions such as the Democratic Republic of the Congo or Mali, but most of their production comes from safer regions of the world. In 2023 Barrick produced 4504 koz of gold and 420 Mlbs of copper. Production in North America was 2006 koz of gold, Latin America and Asia Pacific was 542 koz of gold, and Africa was 1506 koz of gold and 420 Mlbs of copper. Their largest mine is the Nevada Gold Mines joint venture with Newmont that generated 1865 koz which is 41% of Barrick’s total output.
Barrick’s 2023 all-in sustaining cost was $1335/oz which is higher than prior years, but it was not caused by inflation. Instead, it was due to one-time events such as a gear-box failure and conveyor belt collapse that reduced production, and higher CAPEX spending on multiple nearly complete mine expansions.
Looking ahead to 2024, Barrick expects to mine between 3900-4300 koz of gold at an AISC of $1320-$1420/oz, and 400-460 Mlbs of copper at an AISC of $3.10-$3.40/lb. Gold production is expected to be down due to lower output from underground operations in Nevada as they progress to the next ore concentration, slightly offset by greater production as Pueblo Viejo ramps up following the completion of its expansion in Q1. AISC will be elevated this year because of more project development CAPEX but will start decreasing in 2025 as more production comes online every year through at least 2030.
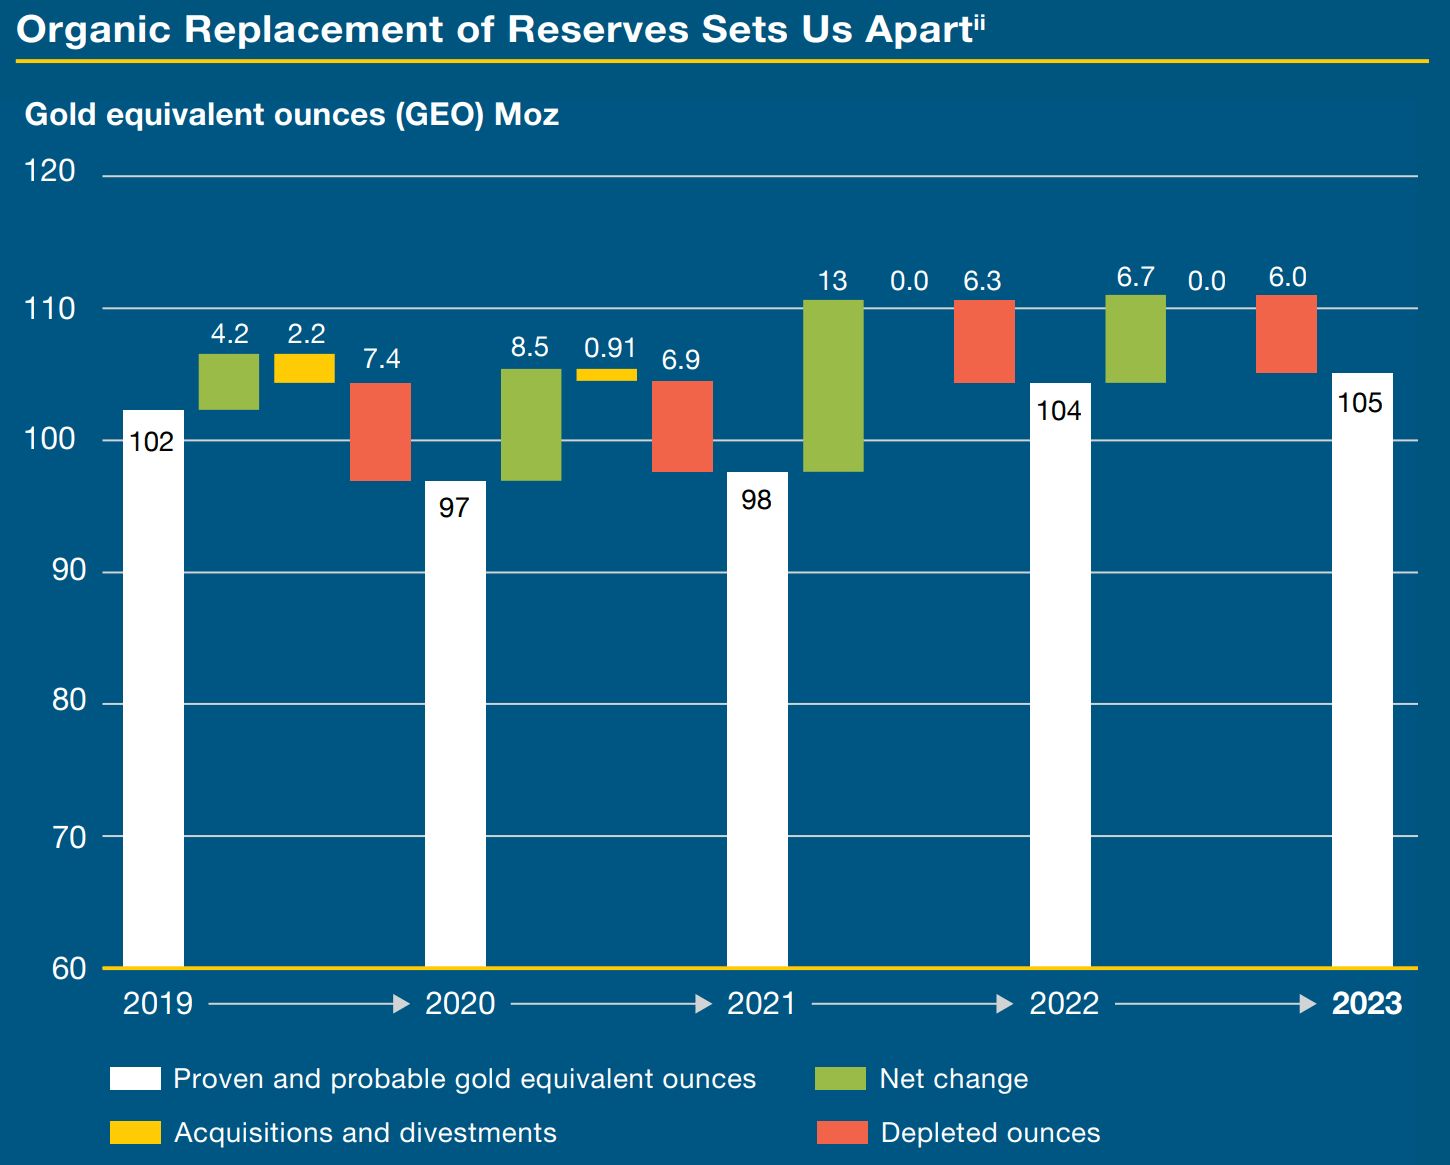
Organic reserve replacement in gold equivalent ounces (Barrick 2023 Annual Report)
Barrick continues to replace their mined ore with new reserves as seen in the chart above. Additionally, more mine capacity is coming online this year, which will ultimately be felt in 2025 and beyond as production ramps. In December, Barrick received the Record of Decision for Gold Rush in Nevada, allowing production to begin. The mine is expected to generate 130 koz in 2024 and eventually grow to 400 koz per year by 2028. The expansion at Pueblo Viejo has been completed and once repairs are made to the conveyor belt that failed, it is expected to ramp up to 800 koz per year. Finally, their Porgera mine in Papua New Guinea has just restarted after being shut down for multiple years due to a dispute with the government. Porgera is expected to produce 50-70 koz in 2024 before ramping up to 150-200 koz in 2028.
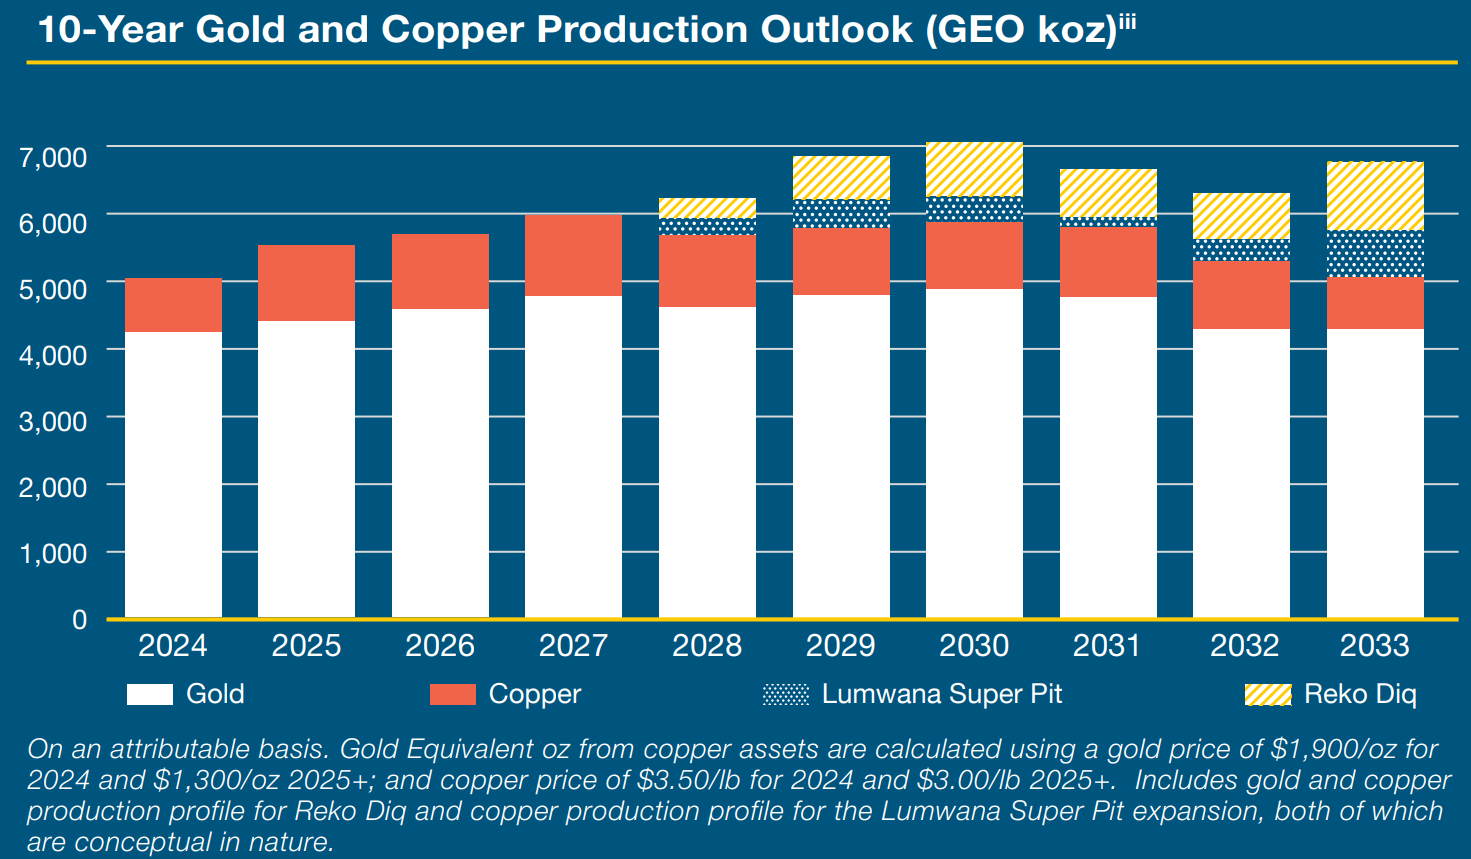
10-Year production guidance (Barrick 2023 Annual Report)
Two major upcoming mine projects that will expand Barrick’s copper position are the Super Pit expansion at Lumwana in Zambia and Reko Diq in Pakistan. Both projects are expected to start contributing to the bottom line in 2028. Until then, they are a significant driver of CAPEX spending.
Elevated Gold and Copper Prices will Boost Profitability
Though 2024 guidance seems unimpressive, elevated gold and copper prices will boost Barrick’s revenues leading to much improved EPS. The 2024 guidance is based on an assumed sales price of $1900/oz for gold and $3.50/lb for copper. For the first quarter (January through March) gold spot prices (XAUUSD:CUR) averaged $2079/oz and copper spot prices (HG1:COM) averaged $3.86/lb.
For every $100/oz change in the price of gold, Barrick's EBITDA will move by $550M, while a $0.25/lb change in copper will result in a $110M EBITDA impact. Assuming Barrick’s product sales match the average, they will have earned an additional $246M from gold and $40M from copper for Q1.
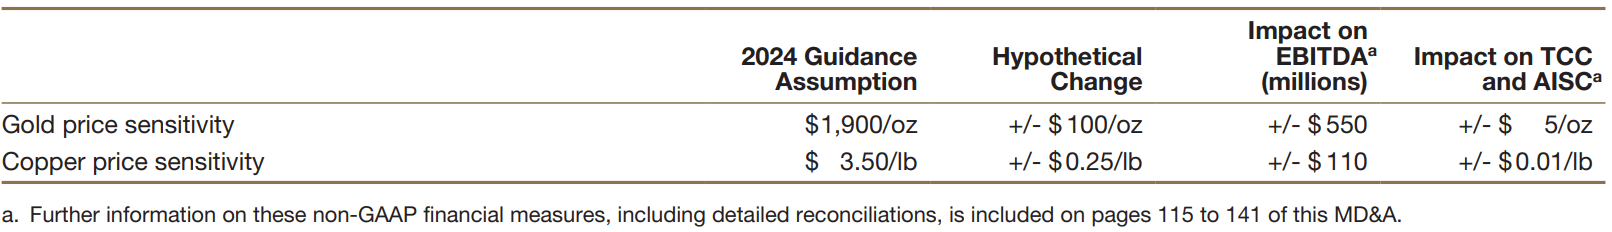
Income sensitivity to changes in commodity prices (Barrick 2023 Annual Report)
I believe that gold will be able to maintain its current rally due to strong Chinese gold purchases and doubts surrounding the Federal Reserve’s future actions. Assuming gold prices remain flat for the rest of the year at $2300/oz, Barrick could earn an additional $1650M in EBITDA. Though copper prices are more volatile, and I am not certain that they will maintain their current level, to be consistent using the present copper price of $4.25/lb would result in an extra $250M of EBITDA.
Robust Balance Sheet
Barrick has a strong balance sheet that will enable them to meet current and future business expenses, including the aforementioned expansions without the need to issue new debt. Their long-term debt has stabilized at $4.7B since 2019 following substantial debt paydown. All of Barrick’s remaining long-term debt won’t mature until 2033 and beyond. This means there is no pressure to pay or refinance at presently high rates.
With a cash and equivalents balance of $4.1B, Barrick has a net debt of only $578M. The dividend policy is tied to the level of net cash. No matter the cash level, a $0.10 per share quarterly dividend is always issued. As net cash builds, a performance dividend is added to the base per the table below. Given the elevated gold price and low net debt levels, it is highly likely the company will issue performance dividends this year, potentially as early as Q2. The board also reinstated a $1B share buyback program for 2024 which could see use this year. The 2023 buyback program was unused due to lower free cash flow.
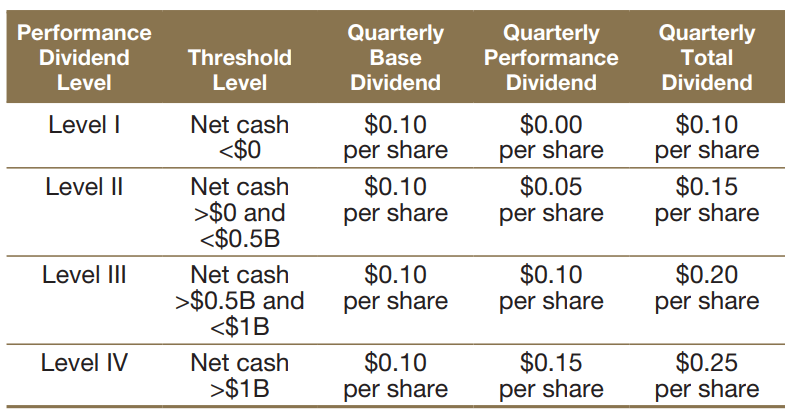
Barrick’s dividend policy (Barrick 2023 Annual Report)
Valuation
Barrick is currently trading at a 20% discount to its historical averages despite record high gold prices. Large miners such as Barrick generally command a premium valuation compared to the sector overall, but Barrick is currently valued near sector averages. Q1 results will be released next month and will mark the first quarter with sales covering the rally. Wall Street estimates for Q1 are weak following analyst downgrades prior to gold’s rally. This puts Barrick in a good position to beat earnings expectations next quarter. From Q2 and onwards, the present gold rally will be reflected in earnings results leading to even better EPS.
The value of a mining company is ultimately based on the cash flows it can generate. One way to measure this is to look at the total value of its reserves in the ground compared to its market cap. Only Proven & Probable reserves are accounted for because these are the most certain to exist. Measured, Indicated, and Inferred are lower classifications for the certainty of ore presence. Resources with a lower tier are not accounted for because they might not be financially viable to mine or might not even exist in the quantities expected.
The table below calculates the present value of reserves to be equal to $236.5B which is 7.40x the current market cap. If all reserves could be mined today, Barrick would generate approximately $85B in profit which is 2.72x the market cap.
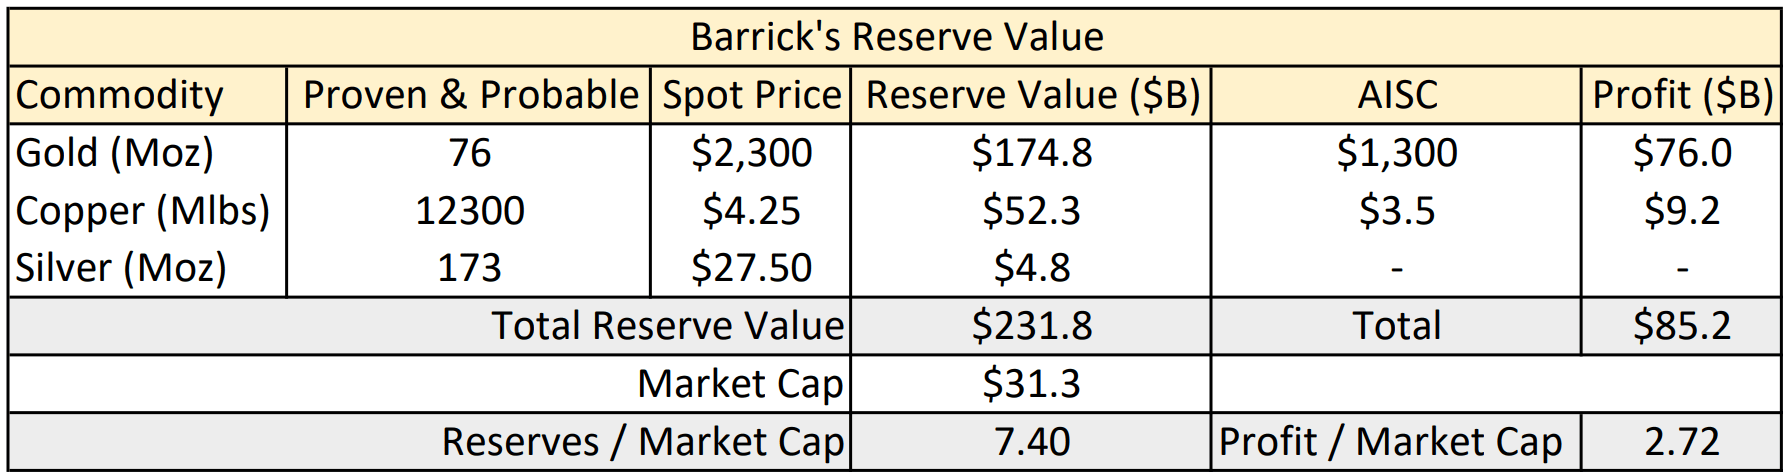
Barrick’s reserve value (Reserves from Barrick 2023 Annual Report, Calculations by Author)
Since Barrick is priced low compared to its historical valuation metrics, its large reserves, and a rising gold price I am rating Barrick a buy. I don’t have a specific price target because profitability will ultimately depend on where the price of gold goes from here. I expect it to continue to rise, but I am not going to call a specific price.
Conclusion & Risks
I believe gold will see a bull market over the coming years as the global economy adjusts to changing interest rates and emerging markets, especially China, look to de-dollarize. This will support and drive the price of gold as it has in prior economic cycles. Barrick is well positioned to benefit because higher prices will boost profitability without much impact on expenses. This should lead to higher dividend payments, share buybacks, and an overall elevated share price.
The three largest risks to gold’s rally are the strength of the dollar, actions taken by the Federal Reserve, and the People’s Bank of China. Since gold is priced in dollars, a rising dollar will lower the asking price for gold. This was seen today (April 10th) where gold fell as the US Dollar Index (DXY) rose. Comments by the Federal Reserve also sway the gold market. When the Fed is dovish, gold tends to rally. When they are more hawkish, gold drops. All signs point to a cautious but non-hawkish Fed, but Powell kept the door open for more rate hikes if inflation comes back meaningfully. The high CPI print today reiterates the need for patience and could bring back a hawkish Fed. Lastly, China’s continued gold buying spree is the most likely cause for the ongoing gold rally. If China slows their pace of purchasing, the run-up will likely stop and gold could give back some of its gains. I find it highly unlikely that China will sell any of their gold soon for the time being.