MF3d
By Danni Qiu
Introduction
China has been gradually pivoting away from being a labour-intensive manufacturing hub to becoming a leader in technology innovation. Over the last 20 years, China’s research and development (R&D) expenditure, one of the key drivers of growth in the technology industry, has become the second largest globally and has considerably narrowed the gap with the United States’ technology spend.
Transforming China into a high-tech powerhouse was one of the major themes discussed at China’s key annual political meeting, the “Two Sessions”, in 2024. With this explicit support from the government, China’s R&D expenditure is expected to further increase over the coming years.
Exhibit 1. Gross domestic spending on R&D (USD million)
Source: OECD; as of 2021.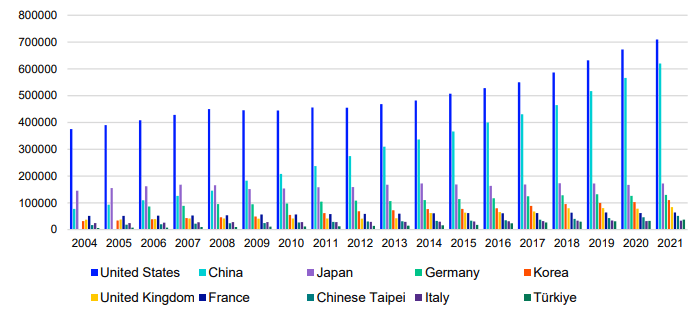
FTSE China Incl A 25% Technology Capped Index
On the back of China’s technological progression, FTSE Russell developed a number of indexing solutions to support investors seeking exposure to China’s technology industry.
The simplest offering includes an uncapped, market-cap weighted FTSE China Technology Index, designed to represent the performance of large and mid-cap Chinese technology companies. The index comprises all the constituents found in the Industry Classification benchmark (ICB) “Technology” Industry that are part of the FTSE China Index (a subset of the FTSE Global Equity Index Series commonly known as “FTSE GEIS”), which covers all available China share classes across A Shares, B Shares, H Shares, Red Chips, P Chips, S Chips, and N Shares. Aligned with the methodology of the FTSE GEIS, a 25% inclusion factor is applied to the A shares in the FTSE China Technology Index, an index that has historically been highly correlated with the FTSE China Index (over 90%) over the short, medium, and long term.
FTSE Russell also provides a more diversified, capped version of the FTSE China Technology Index – the FTSE China Incl A 25% Technology Capped Index. The “25%” in the index name refers to the A Share inclusion factor currently applied to the index. Both capped and uncapped indices are subject to FTSE Russell’s treatments of Foreign Ownership Limits (FOL)1 and sanctioned stocks2 . They also share the same list and weight ranking of constituents. The share class distribution of the FTSE China Incl A 25% Technology Capped Index is as follows:
Exhibit 2. Share classes breakdown (%)

The capping methodology
FTSE China Incl A 25% Technology Capped Index follows a multi-stage capping methodology: Stage 1 Any companies whose weights are greater than 10% are capped at 10%, with excess weights distributed to the remaining constituents. This process is repeated until there are no constituent weights exceeding 10%. After stage 1, if the total index weight of companies whose individual weights exceed 5% is greater than 40% in aggregate, the procedure moves onto stage 2.
Stage 2: The second to sixth-largest company will be capped at 9%, 8%, 7%, 6% and 4% accordingly. At each applied capping, the weights of the remaining uncapped companies are increased correspondingly. The capping process will stop once the 40% aggregate limit is no longer being breached.
Stage 3: If the aggregate 40% threshold is still breached following the application of stage 2, stage 2 is repeated to apply further required capping.
Less concentration risk
The Chinese technology industry has developed rapidly over the past decade. Tech giants such as Tencent (OTCPK:TCEHY), PDD (PDD) and Meituan have gradually grown and now dominate the market.
By the end of March 2024, Tencent alone accounted for approximately half of the uncapped FTSE China Technology Index, resulting in substantial single company concentration risk.
This concentration risk was acutely seen on 22 December 2023 following a regulatory proposal change to the gaming industry. Tencent slumped by 12.4% on the day, triggering a 7.4% retreat of the FTSE China Technology Index. The FTSE China Incl A 25% Technology Capped Index, on the other hand, protected by the diversification of a capped index solution, only declined by 3.4% on the day.
This would suggest that the capping mechanism significantly improves the diversification of the FTSE China Incl A 25% Technology Capped Index and can help investors better manage single stock risk.
| Company Name | ICB Subsector | FTSE China Incl A 25% Technology Capped Index | FTSE China Technology Index |
| Tencent Holdings (P Chip) | Consumer Digital Services | 11.08% | 49.50% |
| PDD Holdings Inc ADS (N Shares) | Consumer Digital Services | 9.35% | 14.53% |
| Meituan-Dianping (P Chip) (MEIT) | Consumer Digital Services | 9.00% | 13.67% |
| Baidu (P Chip) (BIDU, [[BAIDF]) | Consumer Digital Services | 7.36% | 6.08% |
| Kuaishou Technology (P Chip) (OTCPK:KUASF, OTCPK:KSHTY) | Consumer Digital Services | 6.21% | 3.39% |
| Sunny Optical Technology (Group) (P Chip) (OTCPK:SNPTF, OTCPK:SOTGY) | Electronic Components | 3.05% | 0.69% |
| Kingdee International Software Group (P Chip) (OTCPK:KGDEF, OTCPK:KGDEY) | Software | 3.05% | 0.68% |
| Bilibili (P Chip) (BILI, OTCPK:BLBLF) | Consumer Digital Services | 2.45% | 0.55% |
| Kingsoft Corporation (P Chip) (OTCPK:KSFTF) | Software | 2.43% | 0.55% |
| Autohome ADS (N Shares) (ATHM) | Consumer Digital Services | 1.45% | 0.33% |
| Total | 55.41% | 89.97% |
| Source: FTSE Russell; as of 29 March 2024 |
Additionally, the capping methodology behind the index allows the FTSE China Incl A 25% Technology Capped Index to enjoy a more diversified ICB Subsector profile. Many of the largest Chinese technology companies (including eight out of the top 10 constituents) are from the Consumer Digital Services ICB Subsector. This subsector accounts for approximately 90% of the uncapped FTSE China Technology Index, but only 51% of the FTSE China Incl A 25% Technology Capped Index.
Exhibit 4. ICB subsector
Source: FTSE Russell; as of 29 March 2024.
Lower volatility
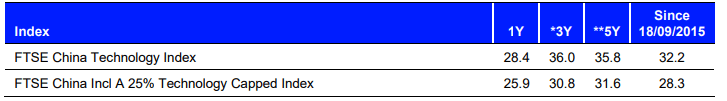
With its more diversified weight composition, the FTSE China Incl A 25% Technology Capped Index has historically displayed a lower annualized volatility than the FTSE China Technology Index over different economic cycles. In fact, volatility has been consistently lower for the FTSE China Incl A 25% Technology Capped Index when comparing data over the short, medium and long term.
Exhibit 5. Volatility (%pa)
Top holdings change
The top holdings of the FTSE China Incl A 25% Technology Capped Index have changed significantly since its launch in March 2019, as China has advanced its technological development and the technology industry as a whole has continued to evolve.
Tencent, Baidu, Sunny Optical and Autohome are the only four companies that still remain in the top 10 from the original composition on launch day.
While the reclassification of Alibaba and NetEase to Consumer Discretionary industries has led to their exclusions from the index, delisting, sanctioned stock treatment, and price movement have also caused composition and/or ranking changes. Meanwhile, Kuaishou Technology, which was listed in 2021, has climbed the rankings to occupy the fifth spot in the index as at the end of March 2024.
Exhibit 6. Top holdings at index launch 18/03/2019
Constituent Name | % Weight in Index | Rank in the current Index |
Tencent Holdings (P Chip) | 10.22% | #1 |
Alibaba Group Holding ADS (N Shares) (BABA) | 8.99% | Excluded, industry reclassified |
Baidu ADS (N Shares) | 8.05% | #4 |
NetEase ADR (N Shares) (NTES) | 7.23% | Excluded, industry reclassified |
Sunny Optical Technology Group (P Chip) | 6.11% | #6 |
Autohome ADS (N Shares) | 4.33% | #10 |
58.com ADS (N Shares) | 4.02% | Excluded, delisted |
Momo ADS (N Shares) | 3.53% | Excluded, drop to small cap |
Hangzhou Hikvision Digital Technology (A) (SC SZ) | 3.51% | Excluded, sanctioned stock treatment |
YY ADS (N Shares) | 3.31% | #22 |
Sum | 59.30% |
Source: FTSE Russell.
Exhibit 7. Top holdings as of 29/03/2024
Constituent Name | % Weight in Index | Rank at index launch |
Tencent Holdings (P Chip) | 11.08% | #1 |
PDD Holdings Inc ADS (N Shares) | 9.35% | #15 |
Meituan-Dianping (P Chip) | 9.00% | #12 |
Baidu (P Chip) | 7.36% | #3 |
Kuaishou Technology (P Chip) | 6.21% | IPO in 2021 |
Sunny Optical Technology Group (P Chip) | 3.05% | #5 |
Kingdee International Software Group (P Chip) | 3.03% | Small Cap in 2019 |
Bilibili (P Chip) | 2.45% | Small Cap in 2019 |
Kingsoft Corp (P Chip) | 2.43% | #16 |
Autohome ADS (N Shares) | 1.45% | #6 |
Sum | 55.41% |
Source: FTSE Russell.
Undervaluation of the technology industry
Over the past few years, China’s tech sector has faced a series of challenges as the Chinese government has intensified regulation in the sector to address certain companies’ unchecked growth and monopolistic behaviour. These regulations have led to a deep slide in the valuations of Chinese tech companies.
At the end of March 2024, the trailing 12-month P/E ratio of the FTSE China Incl A 25% Technology Capped Index was at 25.6x, below its 10-year average at 28.2x. The figure is also way under the P/E ratio of 36.1x the index tracking technology industry in the US (referencing the FTSE USA Technology Index).
However, Beijing’s approach has started to moderate on the tech companies. With China’s transformation into a high-tech powerhouse representing a major agenda item in this year’s “Two
Sessions” political meeting, Beijing may be signalling a reduction in its tech industry monitoring. Paired with the broader undervaluation of the China’s technology industry, the FTSE China Incl A 25%
Technology Capped Index provides investors with access to opportunities that may capture this industry’s growth potential.
March index review – constituent update
In the quarterly index review that took place in March 2024, the following changes were made to the FTSE China Incl A 25% Technology Capped Index:
- Additions: Kingboard Laminates Holdings (P Chip) (OTCPK:KGBLF), Hygon Information Technology (A), iSoftStone Information Technology (Group) (A), Shenzhen Longsys Electronics (A), Guobo Electronics (A), Jiangsu Pacific Quartz (A) and Vanchip (Tianjin) Technology (A)
- Deletions: Wuhan Guide Infrared (A), Ming Yuan Cloud Group Holdings (P Chip), East Group (A), Hongfa Technology (A) and MOG Digitech Holdings (P Chip)
- Capping: Tencent Holdings (P Chip), PDD Holdings Inc ADS (N Shares) and Meituan Dianping (P Chip) were re-capped at 10%, 9%, 8% respectively
Conclusion
Focusing China’s economic model on technology development is proving to be a long-term trend in the country. The current undervaluation of China’s technology industry may provide investors with a good entry point.
When compared with the uncapped FTSE China Technology Index, the capping methodology applied to the FTSE China Incl A 25% Technology Capped Index results in an index that has the benefit of less concentration risk and lower volatility. These features allow the FTSE China Incl A 25% Technology Capped Index to be more defensive during volatile macroeconomic periods by mitigating the impact of a falling market relative to the uncapped index, while maintaining the upside potential for investors on a rising market.
Disclaimer
© 2024 London Stock Exchange Group plc and its applicable group undertakings (“LSEG”). LSEG includes (1) FTSE International Limited (“FTSE”), (2) Frank Russell Company
(“Russell”), (3) FTSE Global Debt Capital Markets Inc. and FTSE Global Debt Capital Markets Limited (together, “FTSE Canada”), (4) FTSE Fixed Income Europe Limited (“FTSE FI Europe”), (5) FTSE Fixed Income LLC (“FTSE FI”), (6) FTSE (Beijing) Consulting Limited (“WOFE”) (7) Refinitiv Benchmark Services (UK) Limited (“RBSL”), (8) Refinitiv Limited (“RL”) and (9) Beyond Ratings S.A.S. (“BR”). All rights reserved.
FTSE Russell® is a trading name of FTSE, Russell, FTSE Canada, FTSE FI, FTSE FI Europe, WOFE, RBSL, RL, and BR. “FTSE®” “Russell®”, “FTSE Russell®”, “FTSE4Good®”, “ICB®”, “Refinitiv”, “Beyond Ratings®”, “WMRTM”, “FRTM” and all other trademarks and service marks used herein (whether registered or unregistered) are trademarks and/or service marks owned or licensed by the applicable member of LSEG or their respective licensors and are owned, or used under licence, by FTSE, Russell, FTSE Canada, FTSE FI, FTSE FI Europe, WOFE, RBSL, RL or BR. FTSE International Limited is authorised and regulated by the Financial Conduct Authority as a benchmark administrator. Refinitiv Benchmark Services (UK) Limited is authorised and regulated by the Financial Conduct Authority as a benchmark administrator.
All information is provided for information purposes only. All information and data contained in this publication is obtained by LSEG, from sources believed by it to be accurate and reliable. Because of the possibility of human and mechanical inaccuracy as well as other factors, however, such information and data is provided "as is" without warranty of any kind. No member of LSEG nor their respective directors, officers, employees, partners or licensors make any claim, prediction, warranty or representation whatsoever, expressly or impliedly, either as to the accuracy, timeliness, completeness, merchantability of any information or LSEG Products, or of results to be obtained from the use of LSEG products, including but not limited to indices, rates, data and analytics, or the fitness or suitability of the LSEG products for any particular purpose to which they might be put. The user of the information assumes the entire risk of any use it may make or permit to be made of the information.
No responsibility or liability can be accepted by any member of LSEG nor their respective directors, officers, employees, partners or licensors for (A) any loss or damage in whole or in part caused by, resulting from, or relating to any inaccuracy (negligent or otherwise) or other circumstance involved in procuring, collecting, compiling, interpreting, analysing, editing, transcribing, transmitting, communicating or delivering any such information or data or from use of this document or links to this document or (B) any direct, indirect, special, consequential or incidental damages whatsoever, even if any member of LSEG is advised in advance of the possibility of such damages, resulting from the use of, or inability to use, such information.
No member of LSEG nor their respective directors, officers, employees, partners or licensors provide investment advice and nothing in this document should be taken as constituting financial or investment advice. No member of LSEG nor their respective directors, officers, employees, partners or licensors make any representation regarding the advisability of investing in any asset or whether such investment creates any legal or compliance risks for the investor. A decision to invest in any such asset should not be made in reliance on any information herein. Indices and rates cannot be invested in directly. Inclusion of an asset in an index or rate is not a recommendation to buy, sell or hold that asset nor confirmation that any particular investor may lawfully buy, sell or hold the asset or an index or rate containing the asset. The general information contained in this publication should not be acted upon without obtaining specific legal, tax, and investment advice from a licensed professional.
Past performance is no guarantee of future results. Charts and graphs are provided for illustrative purposes only. Index and/or rate returns shown may not represent the results of the actual trading of investable assets. Certain returns shown may reflect back-tested performance. All performance presented prior to the index or rate inception date is back-tested performance. Back-tested performance is not actual performance, but is hypothetical. The back-test calculations are based on the same methodology that was in effect when the index or rate was officially launched. However, back-tested data may reflect the application of the index or rate methodology with the benefit of hindsight, and the historic calculations of an index or rate may change from month to month based on revisions to the underlying economic data used in the calculation of the index or rate.
This document may contain forward-looking assessments. These are based upon a number of assumptions concerning future conditions that ultimately may prove to be inaccurate. Such forward-looking assessments are subject to risks and uncertainties and may be affected by various factors that may cause actual results to differ materially. No member of LSEG nor their licensors assume any duty to and do not undertake to update forward-looking assessments.
No part of this information may be reproduced, stored in a retrieval system or transmitted in any form or by any means, electronic, mechanical, photocopying, recording or otherwise, without prior written permission of the applicable member of LSEG. Use and distribution of LSEG data requires a licence from LSEG and/or its licensors.