NiseriN
A few months ago, I wrote a cautious article on the NXG NextGen Infrastructure Income Fund (NYSE:NXG), warning that the fund's performance has been historically poor and that it has been paying more than it earns. Since my article, the NXG fund has returned over 27%, serving your author some humble pie (Figure 1).
Figure 1 - NXG has returned 27% since January (Seeking Alpha)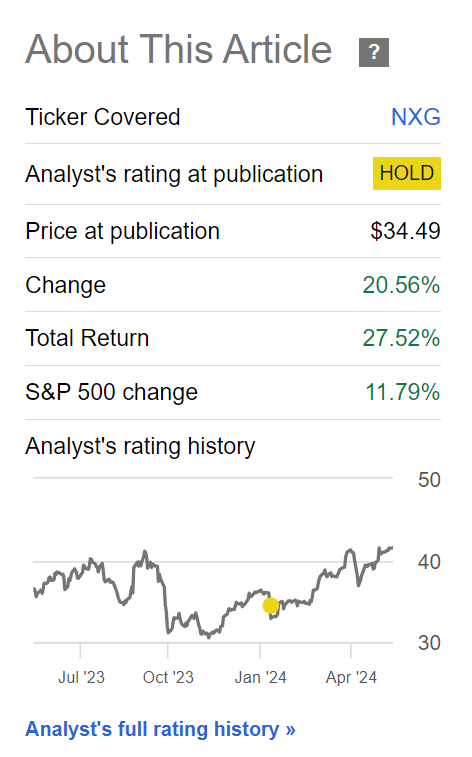
Were my concerns invalid, and if so, do I change my view of the NXG fund?
After reviewing the fund's performance, I believe NXG has benefited from a closing of the fund's discount to net asset value and a reallocation of the fund into riskier sectors like energy E&Ps and crypto miners.
While performance has been strong in the short term, it does not change the fact that the NXG fund has massively underperformed other infrastructure funds over the long run. I continue to recommend investors avoid this fund.
Brief Fund Overview
The NXG NextGen Infrastructure Income Fund is a closed-end fund ("CEF") aiming to provide high total returns from a portfolio of equity and debt securities of infrastructure companies (Figure 2). NXG has a fairly broad definition of what constitutes 'infrastructure', including renewable energy infrastructure, data centers, energy pipelines, and toll roads.
Figure 2 - NXG has a broad definition of 'infrastructure' (NXG factsheet)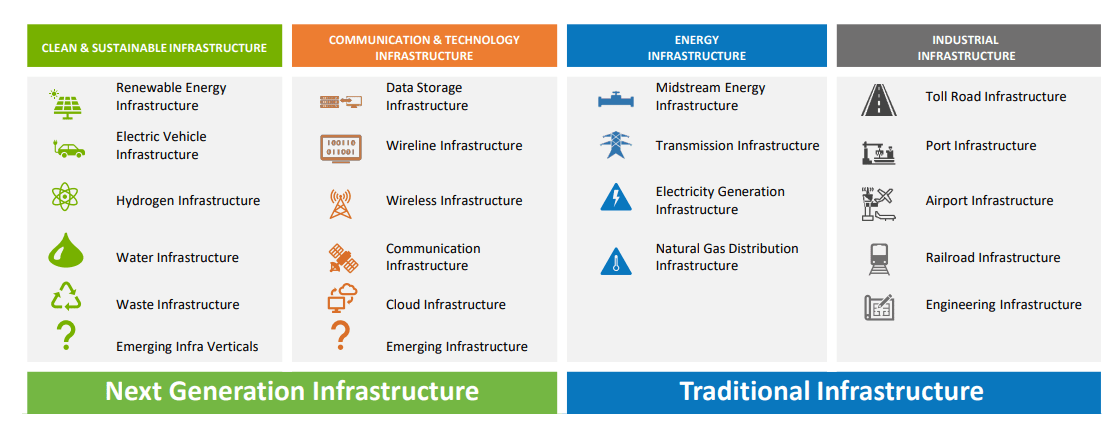
Discount Closed, Now What?
It is important to note that much of NXG's strong performance in the past year is not supported by net asset value ("NAV") returns, as the NXG fund has rallied 3.4%/21.5%/18.2%/26.3% respectively on a market price basis in the past 1mo/3mo/YTD/1yr to April 30, 2024, but NAV returns were only -1.9%/13.4%/11.2%/1.2% (Figure 3).
Figure 3 - NXG historical returns (morningstar.com)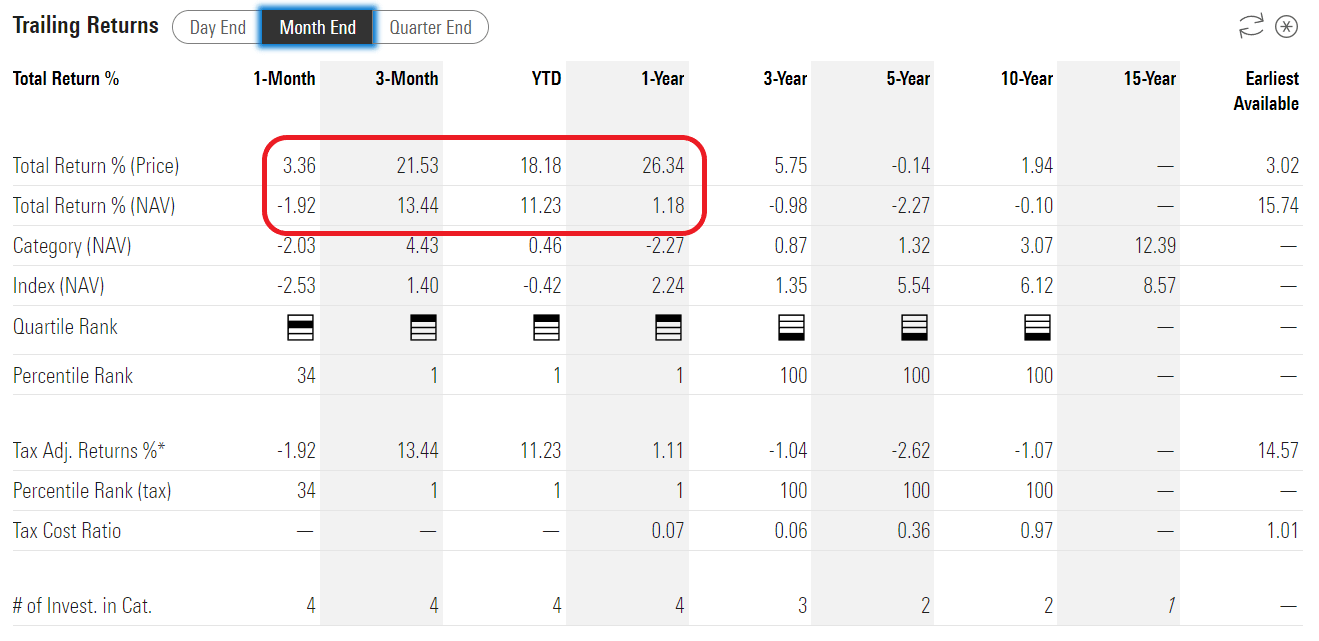
The primary driver of NXG's performance was the fund's discount to NAV, which narrowed from a historically wide 25% in early 2023 to ~8% today (Figure 4).
Figure 4 - NXG discount to NAV (cefconnect.com)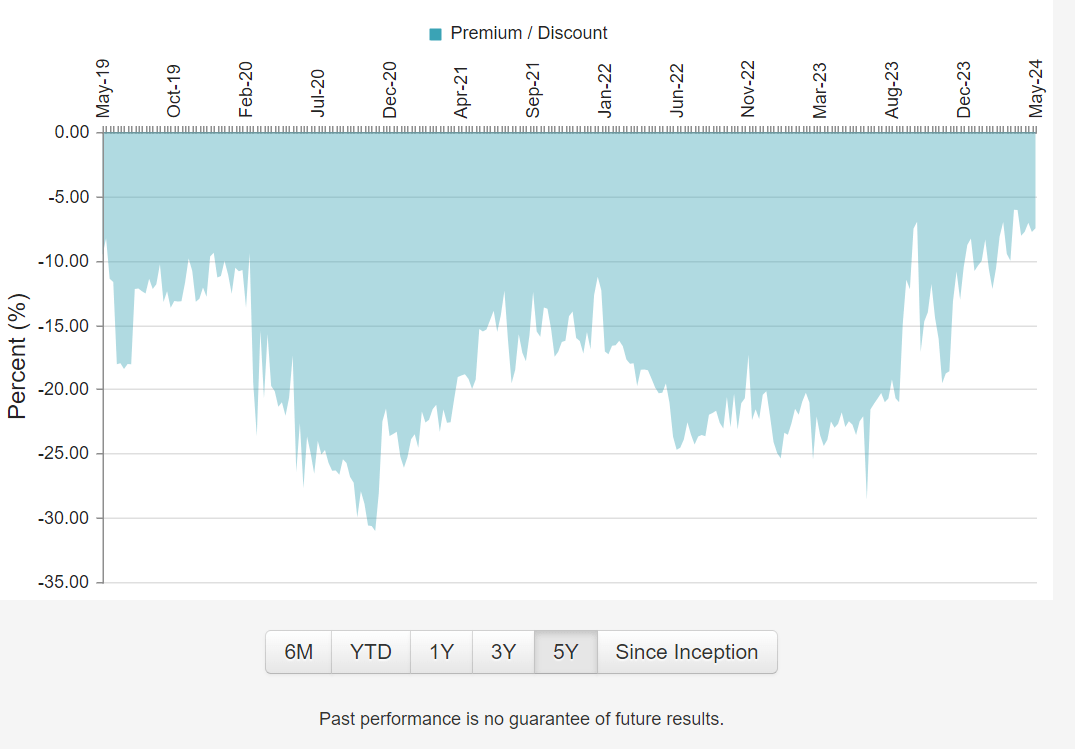
With the discount normalized, the question is, now what? Looking forward, investors may no longer benefit from a further closing of the discount to NAV, since historically, the NXG fund has traded at an average of 5-10% discount to its NAV (Figure 5).
Figure 5 - NXG discount to NAV has averaged 5-10% (nxgim.com)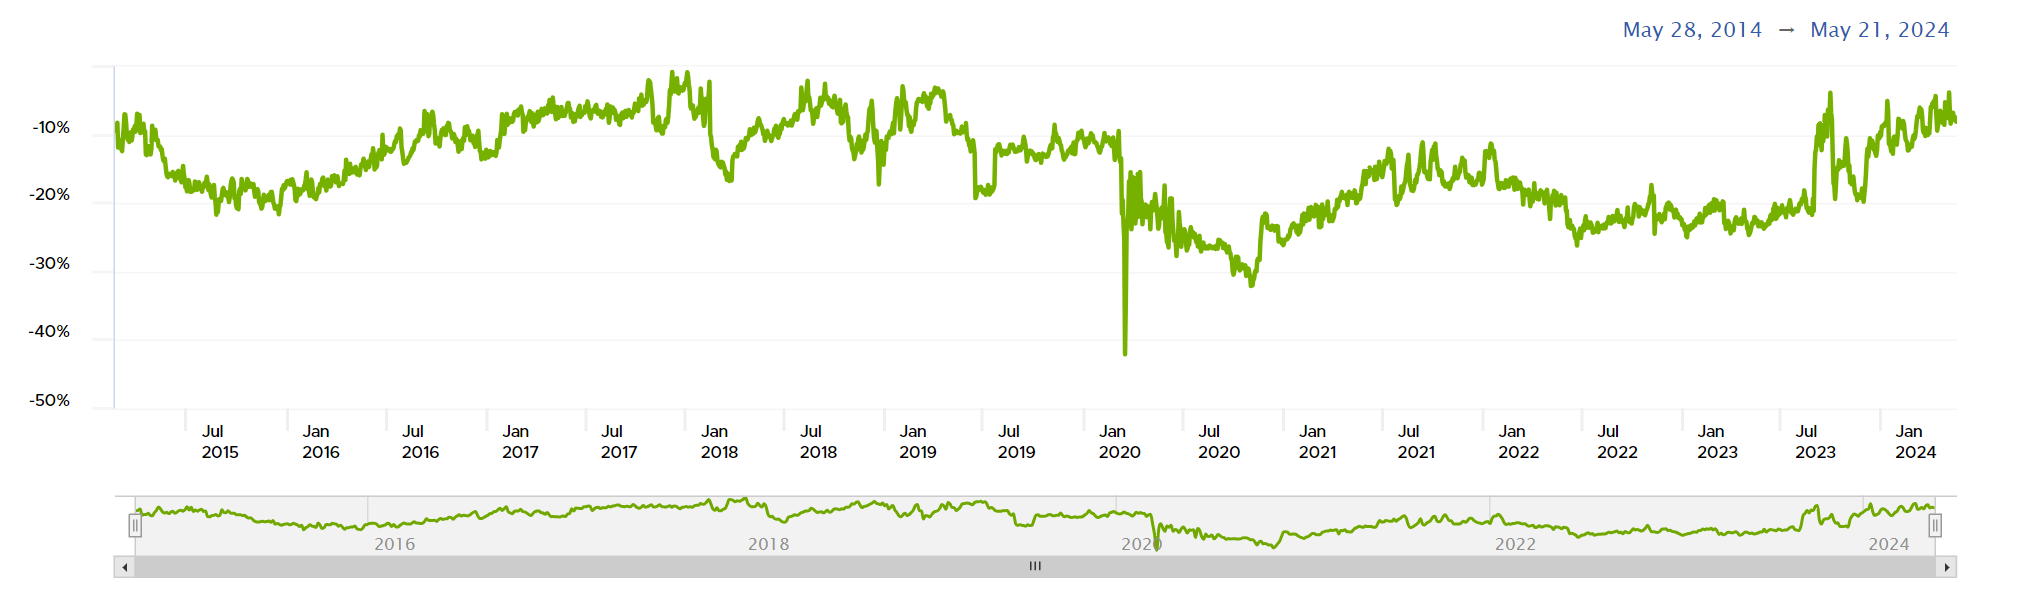
NXG Lags On NAV Returns
Speaking of NAV returns, it is worth highlighting that the passive ETF that I compared NXG to, the Alerian MLP ETF (AMLP), has returned -1.1%/7.6%/12.4%/30.0% on a 1mo/3mo/YTD/1yr timeframe to April 30, 2024 (Figure 6).
Figure 6 - AMLP historical returns (morningstar.com)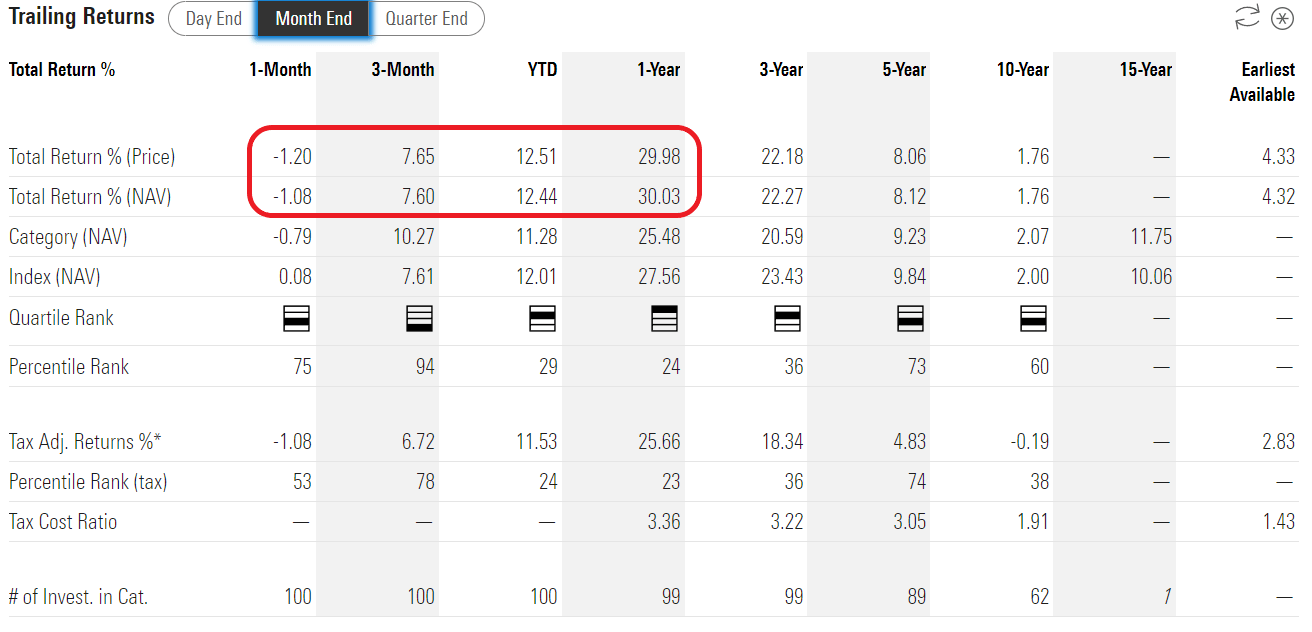
So aside from the relatively brief YTD bounce in NXG's performance, the NXG fund is still underperforming the AMLP ETF to the tune of 29% on a 1-year basis, 23% on a 3-year basis, and 10% on a 5-year basis.
What Has Driven YTD Performance?
What has caused NXG's strong YTD performance? Although the fund does not provide a returns decomposition, we can see that the NXG fund's allocation has moved considerably more 'risk-on' in the past few months.
Comparing the fund's portfolio from November 30, 2023 (last annual report) to March 31, 2024, the allocation to Large Cap Diversified C-Corps (i.e., Enbridge, Pembina) has been reduced from 26.6% to 21.3% while the fund has added more aggressive energy E&Ps to the tune of 5.1%. Cloud Services have gone from 0.8% to 3.2%, and the NXG fund has even added small allocations to Cybersecurity (2.6%) and Cryptocurrency Miners (1.3%) (Figure 7).
Figure 7 - NXG has gone 'risk on' (nxgim.com)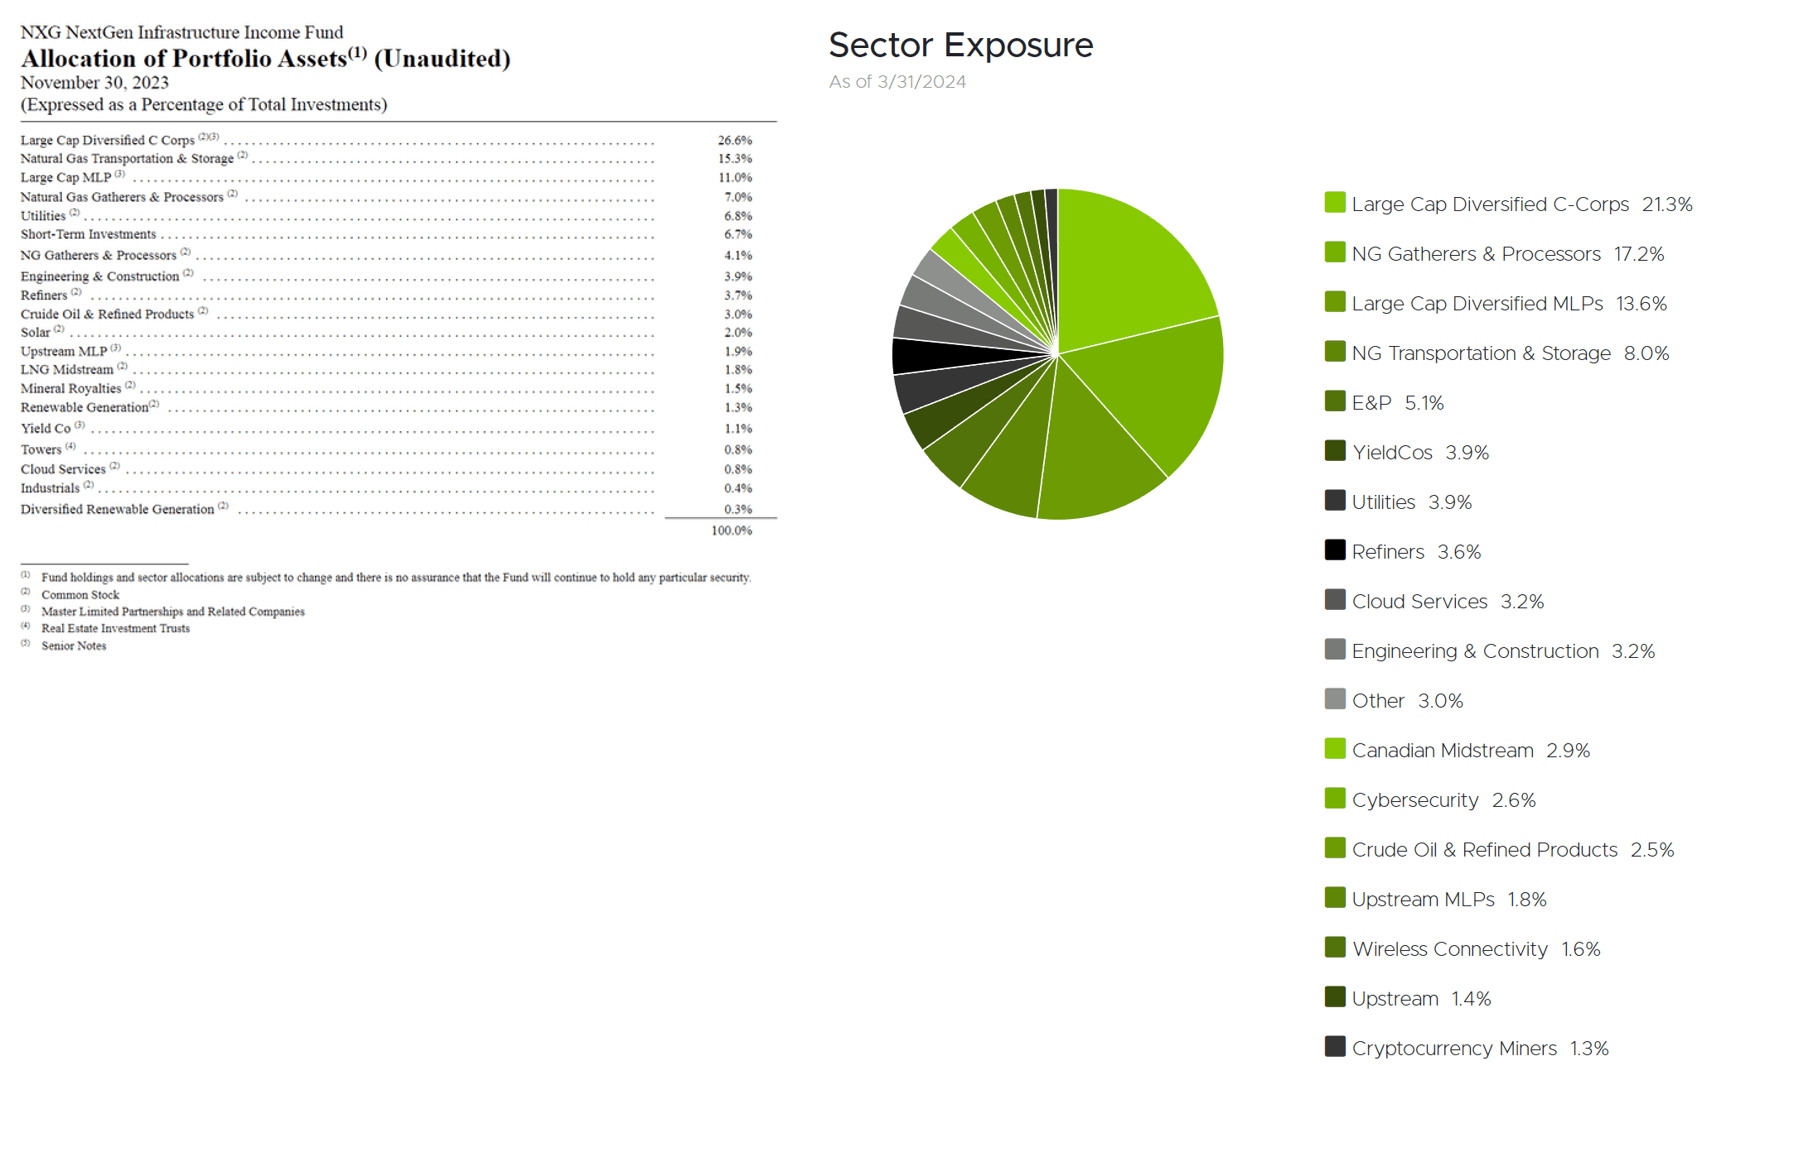
Obviously, these 'riskier' investments have worked out well in the past few months as equity markets are making new daily all-time highs and investor risk appetites are strong. For example, the SPDR S&P Oil & Gas Exploration & Production ETF (XOP) and the Amplify Transformational Data Sharing ETF (BLOK) returned 14% and 22% respectively in the first quarter of 2024 (Figure 8).
Figure 8 - XOP and BLOK YTD returns (Seeking Alpha)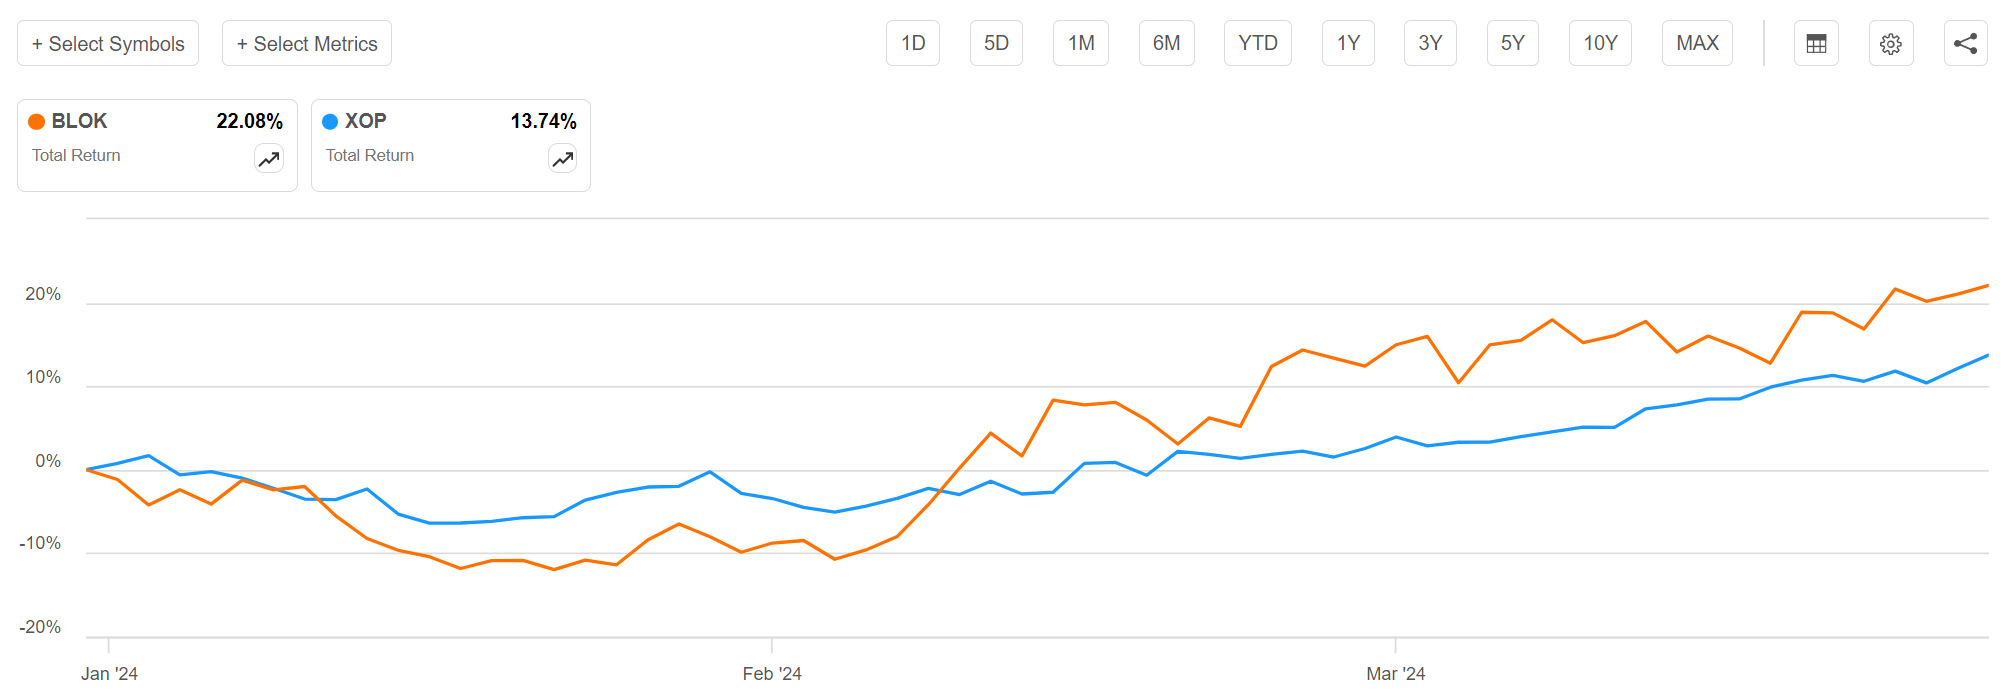
However, when measured from their respective recent peaks, the XOP is still 6% lower than in June 2022 while the BLOK ETF is down 38% from November 2021, showing how volatile these sectors can be.
Referring to Figure 2 above, the managers have given themselves lots of latitude on what constitutes 'infrastructure' investments. However, investors should ask whether allocations to crypto-miners and cyclical E&Ps fit the fund's 'infrastructure' mandate and their expectations for returns and risk.
Re-iterate Warning On Unfunded Distribution
In my opinion, what has likely spurred the closing of NXG's discount to NAV could be the fund's distribution, which was doubled last September from $0.27 / month to $0.54 / month, for a 15.6% forward distribution yield.
However, as I detailed in my last article, NXG's distribution is not entirely funded out of investment income. Instead, the NXG fund uses a high proportion of 'return of capital' ("ROC") to fund its distribution (Figure 9). Essentially, the fund pays investors a high distribution yield from their own capital.
Figure 9 - NXG uses a lot of ROC to fund its distribution (NXG annual report)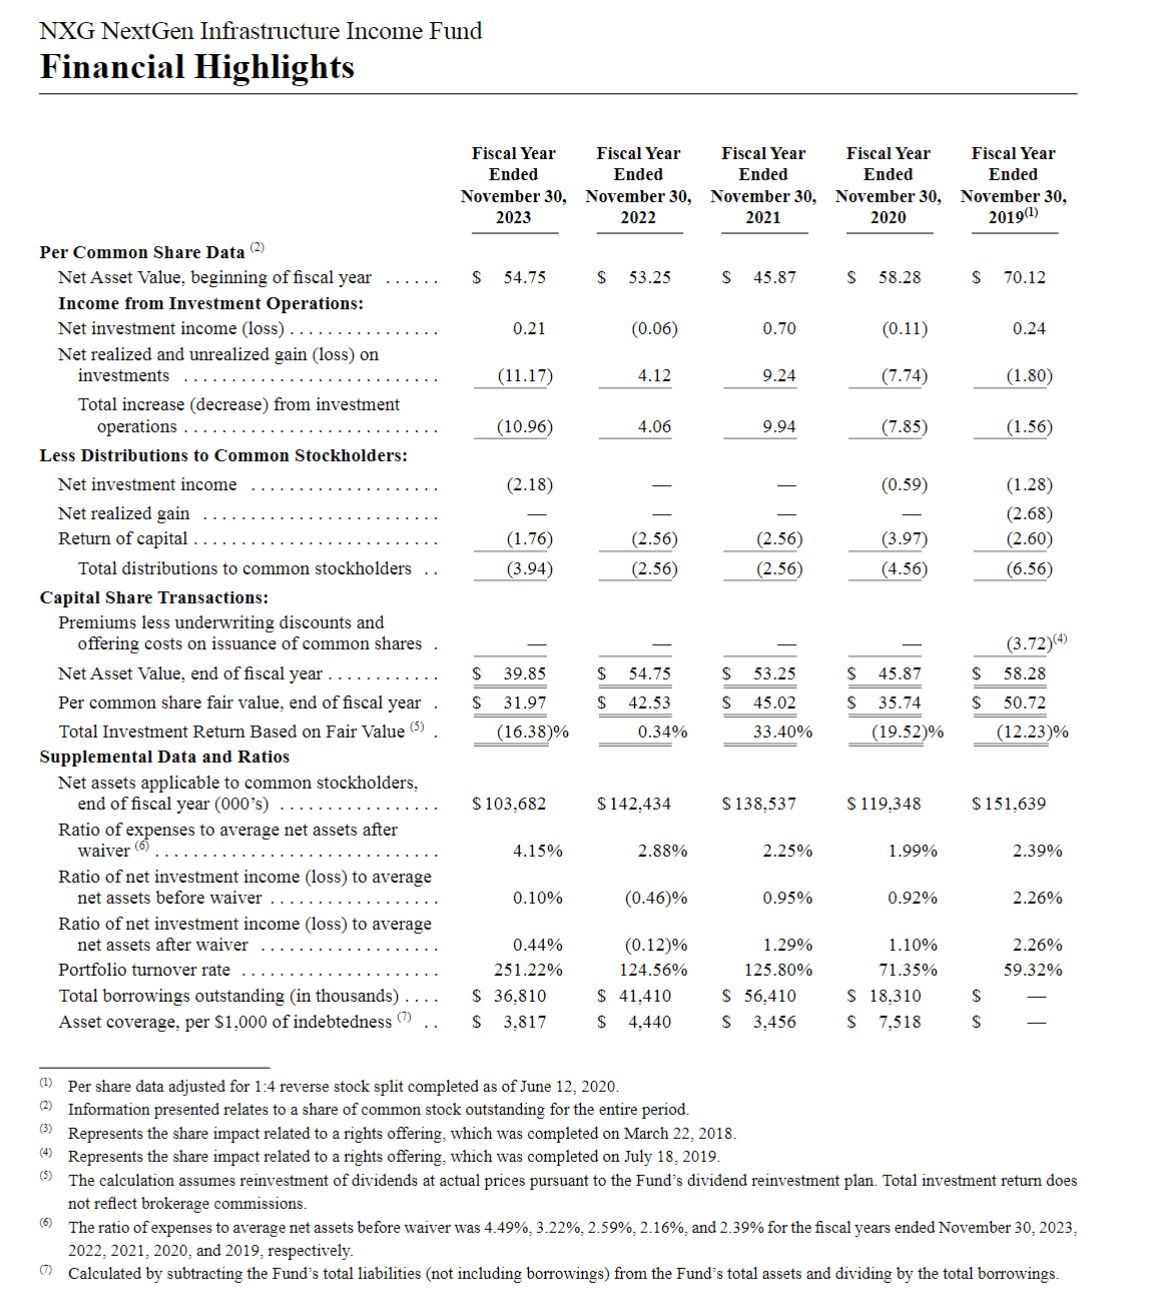
When done properly, using ROC to fund distributions may have tax advantages. However, when the distribution rate is far above a fund's long-term earnings power like the NXG fund, we end up with a fund with an amortizing NAV problem (Figure 10).
Figure 10 - NXG has an amortizing NAV problem (morningstar.com)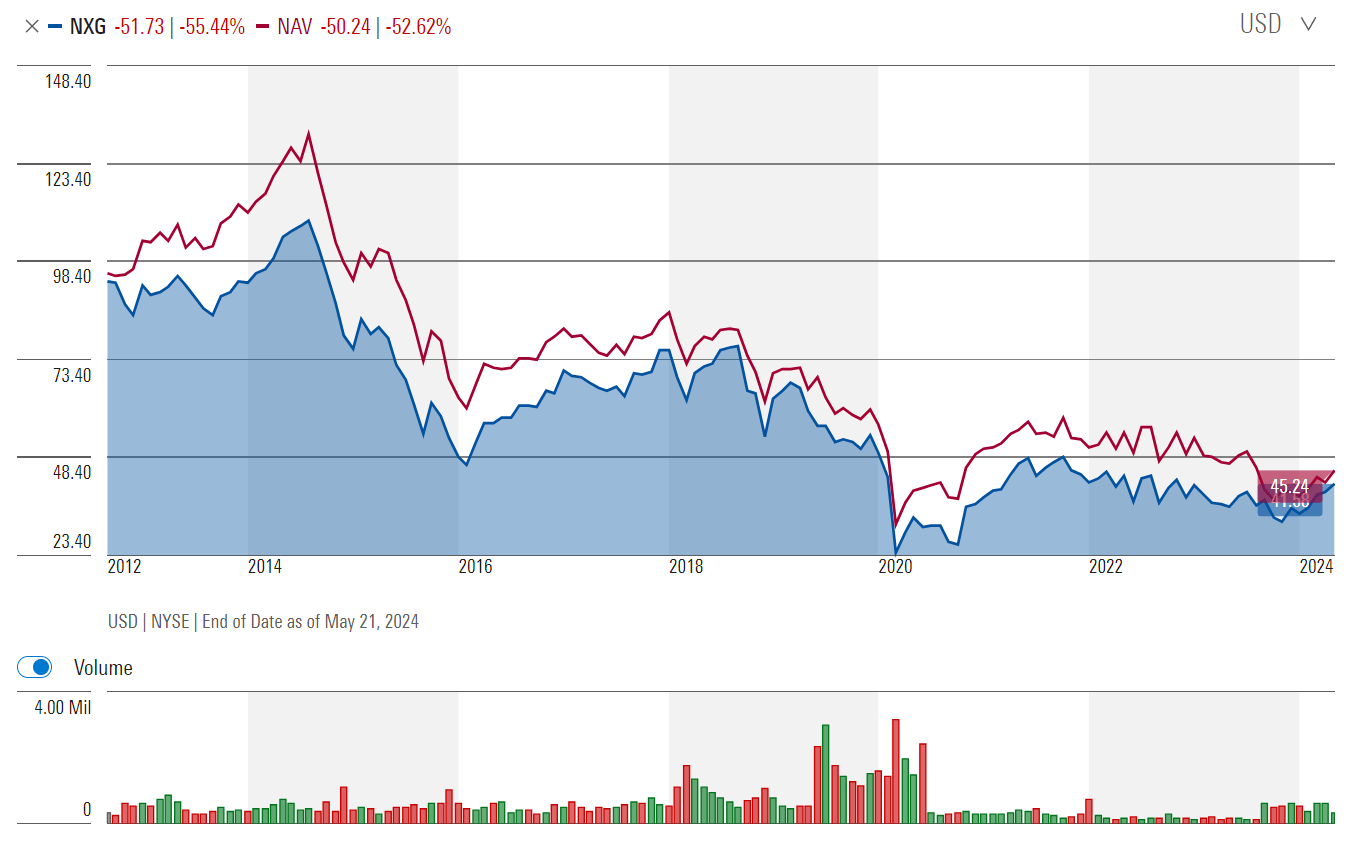
Amortizing NAVs is problematic because the market price of closed-end funds tends to track their NAVs. So if the fund's NAV declines, so will the fund's market price, and hence what investors can sell their shares for. Since its inception, NXG's NAV has declined by 52.6% and its market price has commensurately declined by 55.4%.
Another way to look at this issue is to think about NXG's distribution rate and yield (Figure 11).
Figure 11 - NXG historical distribution yield (Seeking Alpha)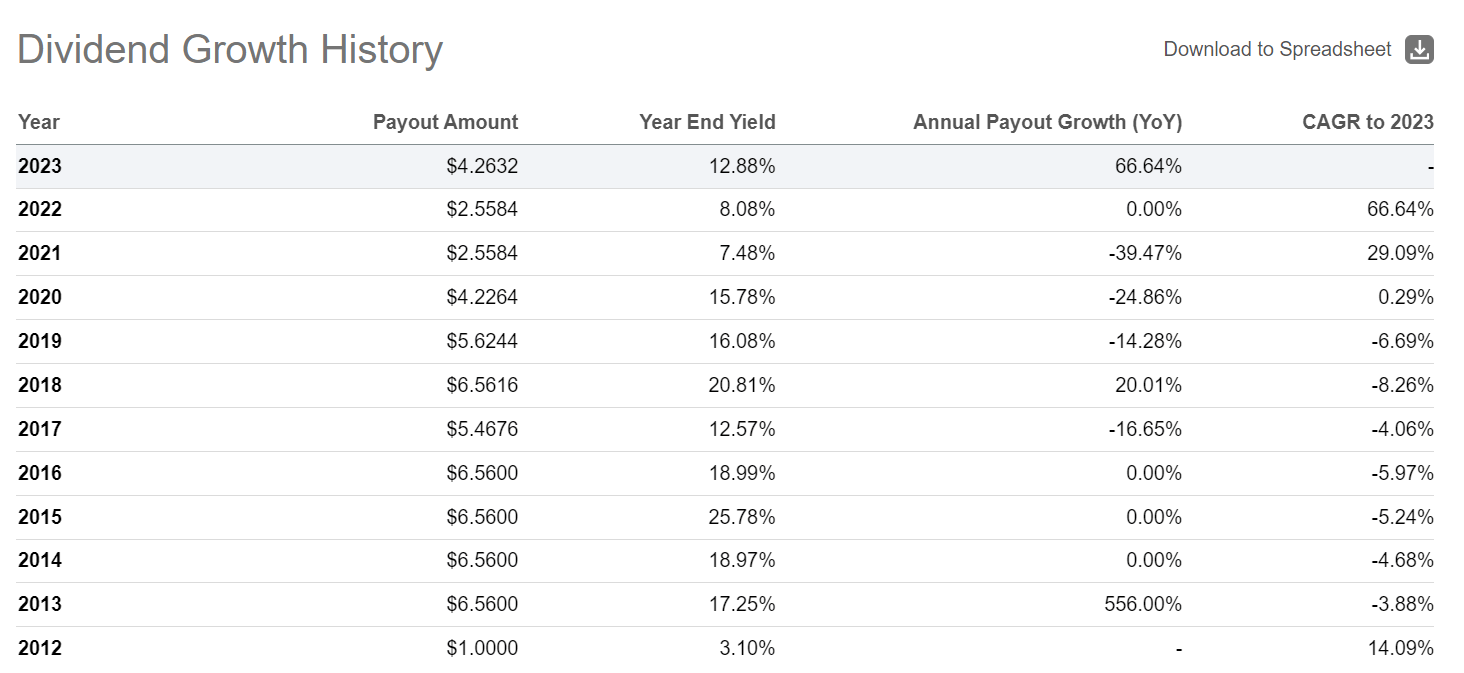
Historically, NXG's distribution rate was set at $6.56 / share annually or 7-8% yield when the fund was first launched. However, after poor performance, NXG's NAV declined, which made the yield very high (26% at year-end 2015). After trying to maintain the distribution constant for a few quarters, NXG was forced to cut its distribution rate to $5.47 / share in 2017, $4.23 in 2020, and $2.56 in 2021. However, continued poor investment performance kept NXG's NAV muted and distribution yield high.
A high distribution rate/yield should not be the sole basis of one's investment decision, as the yield is simply a reflection of the 'riskiness' of the investment. For NXG, the risks are a potential cut of the distribution when performance is poor, and continued NAV erosion.
Risk To My Thesis
Of course, there are upside risks to my cautious thesis. If the fund can continue to deliver strong investment performance, it may improve its discount to NAV beyond the historical 5-10% discount range and current investors may see additional tailwinds. Due to their 'free-floating' nature, CEFs can even trade at a premium to NAV.
Conclusion
Kudos to the investors who have bought the dip on the NXG fund and are sitting on nice gains. However, after reviewing the fund's recent performance, my conclusion is that the NXG fund's strong recent returns are primarily driven by a reallocation of the portfolio into riskier non-traditional infrastructure assets and a closing of the fund's discount to NAV. With the discount now normalized, future performance will have to come from the manager's stock selection. Based on the fund's historical track record, I am not optimistic.
I continue to recommend investors avoid the NXG fund.