William_Potter
Investment Thesis
Building a dividend portfolio from zero is a challenging task. The most crucial aspect, in my opinion, is to offer investors a reduced risk level from the start. This is essential as it helps investors to prioritize the preservation of their capital.
This reduced risk level can not only be achieved through a broad diversification across sectors, industries, countries, and equities, but also through providing companies that are most attractive in terms of risk and reward with a higher proportion in relation to the overall portfolio. In addition to that, it is important not to provide a high-risk company with a disproportionately high share. The Dividend Income Accelerator Portfolio follows this strategical approach.
In this article, I will show you how you could allocate the amount of $100,000 following the current composition of The Dividend Income Accelerator Portfolio. By doing so, you could reach a Weighted Average Dividend Yield (TTM) of 4.32%, while the portfolio offers a 5-Year Weighted Average Dividend Growth Rate (CAGR) of 7.65%.
I am convinced that the portfolio is an attractive choice for investors of different age groups, given its effective and well-balanced combination of dividend income and dividend growth.
Within this analysis, I will conduct a comprehensive risk-analysis of the current composition of our dividend portfolio, highlighting its reduced risk level. This is evidenced by an extensive portfolio diversification across sectors, the incorporation of companies with low Payout Ratios and attractive EPS Growth Rates, in addition to companies with low 60M Beta Factors. All of which contribute to successfully reducing portfolio volatility.
These characteristics strengthen my belief that this portfolio not only effectively combines dividend income and dividend growth, but also offers investors elevated chances for successful investment outcomes, resulting from its reduced risk level.
The Dividend Income Accelerator Portfolio Currently Consists of the Following Positions:
- Alphabet (NASDAQ:GOOGL)
- Altria (NYSE:MO)
- Apple (NASDAQ:AAPL)
- Ares Capital (NASDAQ:ARCC)
- AT&T (NYSE:T)
- Bank of America (NYSE:BAC)
- BHP Group (NYSE:NYSE:BHP)
- BlackRock (NYSE:BLK)
- BlackRock TCP Capital (NASDAQ:TCPC)
- British American Tobacco (NYSE:BTI)
- Cohen & Steers Quality Income Realty Fund (NYSE:RQI)
- Exxon Mobil (NYSE:XOM)
- iShares Core High Dividend ETF (NYSEARCA:HDV)
- Johnson & Johnson (NYSE:JNJ)
- JPMorgan (NYSE:JPM)
- Main Street Capital (NYSE:MAIN)
- Mastercard (NYSE:MA)
- Microsoft (NASDAQ:MSFT)
- Nike (NYSE:NKE)
- PepsiCo (NASDAQ:PEP)
- Pfizer (NYSE:PFE)
- Philip Morris (NYSE:PM)
- Realty Income (NYSE:O)
- Royal Bank of Canada (NYSE:RY)
- Schwab U.S. Dividend Equity ETF (NYSEARCA:SCHD)
- VICI Properties (NYSE:VICI)
The Dividend Income Accelerator Portfolio
The Dividend Income Accelerator Portfolio’s objective is the generation of income via dividend payments, and to annually raise this sum. In addition to that, its goal is to attain an appealing Total Return when investing with a reduced risk level over the long-term.
The Dividend Income Accelerator Portfolio’s reduced risk level will be reached due to the portfolio’s broad diversification over sectors and industries and the inclusion of companies with a low Beta Factor.
Below, you can find the characteristics of The Dividend Income Accelerator Portfolio:
- Attractive Weighted Average Dividend Yield (TTM)
- Attractive Weighted Average Dividend Growth Rate (CAGR) 5 Year
- Relatively low Volatility
- Relatively low Risk-Level
- Attractive expected reward in the form of the expected compound annual rate of return
- Diversification over asset classes
- Diversification over sectors
- Diversification over industries
- Diversification over countries
- Buy-and-Hold suitability
Overview of the Current Composition of The Dividend Income Accelerator Portfolio
Symbol | Company Name | Sector | Industry | Country | Dividend Yield (TTM) | Dividend Growth 5Y | Current Allocation | Amount in $ |
SCHD | Schwab U.S. Dividend Equity ETF | ETFs | ETFs | United States | 3.54% | 13.92% | 23.72% | 23720 |
O | Realty Income | Real Estate | Retail REITs | United States | 5.52% | 4.28% | 3.69% | 3690 |
PM | Philip Morris | Consumer Staples | Tobacco | United States | 4.95% | 3.15% | 2.05% | 2050 |
RY | Royal Bank of Canada | Financials | Diversified Banks | Canada | 3.64% | 6.24% | 2.18% | 2180 |
AAPL | Apple | Information Technology | Technology Hardware, Storage and Peripherals | United States | 0.41% | 6.59% | 4.65% | 4650 |
T | AT&T | Communication Services | Integrated Telecommunication Services | United States | 5.97% | -5.97% | 2.35% | 2350 |
MA | Mastercard | Financials | Transaction & Payment Processing Services | United States | 0.57% | 17.92% | 2.19% | 2190 |
MAIN | Main Street Capital | Financials | Asset Management and Custody Banks | United States | 5.52% | 3.58% | 2.37% | 2370 |
JNJ | Johnson & Johnson | Health Care | Pharmaceuticals | United States | 3.22% | 5.83% | 3.70% | 3700 |
BAC | Bank of America | Financials | Diversified Banks | United States | 2.29% | 12.03% | 3.00% | 3000 |
ARCC | Ares Capital | Financials | Asset Management and Custody Banks | United States | 9.13% | 4.65% | 3.92% | 3920 |
TCPC | BlackRock TCP Capital | Financials | Asset Management and Custody Banks | United States | 12.45% | -1.73% | 1.77% | 1770 |
BTI | British American Tobacco | Consumer Staples | Tobacco | United Kingdom | 11.36% | 2.45% | 1.85% | 1850 |
BHP | BHP Group | Materials | Diversified Metals and Mining | Australia | 5.21% | 10.07% | 1.75% | 1750 |
MSFT | Microsoft | Information Technology | Systems Software | United States | 0.65% | 10.16% | 2.30% | 2300 |
NKE | Nike | Consumer Discretionary | Footwear | United States | 2.03% | 11.13% | 1.66% | 1660 |
XOM | Exxon Mobil | Energy | Integrated Oil and Gas | United States | 3.26% | 2.64% | 2.04% | 2040 |
HDV | iShares Core High Dividend ETF | ETFs | ETFS | United States | 3.46% | 4.70% | 8.01% | 8010 |
VICI | VICI Properties | Real Estate | Other Specialized REITs | United States | 5.48% | 10.05% | 1.82% | 1820 |
BLK | BlackRock | Financials | Asset Management and Custody Banks | United States | 2.45% | 10.72% | 3.80% | 3800 |
RQI | Cohen & Steers Quality Income Realty Fund | Real Estate | REITs | United States | 7.94% | 0.00% | 7.46% | 7460 |
PFE | Pfizer | Health Care | Pharmaceuticals | United States | 5.70% | 4.77% | 2.03% | 2030 |
MO | Altria | Consumer Staples | Tobacco | United States | 8.21% | 4.59% | 2.08% | 2080 |
SCHO | Schwab Short-Term US Treasury ETF | Taxable Bond | Short Government | United States | 4.19% | 13.90% | 3.83% | 3830 |
PEP | PepsiCo | Consumer Staples | Soft Drinks & Non-alcoholic Beverages | United States | 3.13% | 6.62% | 1.91% | 1910 |
GOOG | Alphabet | Communication Services | Interactive Media and Services | United States | 0.11% | 1.93% | 1930 | |
JPM | JPMorgan | Financials | Diversified Banks | United States | 2.09% | 7.50% | 1.92% | 1920 |
4.32% | 7.65% |
Source: The Author, data from Seeking Alpha
I would like to highlight that the allocations indicated in the table above are the current allocations of The Dividend Income Accelerator Portfolio. For these reasons, the numbers are not rounded up.
Risk Analysis of The Current Composition of The Dividend Income Accelerator Portfolio
Risk Analysis of the Portfolio Allocation per Company/ETF
The current largest positions of The Dividend Income Accelerator Portfolio are SCHD with 23.7%, followed by HDV with 8.0% and RQI with 7.5%. Allocating a relatively high proportion of the overall portfolio to SCHD, HDV and RQI not only ensures a broad portfolio diversification, but also a reduced company-specific allocation risk, underscoring a reduced overall risk level for our dividend portfolio.
The largest individual positions of our dividend portfolio are currently Apple (with 4.6%), Ares Capital (3.92%), BlackRock (3.8%), Johnson & Johnson (3.7%) Realty Income (3.69%), and Bank of America (3.0%). All other individual companies represent less than 3% of the overall portfolio, further evidencing its reduced company-specific allocation risk.
Holding Apple, which pays a low Dividend Yield (TTM) of 0.41% but offers investors an attractive risk-reward profile, as the largest individual position and still achieving an attractive Weighted Average Dividend Yield (TTM) of 4.32% is another strength of the current composition of our dividend portfolio.
Source: The Author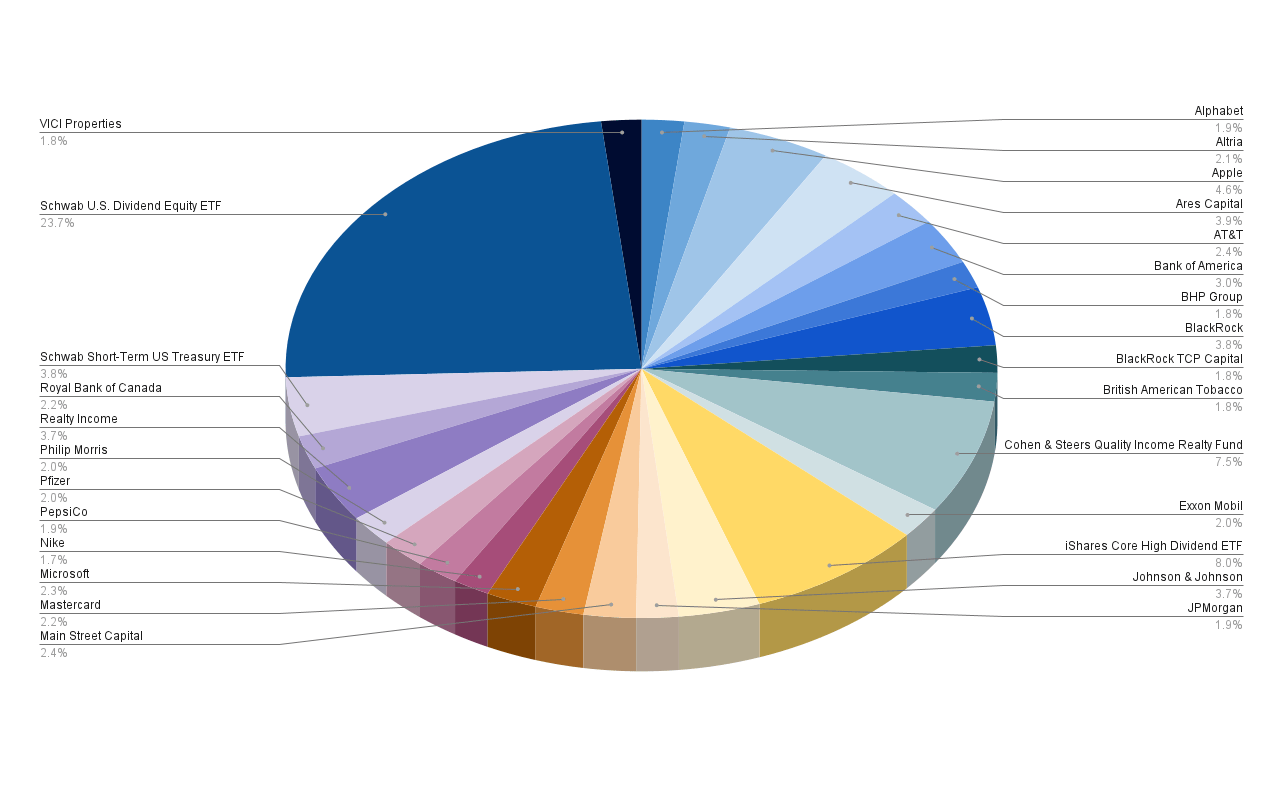
Risk Analysis: Analyzing the Individual Positions of The Dividend Income Accelerator Portfolio
Analysis of the Companies that Pay the Highest Dividend Yields (TTM)
The chart below illustrates which of the chosen companies contributes most to the portfolio’s production of dividend income. The graphic shows all companies that pay a Dividend Yield (TTM) of at least 5%.
Source: The Author, data from Seeking Alpha![Dividend Yield [TTM]](https://static.seekingalpha.com/uploads/2024/7/16/55029283-1721182866615977_origin.png)
Among the top five companies that pay the highest Dividend Yields (TTM) are BlackRock TCP Capital with a Dividend Yield (TTM) of 12.45%, followed by British American Tobacco (Dividend Yield (TTM) of 11.36%), Ares Capital (9.13%), Altria (8.21%), and Cohen & Steers Quality Income Realty Fund (7.94%). The graphic underlines the portfolio’s suitability for dividend income investors.
Analysis of the Payout Ratios of the Companies that are Part of The Dividend Income Accelerator Portfolio
The graphic below showcases the Payout Ratios of the companies that are part of The Dividend Income Accelerator Portfolio.
It is worth mentioning that 11 of the 23 companies exhibit Payout Ratios below 50%, underscoring their potential for dividend growth.
Source: The Author, data from Seeking Alpha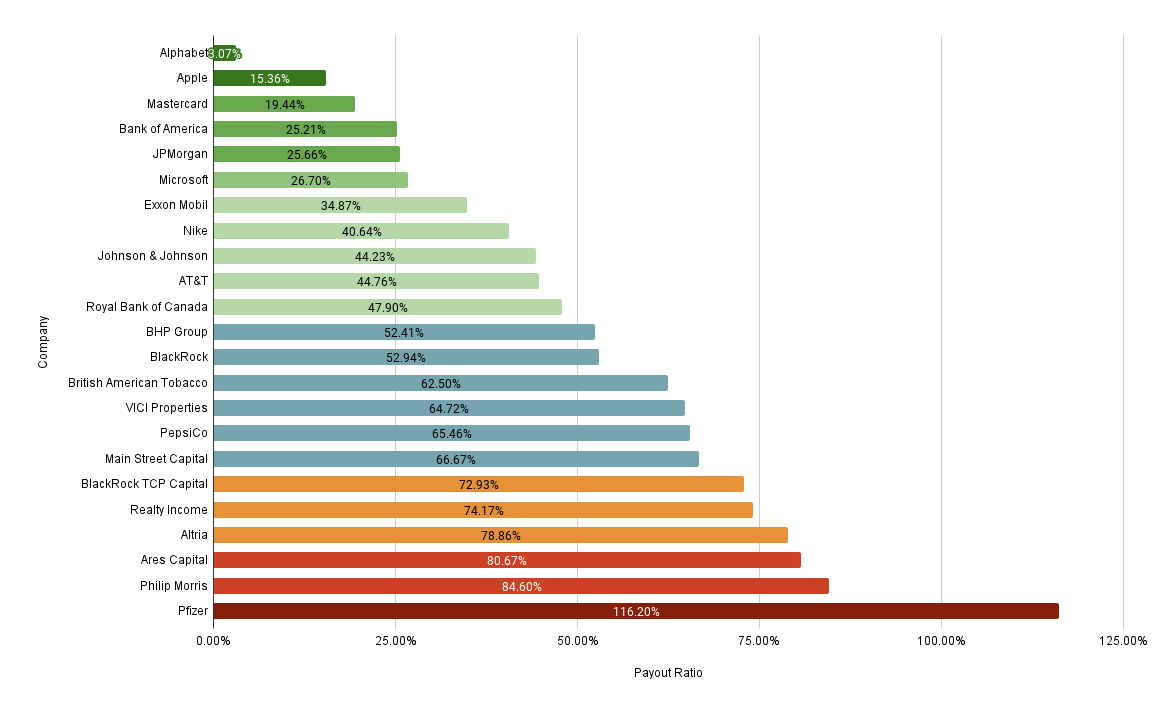
Six of the selected companies have Payout Ratios below 30%: these are Alphabet (Payout Ratio of 3.07%), Apple (15.36%), Mastercard (19.44%), Bank of America (25.21%), JPMorgan (25.66%) and Microsoft (26.70%). Due to their growth potential, financial health and significant competitive advantages, I believe that these companies can not only contribute to strong dividend growth for The Dividend Income Accelerator Portfolio, but also the achievement of an attractive Total Return. Therefore, I believe they are important core elements of our dividend portfolio, even though they do not provide a high Dividend Yield.
Analysis of the Companies with the Highest EPS Growth Rates (FWD)
The graphic below further underlines the dividend growth potential of the companies that are part of this dividend portfolio. It showcases all companies with an EPS Growth Rate (FWD) above 8%.
It is worth highlighting that nine out of the 23 selected companies for The Dividend Income Accelerator Portfolio exhibit double-digit EPS Growth Rates (FWD). The companies with the highest EPS Growth Rates (FWD) are VICI Properties (29.55%), Alphabet (23.50%), Realty Income (20.49%), Mastercard (19.23%) and Exxon Mobil (17.15%).
Source: The Author, data from Seeking Alpha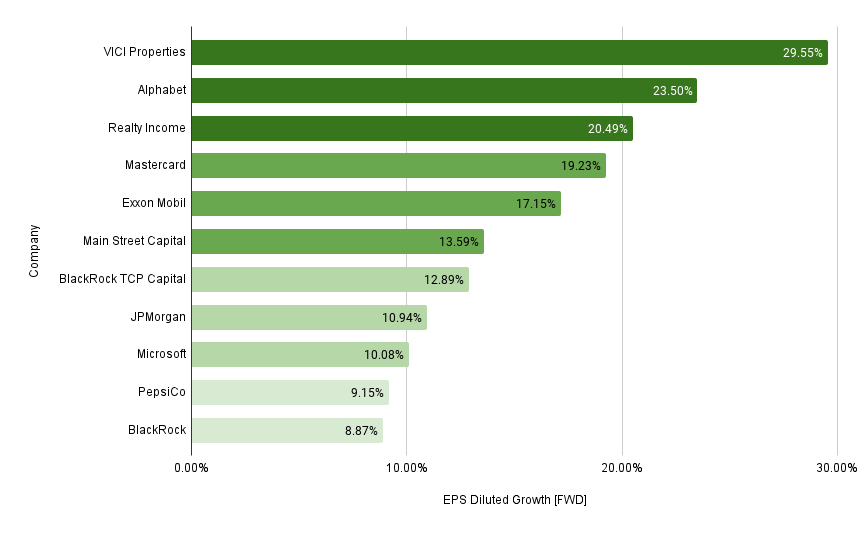
The graphic reinforces my belief that The Dividend Income Accelerator Portfolio not only consists of companies that pay attractive Dividend Yields (as shown in a previous section of this analysis), but also companies with strong potential for dividend growth. Therefore, I am convinced that the portfolio offers a balanced mix of dividend income and dividend growth, indicating that it could be attractive for investors of different ages and that it is optimized in terms of risk and reward.
Analysis of the Companies with the Lowest 60M Beta Factors
It is worth highlighting that 11 of the 23 individually selected companies have a 60M Beta Factor below 1, evidencing the portfolio’s reduced volatility and lowered risk level. The companies that most contribute to reducing portfolio volatility are British American Tobacco (60M Beta Factor of 0.33), PepsiCo (0.53), BHP Group (0.57), Johnson & Johnson (0.58), Pfizer (0.64) and Altria (0.67).
Source: The Author, data from Seeking Alpha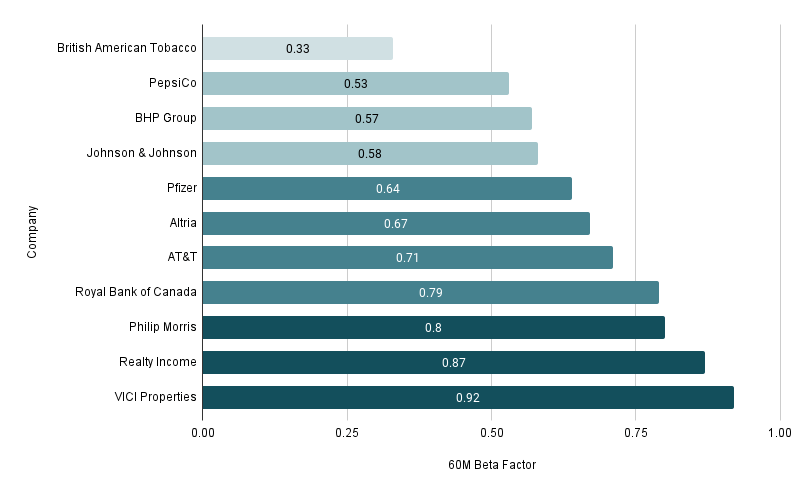
The graphic underlines my investment thesis that our dividend portfolio is optimized in terms of risk and reward.
Risk Analysis of the Company-Specific Concentration Risk When Allocating HDV, SCHD and RQI Across the Companies they Are Invested in
The graphic below illustrates the company allocation of The Dividend Income Accelerator Portfolio when distributing HDV, SCHD and RQI across their respective companies.
Source: The Author, data from Seeking Alpha and Morningstar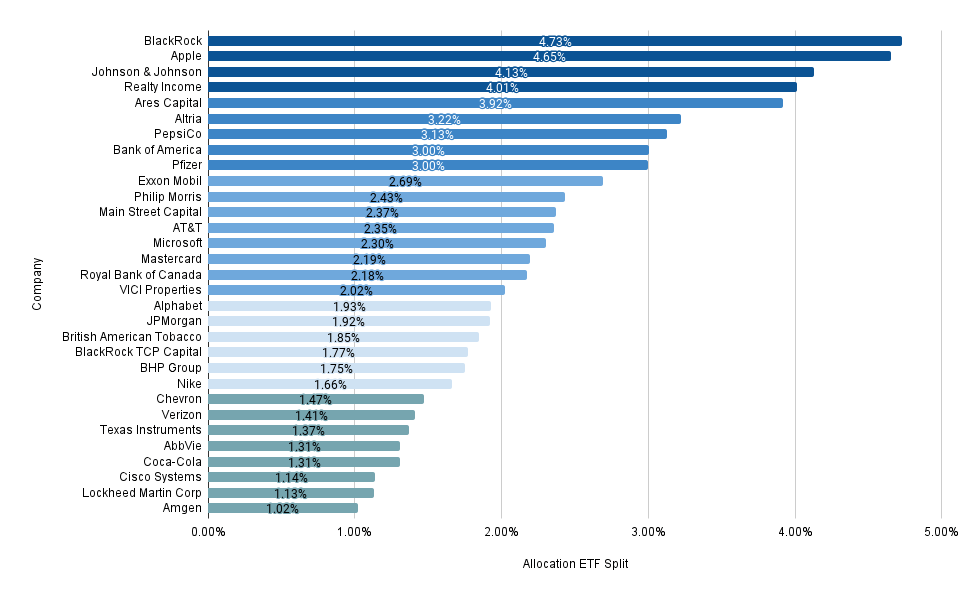
Today, there are four companies with a proportion of more than 4% of the overall portfolio: BlackRock (with 4.73%), Apple (4.65%), Johnson & Johnson (4.13%) and Realty Income (4.01%).
These four companies share some characteristics that make them especially attractive as the largest positions in our dividend portfolio: each of them pays a dividend and has demonstrated their potential for dividend growth (they have a relatively low Payout Ratios, or they have shown attractive Dividend Growth Rates within the past years), they are financially healthy, have strong competitive advantages and are particularly attractive in terms of risk-and-reward. This further underscores my thesis that the portfolio is risk-and-reward optimized.
Overweighting companies that are particularly attractive in terms of risk and reward means you are increasing the probability of successful investment outcomes. Therefore, I believe it is crucial for long-term investment success to overweight those companies with particularly attractive risk-reward profiles.
Risk Analysis of the Portfolio’s Sector-Specific Concentration Risk When Distributing HDV, SCHD and RQI Across their Sectors
Currently, the Financials Sector is the largest sector of our dividend portfolio, currently representing 27.62% of the overall portfolio.
The second largest is the Consumer Staples Sector, which presently accounts for 13.83% of our dividend portfolio.
The third largest is the Health Care Sector, which makes up 11.49%, followed by the Real Estate Sector (10.94%), and the Information Technology Sector (10.56%).
Source: The Author, data from Seeking Alpha and Morningstar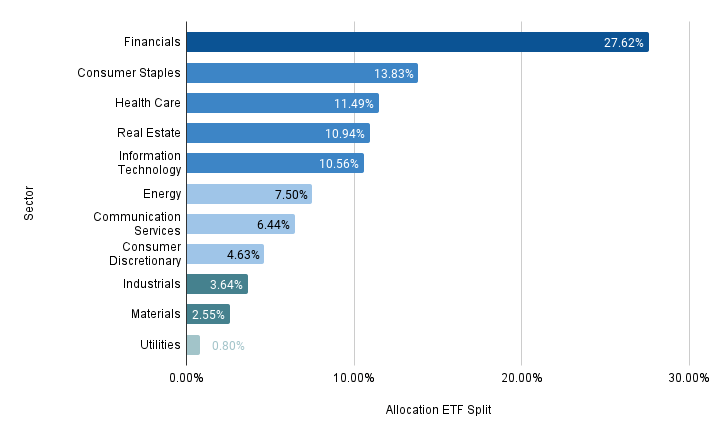
All other sectors presently account for less than 8% of the overall portfolio: the Energy Sector accounts for 7.50%, the Communication Services Sector 6.44%, the Consumer Discretionary Sector 4.63%, the Industrials Sector 3.64%, the Materials Sector 2.55% and the Utilities Sector 0.80%.
The graphic underscores the reduced sector-specific allocation risk of our dividend portfolio, especially due to the fact that only the Financials Sector accounts for more than 15% of the overall portfolio (27.62%).
Conclusion
With this article, I have demonstrated how you could follow the current composition of The Dividend Income Accelerator Portfolio by allocating the amount of $100,000.
It is important to highlight that you could allocate any other amount. However, to achieve similar investment outcomes, you will need to follow the portfolio’s current allocations indicated in the table at the beginning of this analysis.
Building The Dividend Income Accelerator Portfolio and following its current allocations means that you could reach a Weighted Average Dividend Yield (TTM) of 4.32%. At the same time, the portfolio offers investors a 5-Year Weighted Average Dividend Growth Rate (CAGR) of 7.65%.
These numbers demonstrate that our dividend portfolio not only offers investors a reduced risk level through a broad diversification across sectors industries and countries, as well as through the incorporation of financially healthy companies with strong competitive advantages, but it also combines income generation for today with the potential for dividend growth in the future. This combination of dividend income and dividend growth in addition to the portfolio’s risk-reward optimization make the portfolio suitable for investors from different age groups.
Implementing a balanced investment approach that combines dividend income and dividend growth means that your portfolio can contribute to paying your bills today or even help you finance your next vacation, and in addition to that, it helps you generate an additional extra income for your retirement thanks to the inclusion of companies with strong dividend growth potential.
What do you think about the current composition of The Dividend Income Accelerator Portfolio? Are you considering following a similar investment approach?
Editor's Note: This article discusses one or more securities that do not trade on a major U.S. exchange. Please be aware of the risks associated with these stocks.