
akinbostanci/iStock via Getty Images
Investment Approach
- Fidelity® Low-Priced Stock Fund uses an opportunistic approach in seeking undervalued stocks. It focuses mostly on small- and mid-cap companies, including overseas. Most holdings have share prices below $35 per share or an earnings yield at or above the median for the Russell 2000® Index. (The earnings yield is the inverse of the price-earnings (P/E) ratio; a high earnings yield means a low P/E ratio.)
- Our investment process is based on the belief that many low-priced stocks are mispriced. Mispricings are especially likely to occur in businesses that seem boring and out of favor, or which require careful analysis.
- We seek to buy higher-quality companies with stable growth prospects that trade at a discount to our estimate of intrinsic (fair) value.
- Where the gap between price and value is especially compelling, we may invest in firms whose near-term prospects appear challenged. We cast a wide net, and many holdings are outside of the fund's benchmark.
- We invest with a long-term time horizon and global perspective, seeking to deliver attractive risk-adjusted returns. To help manage risk, we look for understandable businesses that are resilient and growing, with honest and capable management, purchased at a modest price.
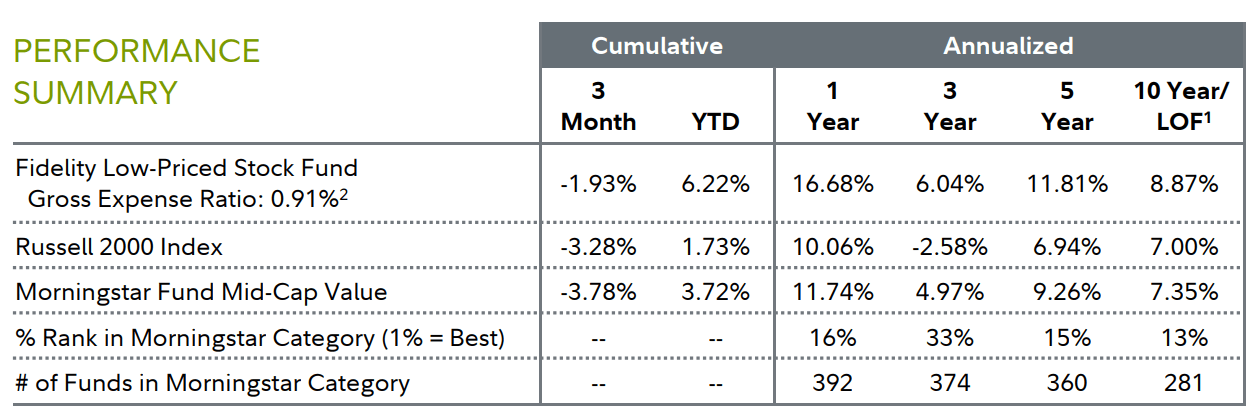
| 1 Life of Fund (LOF) if performance is less than 10 years. Fund inception date: 12/27/1989. 2 This expense ratio is from the most recent prospectus and generally is based on amounts incurred during the most recent fiscal year, or estimated amounts for the current fiscal year in the case of a newly launched fund. It does not include any fee waivers or reimbursements, which would be reflected in the fund's net expense ratio. Past performance is no guarantee of future results. Investment return and principal value of an investment will fluctuate; therefore, you may have a gain or loss when you sell your shares. Current performance may be higher or lower than the performance stated. Performance shown is that of the fund's Retail Class shares (if multiclass). You may own another share class of the fund with a different expense structure and, thus, have different returns. To learn more or to obtain the most recent month-end or other share-class performance, visit Fidelity Funds | Mutual Funds from Fidelity Investments, Financial Professionals | Fidelity Institutional, or Fidelity NetBenefits | Employee Benefits. Total returns are historical and include change in share value and reinvestment of dividends and capital gains, if any. Cumulative total returns are reported as of the period indicated. |
Performance Review
For the second quarter, the fund's Retail Class shares returned -1.93%, outpacing the -3.28% result of the benchmark, the Russell 2000® Index.
The backdrop for the global economy and earnings growth remained largely constructive in the past three months, underpinning fairly low market volatility. The move toward global monetary easing inched forward, but persistent core inflation in the U.S. kept the Federal Reserve on hold. Looking ahead, the pace and magnitude of global monetary easing remains uncertain, while near-term risk of a recession in the U.S. appears muted.
Against this backdrop, growth stocks (-2.92%) held up a bit better than value stocks (-3.64%) within the benchmark. By sector, consumer discretionary (-6%) fared worst, followed by materials, industrials and health care (-4% each). Conversely, consumer staples rose about 2% and utilities advanced 0.13%.
The fund's outperformance of the benchmark in Q2 primarily reflects stock selection, especially in the information technology sector. The top individual relative contributor was avoiding Super Micro Computer (SMCI) (-19%), a maker of high-end servers and networking solutions for data centers and cloud applications. This sizable benchmark constituent that didn't fit our investment approach, as we focus on high-quality companies with stable earnings growth that we believe are mispriced - meaning they trade at a discount to our estimate of fair value.
Also in tech, an investment in disk-drive manufacturer Seagate Technology Holdings (STX) (+12%) notably helped. Seagate has invested capital to create new storage products that would be relevant in data centers, which have grown faster than PCs - an example of the company adapting to a changing competitive landscape. In Q2, Seagate benefited from a cyclical recovery in demand for data-storage products and from increasing uptake of its new technology, called HAMR, among hyperscalers. We reduced our stake in Seagate this quarter, but continued to believe our thesis for this investment is on track and that the stock remained undervalued. It was the fund's sixth-largest position as of June 30.
In contrast, stock selection and an overweight in the lagging consumer discretionary sector detracted from the fund's relative result for the three months. Avoiding Insmed (INSM) (+145%) was the biggest individual relative detractor. Shares of the biopharmaceutical firm and benchmark component rose 147% in Q2, surging on May 28 after the company reported that a late-stage trial of its experimental drug to treat lung disease, brensocatib, met its primary endpoint. Management said it plans to submit an approval application to the U.S. Food and Drug Administration in the fourth quarter of 2024. We avoided the company in Q2 because it didn't fit our investment approach.
Portfolio Positioning and Market Outlook
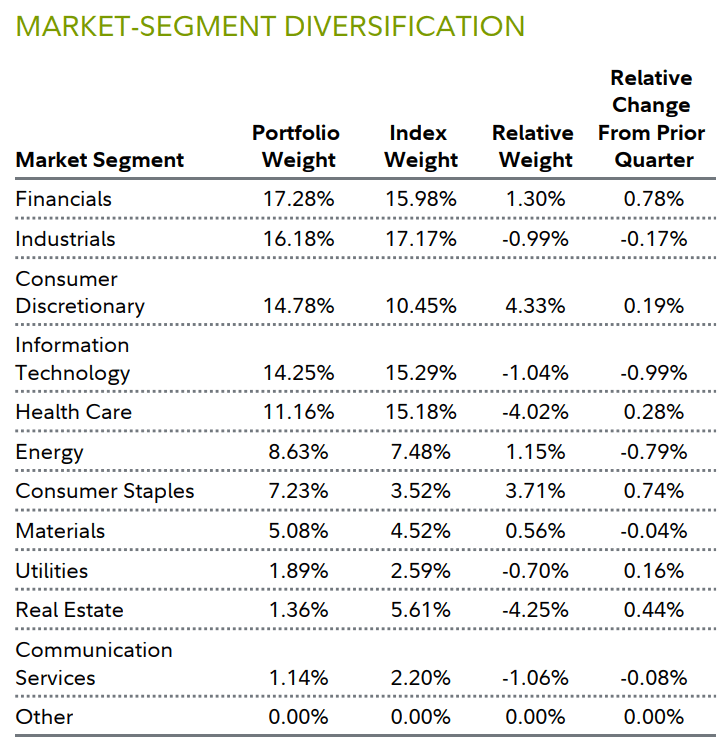
The fund's positioning among sectors remained largely unchanged the past three months, as we made only modest changes based on where we found the best potential risk-adjusted returns and opportunistic ideas that fit our investment philosophy. Cash holdings fell to 0.93% of the fund's assets, down from 1.50% at the end of March. Our investment process centers on being patient, taking a long-term view and comparing price to value with the hope of choosing undiscovered gems. When we evaluate a stock, we typically think about owning it for three to five years. We look past short-term noise and focus on drivers over a multiyear period.
As of midyear, multiple crosscurrents are influencing financial markets. The U.S. consumer remains healthy, given low unemployment and growing wages. The housing market appears to have found its footing amid a pause and likely pivot in the Fed's rate-hiking campaign, and many parts of the industrial economy have benefited from several multiyear government-backed spending outlays for infrastructure and reshoring. COVID-related supply-chain disruption appears to have largely been resolved across most sectors. Europe continues to face sticky inflation, the global macro environment remains volatile − with land wars in Europe and the Middle East − and the U.S. economy demonstrates evidence of both mid- and late-cycle dynamics.
This backdrop provides opportunity for patient investors like us. We are monitoring a growing pipeline of companies that look attractive to us in the medium term. Should the market narrow and favor only a few winners, we believe that helps us find compelling ideas that are overlooked, and thus provides an opportunity for investment.
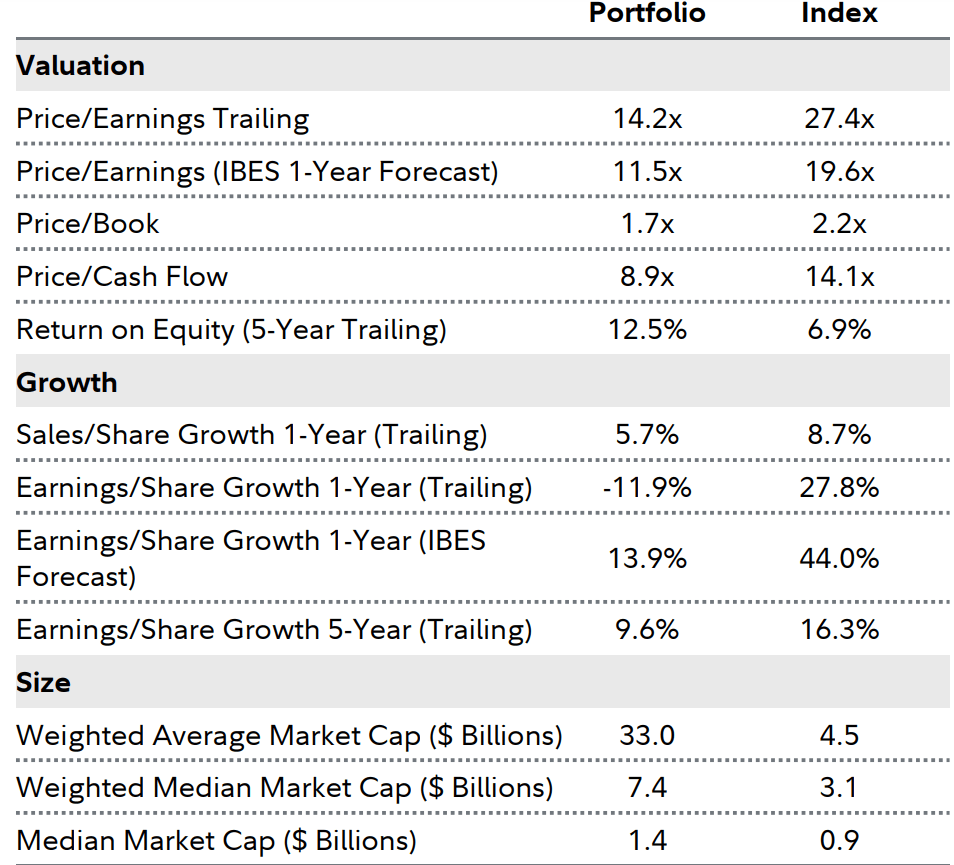
Characteristics
| Net Other Assets can include fund receivables, fund payables, and offsets to other derivative positions, as well as certain assets that do not fall into any of the portfolio composition categories. Depending on the extent to which the fund invests in derivatives and the number of positions that are held for future settlement, Net Other Assets can be a negative number. "Tax-Advantaged Domiciles" represent countries whose tax policies may be favorable for company incorporation. |
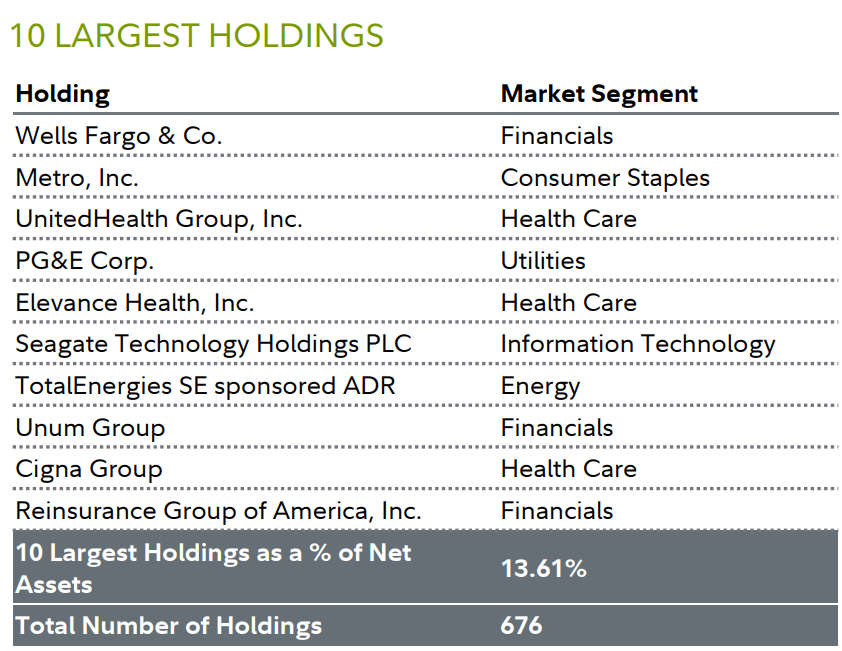
The 10 largest holdings are as of the end of the reporting period, and may not be representative of the fund's current or future investments. |
| Fund Information Manager(s): Sam Chamovitz Morgen Peck Salim Hart Trading Symbol: FLPSX Start Date: December 27, 1989 Size (in millions): $26,970.35 Morningstar Category: Fund Mid-Cap Value Stock markets, especially foreign markets, are volatile and can decline significantly in response to adverse issuer, political, regulatory, market, or economic developments. Foreign securities are subject to interest rate, currency exchange rate, economic, and political risks. The securities of smaller, less well-known companies can be more volatile than those of larger companies. Definitions and Important Information Information provided in, and presentation of, this document are for informational and educational purposes only and are not a recommendation to take any particular action, or any action at all, nor an offer or solicitation to buy or sell any securities or services presented. It is not investment advice. Fidelity does not provide legal or tax advice. Before making any investment decisions, you should consult with your own professional advisers and take into account all of the particular facts and circumstances of your individual situation. Fidelity and its representatives may have a conflict of interest in the products or services mentioned in these materials because they have a financial interest in them, and receive compensation, directly or indirectly, in connection with the management, distribution, and/or servicing of these products or services, including Fidelity funds, certain third-party funds and products, and certain investment services. Characteristics Earnings-Per-Share Growth Trailing measures the growth in reported earnings per share over trailing one- and five-year periods. Earnings-Per-Share Growth (IBES 1-Year Forecast) measures the growth in reported earnings per share as estimated by Wall Street analysts. Median Market Cap identifies the median market capitalization of the portfolio or benchmark as determined by the underlying security market caps. Price-to-Book (P/B) Ratio is the ratio of a company's current share price to reported accumulated profits and capital. Price/Cash Flow is the ratio of a company's current share price to its trailing 12-months cash flow per share. Price-to-Earnings (P/E) Ratio (IBES 1-Year Forecast) is the ratio of a company's current share price to Wall Street analysts' estimates of earnings. Price-to-Earnings (P/E) Ratio Trailing is the ratio of a company's current share price to its trailing 12-months earnings per share. Return on Equity (ROE) 5-Year Trailing is the ratio of a company's last five years historical profitability to its shareholders' equity. Preferred stock is included as part of each company's net worth. Sales-Per-Share Growth measures the growth in reported sales over the specified past time period. Weighted Average Market Cap identifies the market capitalization of the average equity holding as determined by the dollars invested in the portfolio or benchmark. Weighted Median Market Cap identifies the market capitalization of the median equity holding as determined by the dollars invested in the portfolio or benchmark. Important Fund Information Relative positioning data presented in this commentary is based on the fund's primary benchmark (index) unless a secondary benchmark is provided to assess performance. Indices It is not possible to invest directly in an index. All indices represented are unmanaged. All indices include reinvestment of dividends and interest income unless otherwise noted. Russell 2000 Index is a market capitalization-weighted index designed to measure the performance of the small-cap segment of the U.S. equity market. It includes approximately 2,000 of the smallest securities in the Russell 3000 Index. Market-Segment Weights Market-segment weights illustrate examples of sectors or industries in which the fund may invest, and may not be representative of the fund's current or future investments. They should not be construed or used as a recommendation for any sector or industry. Ranking Information © 2024 Morningstar, Inc. All rights reserved. The Morningstar information contained herein: (1) is proprietary to Morningstar and/or its content providers; (2) may not be copied or redistributed; and (3) is not warranted to be accurate, complete or timely. Neither Morningstar nor its content providers are responsible for any damages or losses arising from any use of this information. Fidelity does not review the Morningstar data and, for mutual fund performance, you should check the fund's current prospectus for the most up-to-date information concerning applicable loads, fees and expenses. % Rank in Morningstar Category is the fund's total-return percentile rank relative to all funds that have the same Morningstar Category. The highest (or most favorable) percentile rank is 1 and the lowest (or least favorable) percentile rank is 100. The top-performing fund in a category will always receive a rank of 1%. % Rank in Morningstar Category is based on total returns which include reinvested dividends and capital gains, if any, and exclude sales charges. Multiple share classes of a fund have a common portfolio but impose different expense structures. Relative Weights Relative weights represents the % of fund assets in a particular market segment, asset class or credit quality relative to the benchmark. A positive number represents an overweight, and a negative number is an underweight. The fund's benchmark is listed immediately under the fund name in the Performance Summary. 3-Year Risk/Return Statistics Beta is a measure of the volatility of a fund relative to its benchmark index. A beta greater (less) than 1 is more (less) volatile than the index. Information Ratio measures a fund's active return (fund's average monthly return minus the benchmark's average monthly return) in relation to the volatility of its active returns. R-Squared measures how a fund's performance correlates with a benchmark index's performance and shows what portion of it can be explained by the performance of the overall market/index. R-Squared ranges from 0, meaning no correlation, to 1, meaning perfect correlation. An R-Squared value of less than 0.5 indicates that annualized alpha and beta are not reliable performance statistics. Sharpe Ratio is a measure of historical risk-adjusted performance. It is calculated by dividing the fund's excess returns (the fund's average annual return for the period minus the 3-month "risk free" return rate) and dividing it by the standard deviation of the fund's returns. The higher the ratio, the better the fund's return per unit of risk. The three month "risk free" rate used is the 90-day Treasury Bill rate. Standard Deviation is a statistical measurement of the dispersion of a fund's return over a specified time period. Fidelity calculates standard deviations by comparing a fund's monthly returns to its average monthly return over a 36-month period, and then annualizes the number. Investors may examine historical standard deviation in conjunction with historical returns to decide whether a fund's volatility would have been acceptable given the returns it would have produced. A higher standard deviation indicates a wider dispersion of past returns and thus greater historical volatility. Standard deviation does not indicate how the fund actually performed, but merely indicates the volatility of its returns over time. Tracking Error is the divergence between the price behavior of a position or a portfolio and the price behavior of a benchmark, creating an unexpected profit or loss. Before investing in any mutual fund, please carefully consider the investment objectives, risks, charges, and expenses. For this and other information, call or write Fidelity for a free prospectus or, if available, a summary prospectus. Read it carefully before you invest. Past performance is no guarantee of future results. Views expressed are through the end of the period stated and do not necessarily represent the views of Fidelity. Views are subject to change at any time based upon market or other conditions and Fidelity disclaims any responsibility to update such views. These views may not be relied on as investment advice and, because investment decisions for a Fidelity fund are based on numerous factors, may not be relied on as an indication of trading intent on behalf of any Fidelity fund. The securities mentioned are not necessarily holdings invested in by the portfolio manager(s) or FMR LLC. References to specific company securities should not be construed as recommendations or investment advice. Diversification does not ensure a profit or guarantee against a loss. S&P 500 is a registered service mark of Standard & Poor's Financial Services LLC. Other third-party marks appearing herein are the property of their respective owners. All other marks appearing herein are registered or unregistered trademarks or service marks of FMR LLC or an affiliated company. Fidelity Brokerage Services LLC, Member NYSE, SIPC, 900 Salem Street, Smithfield, RI 02917. Fidelity Distributors Company LLC, 500 Salem Street, Smithfield, RI 02917. © 2024 FMR LLC. All rights reserved. Not NCUA or NCUSIF insured. May lose value. No credit union guarantee. 646708.48.0 |
Editor's Note: The summary bullets for this article were chosen by Seeking Alpha editors.