
Zephyr18
Investment Approach
- Fidelity® Real Estate Income Fund seeks above-average income and capital growth by investing in a mix of commercial real estate security types, including common stock, preferred stock, corporate bonds and commercial mortgage-backed securities (CMBS).
- Leveraging our significant experience in commercial real estate investing, we own a diversified mix of security types in an effort to generate higher yield and less volatility than can be achieved by holding real estate investment trust (REIT) common stocks alone. Bonds and preferred stocks help to generate attractive yield and dampen volatility, as they are higher in a company's capital structure and tend to move out of sync with common stocks.
- We seek to limit the fund's overall sensitivity to interest rates by investing in high-dividend-paying common stocks, taking intelligent credit risk backed by bottom-up research, and avoiding long-dated bonds that trade at tight credit spreads.
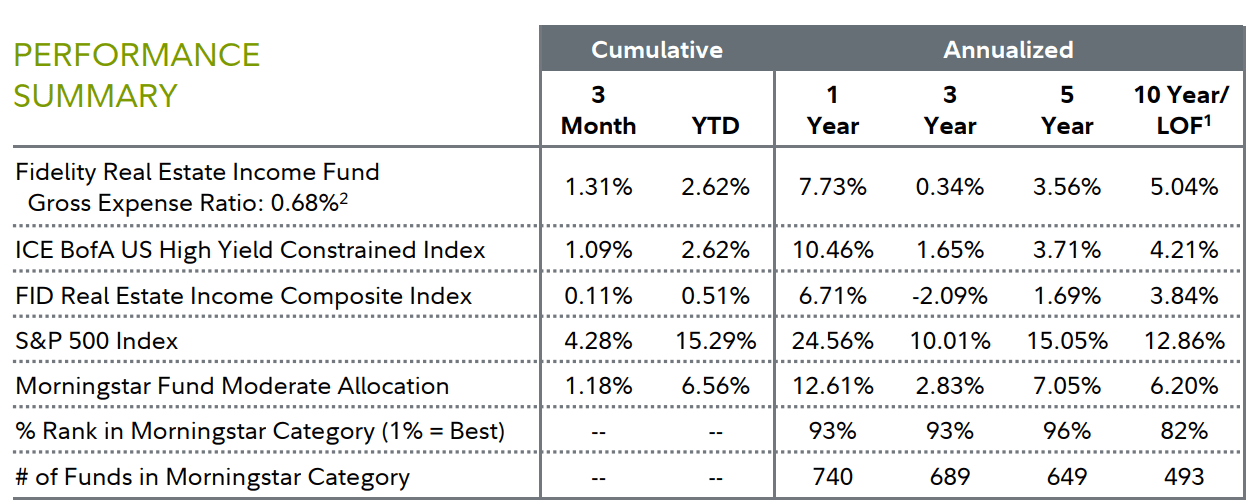
| 1 Life of Fund (LOF) if performance is less than 10 years. Fund inception date: 02/04/2003. 2 This expense ratio is from the most recent prospectus and generally is based on amounts incurred during the most recent fiscal year, or estimated amounts for the current fiscal year in the case of a newly launched fund. It does not include any fee waivers or reimbursements, which would be reflected in the fund's net expense ratio. Past performance is no guarantee of future results. Investment return and principal value of an investment will fluctuate; therefore, you may have a gain or loss when you sell your shares. Current performance may be higher or lower than the performance stated. Performance shown is that of the fund's Retail Class shares (if multiclass). You may own another share class of the fund with a different expense structure and, thus, have different returns. To learn more or to obtain the most recent month-end or other share-class performance, visit Fidelity Funds | Mutual Funds from Fidelity Investments, Financial Professionals | Fidelity Institutional, or Fidelity NetBenefits | Employee Benefits. Total returns are historical and include change in share value and reinvestment of dividends and capital gains, if any. Cumulative total returns are reported as of the period indicated. For definitions and other important information, please see the Definitions and Important Information section of this Fund Review. |
Market Review
U.S. real estate investment trusts returned -0.94% in the second quarter, as measured by the FTSE NAREIT Equity REITs Index, significantly lagging the 4.28% advance of the broad U.S. stock market, according to the S&P 500®index.
REITs declined this quarter amid heightened uncertainty about interest rates. A resilient economy, coupled with inflation that remained higher than desired, led investors to believe that rate cuts by the U.S. Federal Reserve were less likely in the near term.
Additionally, growth-oriented equities continued to attract the most attention from investors, leaving income-oriented and defensive segments, including REITs, lagging in a growth-focused market.
Against this challenging backdrop for REITs, six of nine categories in the FTSE NAREIT gained for the past three months, led by health care (+12%), residential (+7%) and real estate related (+3%). In contrast, hotel (-9%) and industrial/office (-7%) REITs lagged by the widest margin.
Meanwhile, real estate corporate bonds gained 0.64%, as measured by the ICE BofA®U.S. Real Estate Index - a market-capitalization-weighted measure of investment-grade corporate debt in the domestic real estate sector.
Commercial mortgage-backed securities added 1.07% for the three months, according to the Bloomberg U.S. Commercial Mortgage Backed Securities ex-AAA Index.
By comparison, the Bloomberg U.S. Aggregate Bond Index rose 0.07% in the second quarter, after returning -0.78% in the prior three months. For the trailing 12 months, taxable investment-grade bonds rose 2.63%. Outside the Aggregate index, U.S. Treasury Inflation-Protected Securities advanced 0.79%, per Bloomberg, while below-investment-grade segments, such as U.S. high-income corporates (+1.09%) and emerging-markets high-yield securities (+1.17%), showed relative strength in the rising-yield environment.
Elsewhere, real estate preferred stocks modestly declined, with the MSCI REIT Preferred Index returning -0.62% in Q2.
Looking at the broader equity market, S&P 500®shook off a rough April, thereafter rising steadily due to resilient corporate profits and a frenzy over generative artificial intelligence. Amid this favorable backdrop for higher-risk assets, the index continued its late-2023 momentum and reached midyear just shy of its all-time closing high. Growth stocks led the narrow rally, with only three of 11 sectors topping the broader market for the three months.
The backdrop for the global economy and earnings growth remained largely constructive, underpinning fairly low market volatility. The move toward global monetary easing inched forward, although persistent core inflation in the U.S. continued to keep the Fed on hold. Looking ahead, the pace and magnitude of global monetary easing remains uncertain, while near-term risk of a recession in the U.S. appears muted.
Performance Review
For the second quarter, the fund's Retail Class shares gained 1.31%, outpacing the 0.11% advance of the Fidelity Real Estate Income Composite Index SM.
In Q2, the primary contributor to the fund's performance versus the Composite index came from our preferred stock portfolio. Stock selection helped, as our holdings outperformed the MSCI REIT Preferred Index by 3.33 percentage points. The fund's large underweight in the asset class modestly helped relative performance, given that the preferred index lagged the Composite index for the quarter.
Another contributor was the fund's positioning in the real estate common stock segment. Security selection in this category was helpful, with our portfolio of real estate common stock holdings outpacing the FTSE NAREIT index by 1.77 percentage points.
The fund's CMBS subportfolio was an additional relative contributor. Security selection in the category helped most, as our CMBS holdings collectively outperformed the Bloomberg CMBS ex-AAA Index by 0.94 percentage points. The fund's substantial overweight in the asset class further contributed to relative performance, considering its outperformance of the Composite index.
Also, the fund's cash allocation, which historically has been between 5% and 10% of net assets to allow us to take advantage of attractive buying opportunities when they appear, slightly contributed to the fund's relative performance the past three months. Cash represented 5% of the fund as of midyear.
In contrast, results in the fund's real estate bond segment were slightly negative. Given that the category trailed the Composite index, the fund's underweight in real estate bonds hampered relative performance. Security selection in the portfolio sleeve modestly hurt the fund's overall result.
Outlook and Positioning
We seek to achieve what we consider a reasonable absolute total return by investing in real estate stocks and bonds, aiming for a higher yield and less volatility than what is typically available by investing in REIT common stocks alone. The lower volatility occurs mostly because bonds and preferred stocks are senior in priority to common stocks, so their prices move less when growth disappoints. As always, the past three months, we selected investments primarily based on bottom-up (security-by-security) fundamental research.
We rely on our years of experience in commercial real estate investing and the expertise of our research team.
Shifts to the fund's asset allocation generally are modest, as we try to avoid big, rapid changes. Instead, we favor an incremental approach because we believe we are better at identifying longer-term trends in the market. When we see unique opportunities, however, we may choose to shift the fund's asset mix more quickly.
Through the second quarter, the fund's allocation to investment-grade real estate corporate bonds continued to grow - 23% on June 30, up from 20% as of March 31. We appreciated these securities' generally defensive characteristics - investment-grade issuers tend to have a strong balance sheet and therefore support our goal of minimizing downside capture. So, these securities are presenting us with an opportunity that we see as a double "win" - bonds offering both high income and low credit risk.
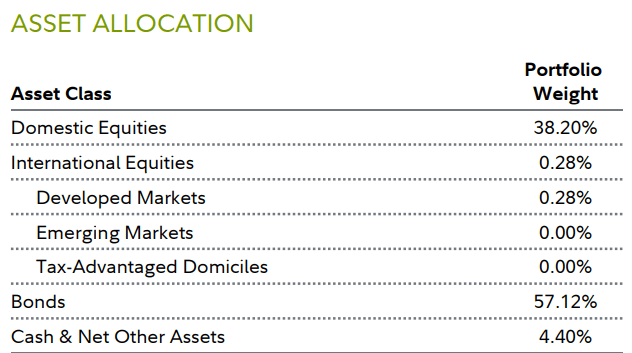
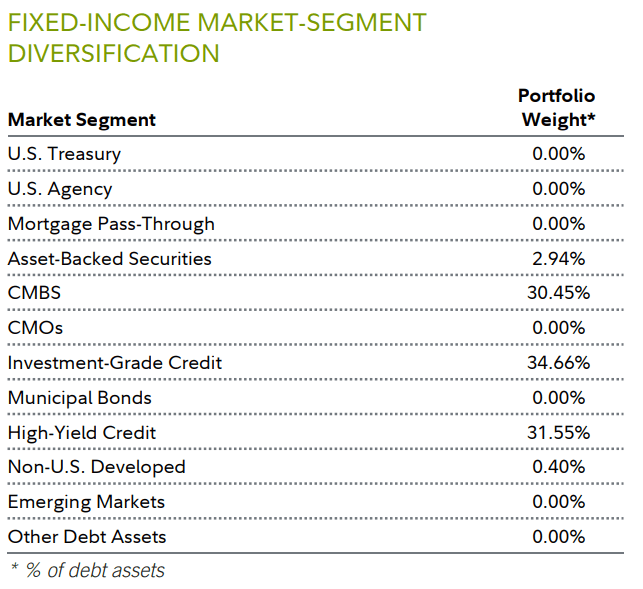
To grow the fund's investment-grade bond allocation, we used the portfolio's available cash. Our cash allocation reached midyear at 4.5%, down from 5.9% on March 31. To fund our other investment-grade purchases, we trimmed the allocation to CMBS, where the fund's allocation drifted from 25.2% to about 24.6%, and preferred stock, which went from 16.4% to 15.0%.
One reason we are comfortable with the fund's higher overall weighting in fixed income - representing about 58% of the portfolio as of June 30, including investment-grade and high-yield real estate corporate bonds and CMBS - is because bondholders are among the earliest to be repaid if issuers encounter financial difficulty.
Meanwhile, due to higher short- and long-term interest rates these days, investment-grade bonds now offer compelling yields. Their income has become more competitive with high-yield debt, but generally with lower credit risk.
Meanwhile, for some of our higher-yielding but lower-rated fixed-income investments, if we are right about assessing the securities' credit quality, we expect the fund to benefit from spread narrowing while also collecting the coupon. When we invest in CMBS, we favor issuers with underlying property types that offer rising operating income, modest leverage and good ownership, and that provide comparable yields to high-yield real estate corporate bonds.
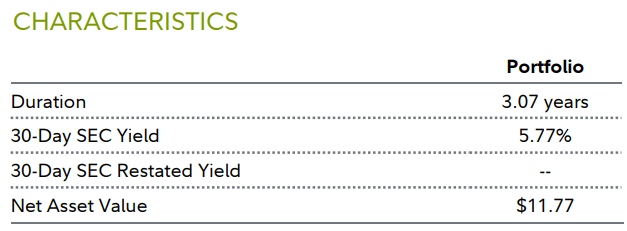
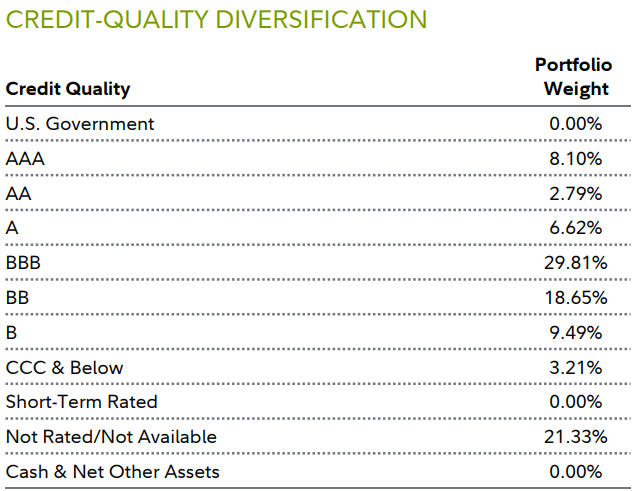
As the second half of 2024 begins, the fund's yield was roughly 6%. We see the fund as defensively positioned, with elevated exposure to property types with a track record of durable cash flow and reduced exposure to economically sensitive, cyclical property types. On the credit side, we believe our emphasis on investment-grade over high-yield bonds provides the fund with reduced credit risk yet still respectable income, given high interest rates. Lastly, we have exposure to CMBS, where, due to our thorough credit research, we see various securities we've determined may be mispriced.
In short, due to the fund's healthy yield and defensive positioning, we feel good about the fund's medium- and long-term prospects, regardless of whether the economy slows or continues to do well.
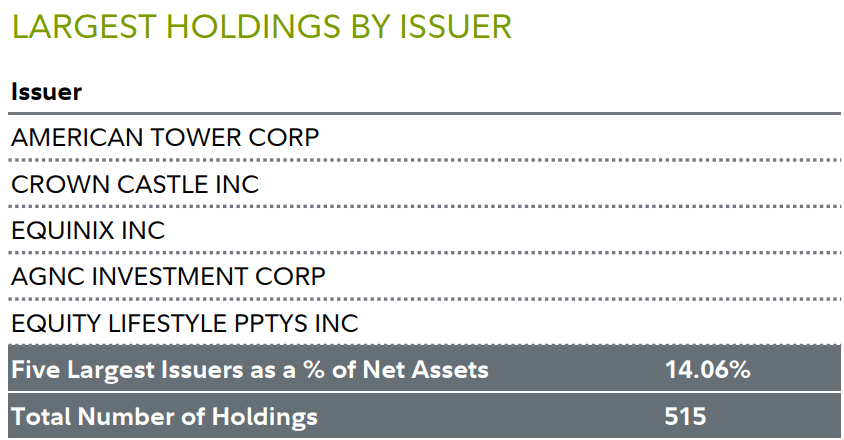
| The five largest issuers are as of the end of the reporting period, and may not be representative of the fund's current or future investments. Holdings do not include money market investments. |
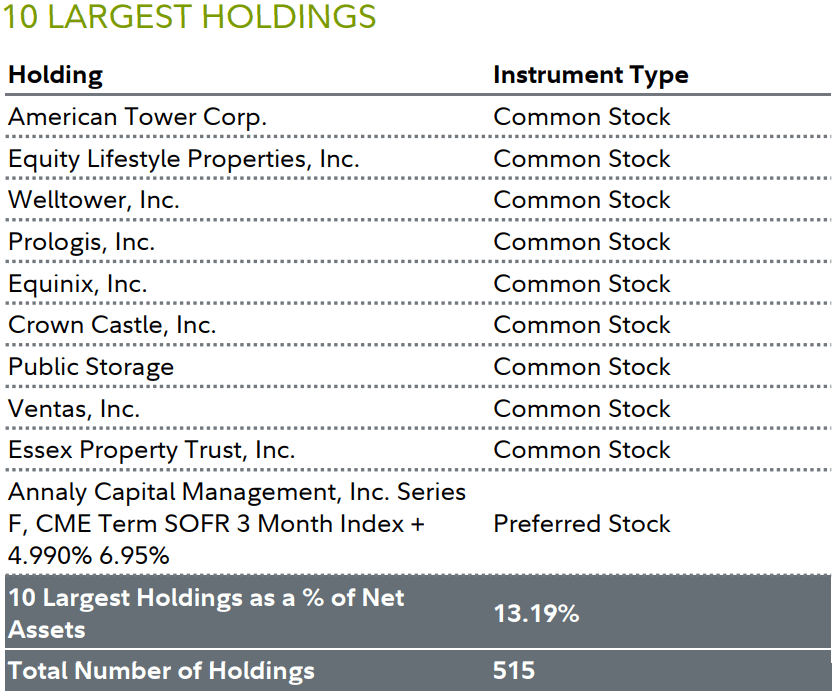
| The 10 largest holdings are as of the end of the reporting period, and may not be representative of the fund's current or future investments. Holdings do not include money market investments. |
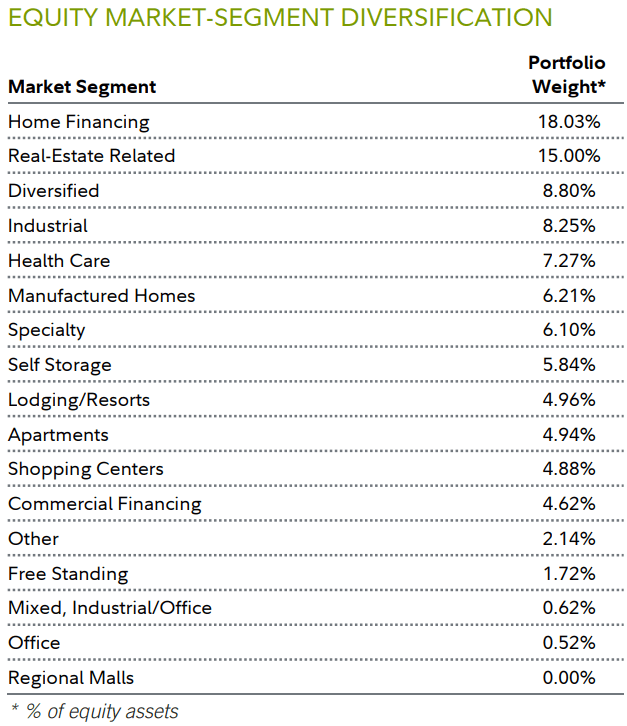
| Net Other Assets can include fund receivables, fund payables, and offsets to other derivative positions, as well as certain assets that do not fall into any of the portfolio composition categories. Depending on the extent to which the fund invests in derivatives and the number of positions that are held for future settlement, Net Other Assets can be a negative number. "Tax-Advantaged Domiciles" represent countries whose tax policies may be favorable for company incorporation. |
| Net Other Assets can include fund receivables, fund payables, and offsets to other derivative positions, as well as certain assets that do not fall into any of the portfolio composition categories. Depending on the extent to which the fund invests in derivatives and the number of positions that are held for future settlement, Net Other Assets can be a negative number. Credit ratings for a rated issuer or security are categorized using Moody' s Investors Service (Moody's). If Moody's does not publish a rating for a security or issuer, then the Standard & Poor's Ratings Services (S&P) rating is used. When S&P and Moody's provide different ratings for the same issuer or security, the Moody's rating is used. Securities that are not rated by these NRSROs are categorized as Not Rated. All U.S. government securities are included in the U.S. Government category. The table information is based on the combined debt investments of the fund and its pro-rata share of any debt investments in other Fidelity funds. |
| Fund Information Manager(s): Bill Maclay Trading Symbol: FRIFX Start Date: February 04, 2003 Size (in millions): $4,658.62 Morningstar Category: Fund Moderate Allocation Stock markets, especially foreign markets, are volatile and can decline significantly in response to adverse issuer, political, regulatory, market, or economic developments. Fixed income investments entail interest rate risk (as interest rates rise bond prices usually fall), the risk of issuer default, issuer credit risk and inflation risk. Foreign securities are subject to interest rate, currency exchange rate, economic, and political risks. Lower-quality bonds can be more volatile and have greater risk of default than higher-quality bonds. Changes in real estate values or economic downturns can have a significant negative effect on issuers in the real estate industry. The value of securities of issuers in the real estate industry can be affected by changes in real estate values and rental income, property taxes, interest rates, tax and regulatory requirements, and the management skill and creditworthiness of the issuer. Definitions and Important Information Information provided in, and presentation of, this document are for informational and educational purposes only and are not a recommendation to take any particular action, or any action at all, nor an offer or solicitation to buy or sell any securities or services presented. It is not investment advice. Fidelity does not provide legal or tax advice. Before making any investment decisions, you should consult with your own professional advisers and take into account all of the particular facts and circumstances of your individual situation. Fidelity and its representatives may have a conflict of interest in the products or services mentioned in these materials because they have a financial interest in them, and receive compensation, directly or indirectly, in connection with the management, distribution, and/or servicing of these products or services, including Fidelity funds, certain third-party funds and products, and certain investment services. Characteristics Duration is a measure of a security's price sensitivity to changes in interest rates. Duration differs from maturity in that it considers a security's interest payments in addition to the amount of time until the security reaches maturity, and also takes into account certain maturity shortening features (e.g., demand features, interest rate resets, and call options) when applicable. Securities with longer durations generally tend to be more sensitive to interest rate changes than securities with shorter durations. A fund with a longer average duration generally can be expected to be more sensitive to interest rate changes than a fund with a shorter average duration. 30-day SEC Yield is a standard yield calculation developed by the Securities and Exchange Commission for bond funds. The yield is calculated by dividing the net investment income per share earned during the 30-day period by the maximum offering price per share on the last day of the period. The yield figure reflects the dividends and interest earned during the 30-day period, after the deduction of the fund's expenses. It is sometimes referred to as "SEC 30-Day Yield" or "standardized yield". 30-Day SEC Restated Yield is the fund's 30-day yield without applicable waivers or reimbursements, stated as of month-end. Net Asset Value is the dollar value of one share of a fund; determined by taking the total assets of a fund, subtracting the total liabilities, and dividing by the total number of shares outstanding. Important Fund Information Relative positioning data presented in this commentary is based on the fund's primary benchmark (index) unless a secondary benchmark is provided to assess performance. Indices It is not possible to invest directly in an index. All indices represented are unmanaged. All indices include reinvestment of dividends and interest income unless otherwise noted. FID Real Estate Income Composite Index is a customized blend of the following unmanaged indices: Bloomberg U.S. CMBS ex-AAA ex-Agency Guaranteed Index, Bloomberg US CMBS ex AAA Index, FTSE NAREIT - All REITs, ICE BofA US Real Estate Index, MSCI REIT Preferred Index. The composition differed in periods prior to June 03, 2024. ICE BofA U.S. High Yield Constrained Index is a modified market capitalization weighted index of US dollar denominated below investment grade corporate debt publicly issued in the US domestic market. Qualifying securities must have a below investment grade rating (based on an average of Moody's, S&P and Fitch). The country of risk of qualifying issuers must be an FX-G10 member, a Western European nation, or a territory of the US or a Western European nation. The FX-G10 includes all Euro members, the US, Japan, the UK, Canada, Australia, New Zealand, Switzerland, Norway and Sweden. In addition, qualifying securities must have at least one year remaining to final maturity, a fixed coupon schedule and at least $100 million in outstanding face value. Defaulted securities are excluded. The index contains all securities of The ICE BofA US High Yield Index but caps issuer exposure at 2%. S&P 500 Index is a market capitalization-weighted index of 500 common stocks chosen for market size, liquidity, and industry group representation to represent U.S. equity performance. Bloomberg U.S. Aggregate Bond Index is a broad-based, market-value-weighted benchmark that measures the performance of the investment grade, U.S. dollar-denominated, fixed-rate taxable bond market. Sectors in the index include Treasuries, government-related and corporate securities, MBS (agency fixed-rate and hybrid ARM pass-throughs), ABS, and CMBS. FTSE NAREIT All REITs Index is a market capitalization-weighted index that is designed to measure the performance of all tax- qualified Real Estate Investment Trusts (REITs) that are listed on the New York Stock Exchange, the NYSE MKT LLC, or the NASDAQ National Market List. MSCI REIT Preferred Index is a preferred stock market capitalization-weighted index of certain exchanged-traded perpetual preferred securities issued by US Equity and US Hybrid REITS. ICE BofA US Real Estate Index is a market capitalization-weighted index of US dollar denominated investment grade corporate debt publicly issued in the US domestic market by Real Estate issuers. It is a subset of the ICE BofA US Corporate Index. Qualifying securities must have an investment grade rating (based on an average of Moody's, S&P and Fitch) and an investment grade rated country of risk. In addition, qualifying securities must have at least one year remaining to final maturity. Bloomberg US CMBS ex AAA Index is a subset of the larger Bloomberg US CMBS Index that includes commercial mortgage backed securities (CMBS) with ratings of AA through BBB-, inclusive. The quality rating for each security is determined by taking the middle of three ratings if a bond is rated by all three agencies (Moody's, Fitch, and S&P) and the lower of the two ratings if a bond is rated by just two agencies. Market-Segment Weights Market-segment weights illustrate examples of sectors or industries in which the fund may invest, and may not be representative of the fund's current or future investments. They should not be construed or used as a recommendation for any sector or industry. Ranking Information © 2024 Morningstar, Inc. All rights reserved. The Morningstar information contained herein: (1) is proprietary to Morningstar and/or its content providers; (2) may not be copied or redistributed; and (3) is not warranted to be accurate, complete or timely. Neither Morningstar nor its content providers are responsible for any damages or losses arising from any use of this information. Fidelity does not review the Morningstar data and, for mutual fund performance, you should check the fund's current prospectus for the most up-to-date information concerning applicable loads, fees and expenses. % Rank in Morningstar Category is the fund's total-return percentile rank relative to all funds that have the same Morningstar Category. The highest (or most favorable) percentile rank is 1 and the lowest (or least favorable) percentile rank is 100. The top-performing fund in a category will always receive a rank of 1%. % Rank in Morningstar Category is based on total returns which include reinvested dividends and capital gains, if any, and exclude sales charges. Before investing in any mutual fund, please carefully consider the investment objectives, risks, charges, and expenses. For this and other information, call or write Fidelity for a free prospectus or, if available, a summary prospectus. Read it carefully before you invest. Past performance is no guarantee of future results. Views expressed are through the end of the period stated and do not necessarily represent the views of Fidelity. Views are subject to change at any time based upon market or other conditions and Fidelity disclaims any responsibility to update such views. These views may not be relied on as investment advice and, because investment decisions for a Fidelity fund are based on numerous factors, may not be relied on as an indication of trading intent on behalf of any Fidelity fund. The securities mentioned are not necessarily holdings invested in by the portfolio manager(s) or FMR LLC. References to specific company securities should not be construed as recommendations or investment advice. Diversification does not ensure a profit or guarantee against a loss. S&P 500 is a registered service mark of Standard & Poor's Financial Services LLC. Other third-party marks appearing herein are the property of their respective owners. All other marks appearing herein are registered or unregistered trademarks or service marks of FMR LLC or an affiliated company. Fidelity Brokerage Services LLC, Member NYSE, SIPC, 900 Salem Street, Smithfield, RI 02917. Fidelity Distributors Company LLC, 500 Salem Street, Smithfield, RI 02917. © 2024 FMR LLC. All rights reserved. Not NCUA or NCUSIF insured. May lose value. No credit union guarantee. 694684.42.0 |
Editor's Note: The summary bullets for this article were chosen by Seeking Alpha editors.