hapabapa
Investment Thesis
For the past year, I've been warning investors that public cloud providers aren't the cash cows many believe them to be when it comes to Generative AI. Earlier this year, I analyzed the token prices available on Azure and AWS websites and found that even if AI generated all books published in 2023, the earnings for cloud giants like Microsoft's (MSFT) Azure Cloud would be a mere $17 million, and even less for Amazon's (NASDAQ:AMZN) AWS due to its lower pricing points.
I concluded that Amazon is in a difficult situation, needing to invest aggressively in Generative AI infrastructure to remain relevant while suffering from low pricing influenced by the altruistic mission of OpenAI's board.
Q2 2024 results confirmed these dynamics, and I don't see a clear near-term solution. This is partly because Amazon's strategy has always been centered around its e-commerce business, with its tech ventures confined as offshoots of its core business.
I believe that Amazon needs to undergo a major strategic shift, which will likely include a leadership change.
Amazon's Unfavorable AI Market Position
Amazon can't afford not to invest in GPUs. They need to keep up with Azure, which has been rapidly closing the gap in the public cloud market, offering at least the same services as Azure. But unlike Microsoft, Amazon doesn't have value-added software products and subscriptions that compensate for the low token processing prices prevalent in the industry.
Microsoft has a massive advantage with its suite of enterprise and consumer software. This allows them to integrate AI into existing products and adopt a subscription-based pricing model, like GitHub Copilot for developers and Copilot Pro Assistant for Microsoft Office users, retailing for $19 and $30 per user per month, respectively.
In simple words, Amazon's returns on Generative AI investment are less than those of Microsoft, a factor that underpins our Buy rating for Microsoft, and the Hold rating for Amazon.
Amazon's Strategy Unfit in Generative AI Era
Amazon has traditionally been laser-focused on e-commerce. Their ventures outside of this core business have typically emerged as offshoots from the e-commerce business. Take AWS for example. It was born out of a website crash, not a grand vision for cloud domination. Their drone and robotics business was created to lower the delivery and warehouse costs of Amazon's e-commerce. Fire tablets business segments are designed specifically for eBook customers. Prime Video and Prime Music are offered for free for Amazon Prime subscribers to enhance the value proposition of its free delivery feature - although it is worth noting that Amazon recently introduced ads to Prime Video, and added a subscription to unlock some features in the Amazon Music segment.
This lack of a subscription-based mindset in verticals beyond its e-commerce is a major roadblock for Amazon when it comes to AI monetization. And it's not just me saying this. Mainstream media is finally catching on to the monetization challenges, something I've been warning my +5K followers about for over a year.
To make real money in this space, you need a value-added element, ideally a subscription model, which is far removed from Amazon's comfort zone.
Looking at Q2 results, we can see this dynamic playing out, with Amazon shares down 10% after its earnings release. To me, and many of my followers, the only surprise is that the market wasn't prepared, even though I've been warning anyone who'd listen for quite some time.
Slowing Growth
Amazon's 10% year-over-year growth in net sales in Q2'24, while positive, is underwhelming when considering the backdrop of 3.2% inflation. This means real growth is closer to 6.8%, a figure that hardly screams growth.
The law of large numbers is clearly at play here. For a behemoth like Amazon, achieving double-digit growth becomes increasingly difficult. The 10% uptick, while still significant in absolute terms, signals a potential slowdown in the company's overall growth trajectory.
Generative AI Growth Contribution
AWS came with strong quarterly figures, with an 18.7% increase in sales. However, the extent to which AI is driving this growth is unclear. It's crucial to remember that digital transformation trends were already propelling AWS's growth before generative AI. Attributing the entirety of AWS's success to AI would be misleading. Drawing parallels from Microsoft's recent results, only 8% of Azure's 30% growth in the twelve months ended June 2024 is attributable to AI, according to Microsoft's earnings released last week. AWS, which is playing catchup, is probably less.
The Real Star of the Show
The star of the show was Amazon's ad business, growing 22% in the quarter. Amazon has recently started introducing limited ads for Prime Video to help monetize its massive media and film production investments. From my understanding, there is a shift of ad dollars closer to the point of sale, increasing the number of ads being promoted on Amazon's platform where purchase decisions happen.
The Sum of Parts Valuation
When comparing Amazon's valuation using the sum of parts method, I see a company that is fully valued. If Amazon maintains its growth rates throughout 2024, I expect consolidated revenue to reach $640 billion this year. Below are my sales expectations for 2024 by business segment, calculated using growth rates in H1 2024 to forecast 2024 revenues.
| Net Sales: Millions | H1 2023 | H1 2024 | YoY % | 2024E Sales |
| Online stores | $104,062 | $110,062 | 6% | $245,241 |
| Physical stores | $9,919 | $10,408 | 5% | $21,017 |
| Third-party service | $62,152 | $70,797 | 14% | $159,534 |
| Advertising | $20,192 | $24,595 | 22% | $57,134 |
| Subscription services | $19,551 | $21,588 | 10% | $44,398 |
| AWS | $43,494 | $51,318 | 18% | $107,083 |
| Other | $2,371 | $2,522 | 6% | $5,274 |
| Consolidated | $261,741 | $291,290 | 11% | $639,675 |
Value of Amazon's Retail Operations
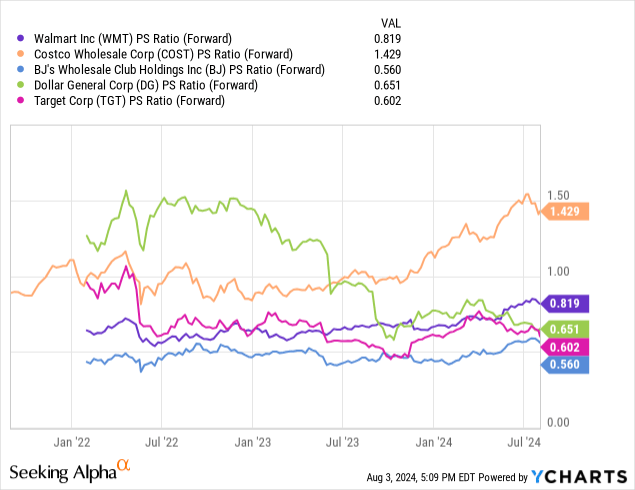
Amazon's online and physical stores closely resemble the broader retail market. To assess the value of this segment, I use the price-to-sales ratio of comparable retail companies with similar growth shown below. Based on an average PS ratio of 0.8x, I value Amazon's retail operations at $196 billion.
Value of Amazon's Third-Party Service
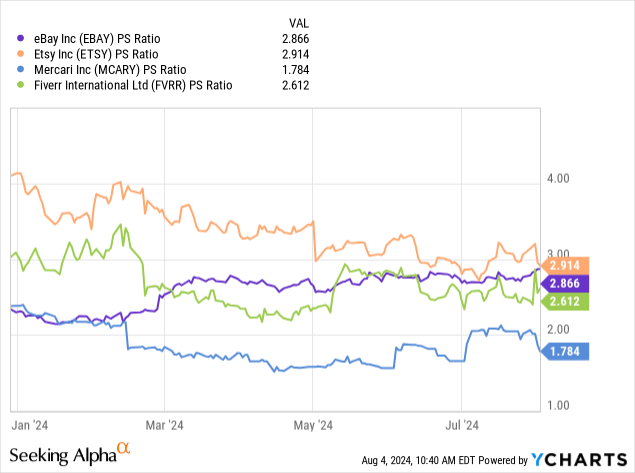
Third-party services include fees Amazon collects from third-party sellers on its platform for services such as fulfillment and commissions. Companies with a focus on third-party service for products where third-party sellers bear inventory risk include Etsy (ETSY), an e-commerce platform known for selling handmade, vintage, and crafts items, mainly by third-party sellers. Fiverr (FVRR) while not an e-commerce, derives the majority of its revenue from commissions from freelancers offering services on its platform. Finally, I included eBay (EBAY), which earns revenue mostly through listing fees and transaction fees. With an average PS ratio of 2.5x, I value Amazon's third-party services segment at $400 million.
Value of Amazon's Media Subscription Business Segment
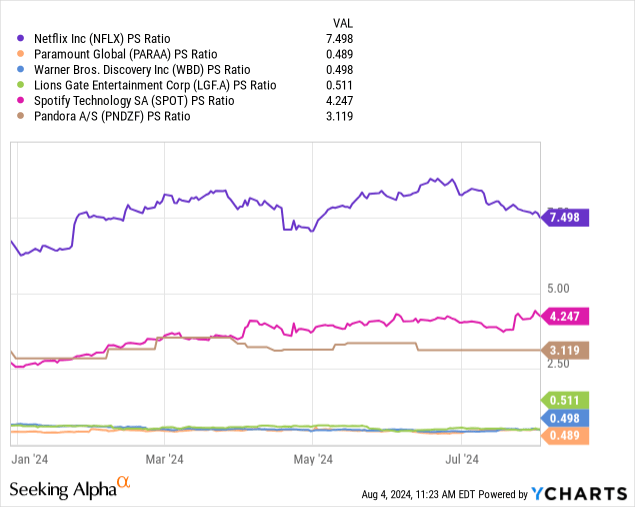
Amazon's subscription revenue, which includes Amazon Prime, Amazon Prime Video, Amazon Music, and other services, aligns with the business model of various publicly traded companies, including Netflix (NFLX). The risks of Amazon Productions, including media marketed under the Amazon Original brand, align with media companies such as Lions Gate (LGF.A) and Paramount (PARAA). Amazon Music also competes with Spotify (SPOT) and Pandora (OTCPK:PNDZF). Using the average PS ratio of these companies, I value Amazon's subscription services segment at $118 billion, based on an average PS ratio of 2.7x.
Value of Amazon's Ad Business
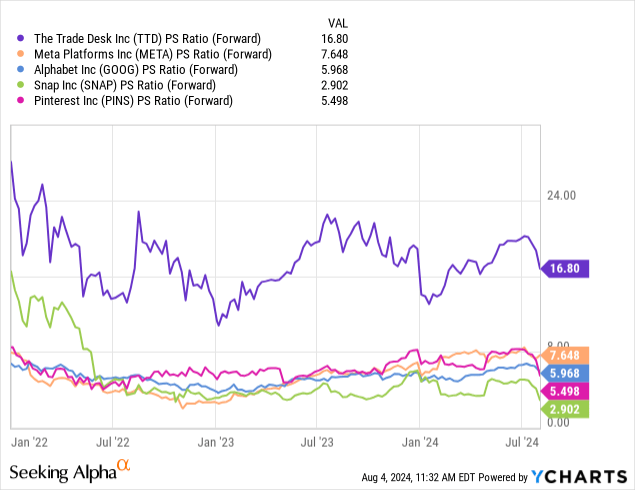
Amazon's ad business competes with a broad number of companies with different business models. Companies that derive the majority of earnings from ads revenue used in this analysis are Trade Desk (TTD), Meta (META), Alphabet (GOOG), Snap (SNAP), and Pinterest (PINS).
Using an average PS ratio of 7.7x, I value Amazon's ad segment at $443 billion.
Value of Amazon's Public Cloud Segment
AWS's operating margins grew this year, driven by Amazon's efforts to optimize staff costs following last year's hiring spree in response to the tight job market a year earlier. Another contributor to AWS's margin improvement is changes in accounting inputs, particularly the useful live estimates of its servers. All-in-all, this pushed operating margins up to 36.5%.
In the past three years, the AWS segment has returned modest Free Cash Flows 'FFO', with spending on Property Plants & Equipment 'PPE' eating away significant portions of Operating Income. In the latest earnings call, management noted it expects higher CapEx investments in 2024.
This complicates valuation, pushing profitability estimates further into the future. But, I rely on one key assumption, which is that AWS will remain at the center of the global cloud infrastructure, and will become more free cash flow profitable.
| AWS (Millions $) | 2021 | 2022 | 2023 |
| Net sales | $62,202 | $80,096 | $90,757 |
| Operating expenses | $43,670 | $57,255 | $66,126 |
| Operating income | $18,532 | $22,841 | $24,631 |
| Depreciation & Amortization | $10,653 | $9,876 | $12,531 |
| EBITDA | $29,185 | $32,717 | $37,162 |
| Investment in PPE | $22,047 | $27,755 | $24,843 |
| Free Cash Flow | $7,138 | $4,962 | $12,319 |
Depreciation and Amortization expenses have typically stood at 20% of the segment's Property, Plant, and Equipment 'PPE', implying an average useful life of 5 years. Given the rapid pace of technological advancements in semiconductor technology, which constitutes a significant portion of AWS's PPE assets, this doesn't seem unrealistic.
I built a Discounted Cash Flow 'DCF' model to value the AWS segment with the following assumptions in mind:
- Deceleration in growth rates over the next five years.
- Operating income as a percentage of revenue remains fixed at 71%.
- CapEx reaches equilibrium with depreciation expense by 2028.
- Weighted average cost of capital 'WACC' = 7%, risk-free rate 'Rf' = 4% and terminal growth 'g' = 2%
Using these estimates, I arrive at a fair value of the AWS segment of 1.1 Trillion
Author's estimates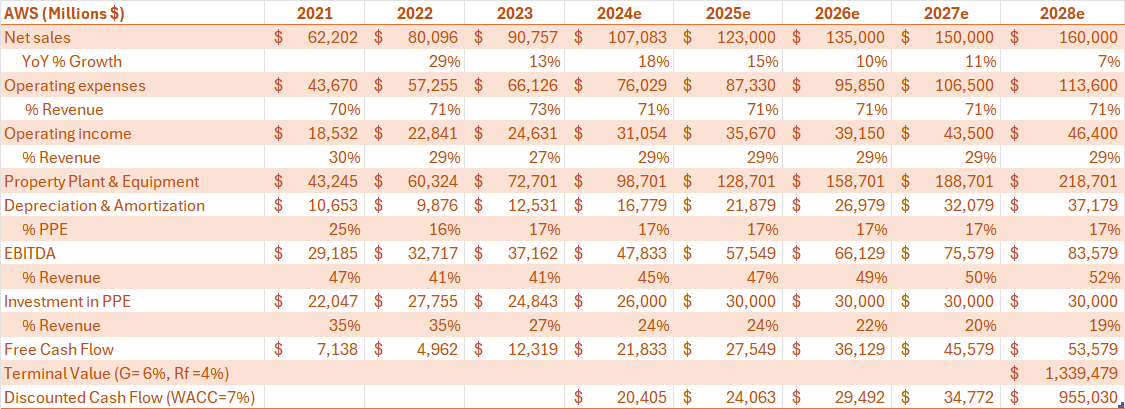
The following table summarizes our Sum of Parts analysis
| Segment | Estimated Value |
| Online and physical stores | $196 billion |
| Third-party seller services | $400 billion |
| Ad business | $443 billion |
| Subscription services | $118 billion |
| AWS | $1,063 billion |
| Total | $2,220 billion |
Based on this analysis, I see limited upside potential from here. Although Amazon's current market cap of $1.8 trillion is 23% lower than our estimate, this difference falls within a relatively narrow margin of error.
Summary and How I Might Be Wrong
Although the global selloff has a macroeconomic undercurrent behind it, after weak unemployment data of last week created panic in the market, a big part of it is also a weak performance of large tech companies with heavy weights in market indexes piling on the bearish trades that created the volatility we're seeing today.
Looking at Amazon in particular, and zooming on the expected return on capital, I see the e-commerce giant as the weakest link in the Magnificent 7 group. Repeated earnings disappointments are a possibility in the coming quarters and next year. This underlies our Buy rating for Microsoft and Hold rating on Amazon.
From a valuation standpoint, at current levels as of Friday's market close last week, the company seems fairly valued. A sum-of-parts analysis reveals that AWS is Amazon's crown jewel, being the biggest contributor to valuation. I used a number of estimates based on the current macroeconomic environment, which could change, rendering valuation obsolete. However, I think that my DCF model is a reliable gauge of the approximate value of Amazon's AWS segment.