Steve Lewis Stock/DigitalVision via Getty Images
American Electric Power Company (NASDAQ:AEP) is well positioned to outperform the market with a superior blend of growth and value. Incremental power demand in AEP’s markets creates a potentially decades long runway of above normal rate base growth, which portends 6%-7% annual earnings CAGR. Between the growth, dividend and valuation, we believe AEP will significantly outperform the S&P going forward.
We shall begin with fundamental analysis discussing its pipeline and growth trajectory and then follow with why we believe AEP is mispriced relative to the broader market.
High load growth with strong returns on incremental capital
Electric utilities tend to be conservatively run companies. Their job is to reliably provide power at a reasonable cost. It is about consistent execution, not swinging for the fences, so there tends to be less operating differentiation among utilities than in other sectors. Nearly all of them simply follow industry best practices.
With operations consistently solid, one of the main points of differentiation is geographic coverage areas. Those in higher load growth areas will have more opportunity to grow. This is why we liked Dominion’s (D) access to data center growth in NOVA and Pinnacle West’s (PNW) population and job growth in Phoenix.
AEP is similarly advantaged, as it covers close to half of Texas.
AEP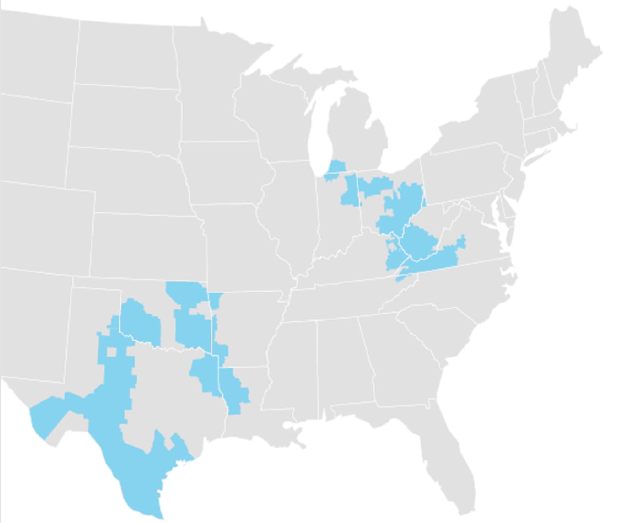
Low regulation, plentiful land and low cost of living are driving demand of all sorts to Texas, causing a simultaneous boom in industrial manufacturing, population and data centers. Vistra (VST) estimates Texas will need an extra 40GW of power capacity by 2030, representing approximately 50% growth.
VST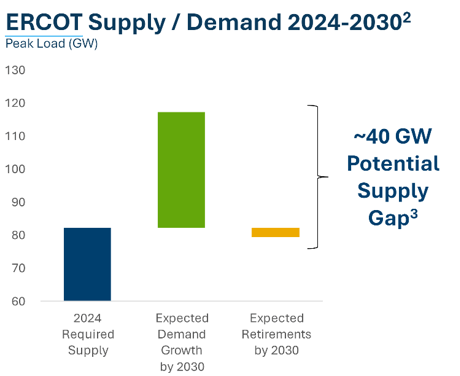
As one of the largest utilities in Texas, AEP is positioned to capture much of that growth into its rate base. In February of 2024, AEP filed a fresh rate case, which was settled in October of 2024 at an ROE of 9.76%
AEP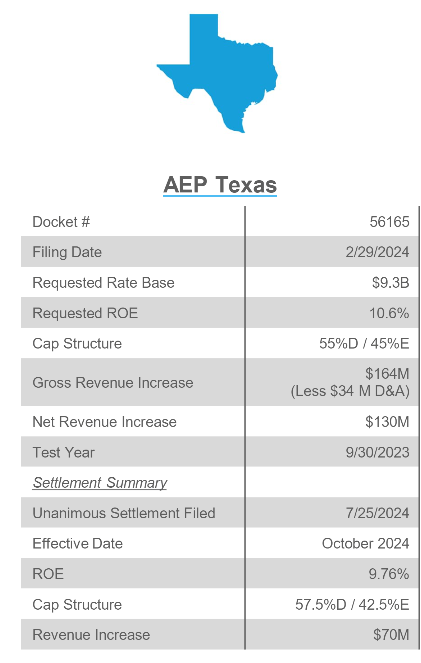
That is a very healthy ROE.
With all the incremental demand drivers, AEP already has customer commitments for 15GW of incremental load by 2030. Not all of that is Texas, but a good chunk of it is, and AEP’s ROEs are similar in its other areas.
All this incremental load requires substantial generation and transmission investment to service. AEP estimates $43B of incremental capex by 2028.
AEP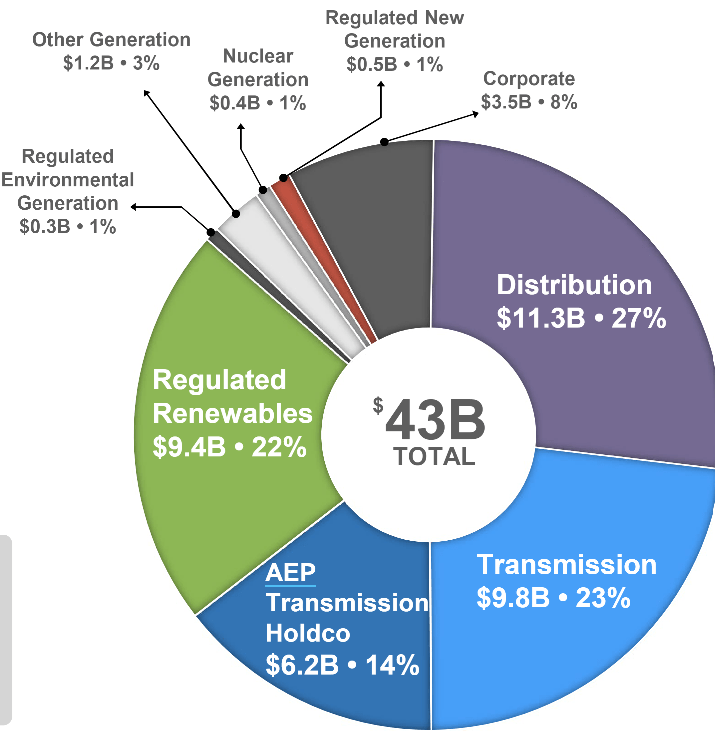
That is huge rate base growth and with an ROE of 9.76% on that rate base, it represents substantial earnings growth as well.
With so many of the customers already committed, and the major rate cases already settled, there is a significant amount of visibility into rate base growth and earnings growth.
AEP is looking at a forward earnings CAGR of 6%-7%. Given the duration of demand drivers, we believe that growth rate will last more than a decade.
It is faster growth by a percentage point or two compared to what is normal for utilities, and that is because load growth is much faster than normal.
The market has not properly repriced AEP for its faster growth rate, which, we believe, makes the stock opportunistically priced.
The outperformance hypothesis
Long-term outperformance comes from a combination of entry valuation, growth and dividends. On aggregate, we believe AEP is significantly more opportunistic than the S&P. Here is our math:
Since 1989 the S&P has grown earnings at a nominal CAGR of 7.8%. Personally, I think growth will slow due to the economy slowing, but let’s go with that long run average.
S&P dividend yield is 1.26%.
If that growth rate continues and multiples stay the same, the S&P should return roughly 9% annually. Note that this is not a wild number. There are all sorts of long-term return estimates out there, and 9% is middle of the pack.
Contrast that with AEP’s return outlook.
AEP has a long runway of 6%-7% earnings growth, so let’s say 6.5%.
AEP has a 3.5% yield.
Assuming flat earnings multiples, AEP would trade up 6.5% each year to match its earnings and investors get the 3.5% dividend on top for annual returns of about 10%.
That sets AEP up to outperform the S&P.
Additionally, there are 2 other factors to consider:
- Lower volatility
- Earnings multiple normalization
Lower volatility
While the S&P may have grown earnings at 7.8% CAGR historically it has been a very bumpy ride. In 2008, the S&P lost 77.8% of its earnings, which it clawed back in 2009 and 2010. In 2020, the S&P lost 32% of its earnings, which again were clawed back in the post-pandemic economy.
There have even been bumps in seemingly normal economic environments, with the S&P losing 15.4% of its earnings in 2015.
In hindsight, these events are not that scary because we know that the S&P made a full recovery, but they are quite terrifying to invest through. Going forward, we don’t know with certainty how quickly the S&P will recover from future shocks.
Volatility of this nature is why cyclical stocks tend to trade at lower multiples than defensive stocks. It is also why utilities should trade at a higher multiple than the S&P.
AEP has been around for over a century, so it has had to deal with all the same challenges as the S&P, but it's extremely steady business model has made recessions seemingly irrelevant. Book value has climbed consistently for 20 years.
S&P Global Market Intelligence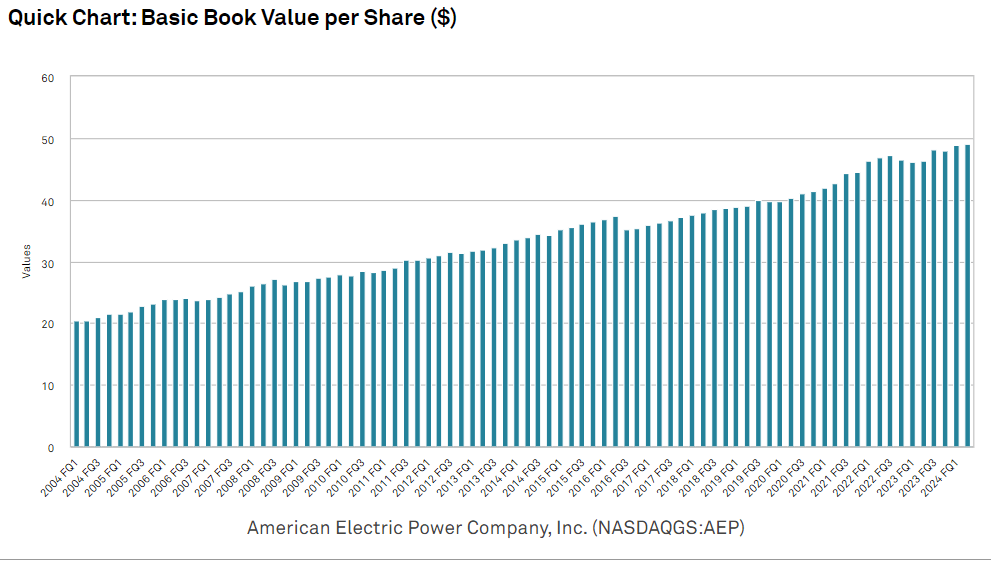
Dividends to shareholders have also climbed consistently for 20 years.
S&P Global Market Intelligence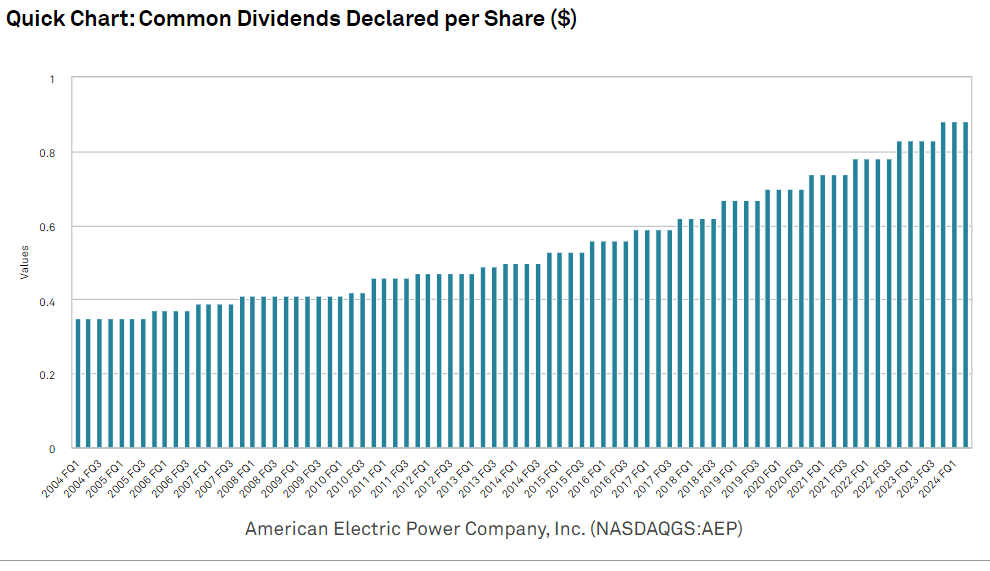
Investors correctly like this sort of stability, and it should result in higher multiples.
Multiple normalization
The S&P is unusually expensive right now, with a trailing multiple of 30X. Over time, I think it will trend back down to more historically normal levels.
AEP has a trailing multiple of 20X and a forward multiple of 17X. With its now higher growth rate, I think AEP will trade up closer to 19X forward earnings.
Valuation relative to other utilities
AEP, on a leverage adjusted basis, is trading about in line with peers. Its 16.91X forward multiple is lower than the rest, but AEP also has slightly higher leverage at 5.78X debt to EBITDA.
2MC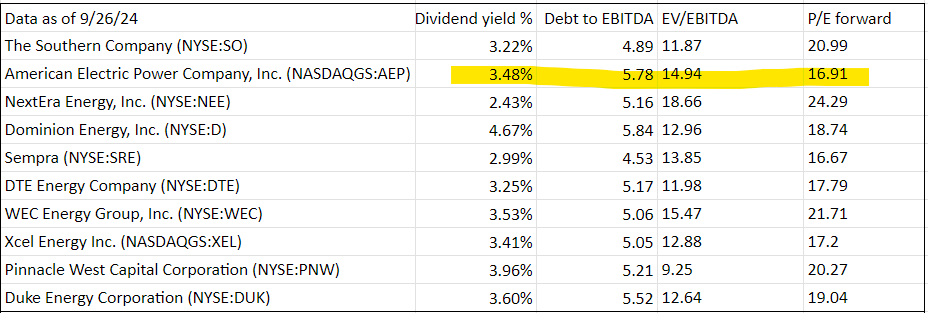
I believe the sector in general is opportunistic with strong fundamentals and attractive valuation.
Within the sector, AEP is a way to target the rapid load growth of Texas. Some analysts are less bullish on the sunbelt, but I think its population, job and industry dominance will continue.

At Portfolio Income Solutions we do ad hoc analysis of special situations as well as full reports on specific stock. If you found this analysis compelling please check out our library of work which you can access at a discounted rate through this link.
https://seekingalpha.com/affiliate_link/40Percent
I hope you enjoy the plethora of data tables, sector analysis and deep dives into opportunistic stocks.