A serious glut of natural gas has appeared in the North American market and has caused havoc with its price. Analyzing the data shows those trends have begun to reverse and movements into storage indicate the glut will soon be removed, which should allow natural gas prices to rise to a level that restores profitability, a substantial increase from present levels.
How did the glut come into being?
Natural gas drilling has gone through an amazing transformation during the last decade with the widespread adoption of two phenomena: hydraulic fracturing and horizontal drilling. Hydraulic fracturing, more commonly referred to as just "fracking" has actually been around since 1947 but first came to more widespread use in 1997 in the Barnett shale. Simply stated it is the process of injecting a pressurized fluid from a wellbore to fracture the rock formation into which it has been injected. This allows the hydrocarbons in the formation to travel up these fractures allowing for their easier extraction. This process has allowed for the extraction of natural gas from shale formations, which has introduced a vast source of newly recoverable natural gas from many regions in the southern and eastern parts of the USA.
Horizontal drilling (sometimes referred to as slant drilling or directional drilling) has increased the productivity from wells so drilled as many reservoirs are more horizontal in nature. This technique increases the exposed section length through the reservoir by drilling it at an angle. Together these techniques effectively unlocked massive amounts of shale gas and helped create a significant increase in the natural gas rig count. From 1999 to 2009 the natural gas active rig count increased from roughly 500 to over 1600. Production exceeded consumption, significantly, gas became plentiful. During the winter of 2011/2012, weather was unusually mild causing less electricity to be used for heating. This reduced natural gas consumption contributing to a major glut of natural gas.
How much of a glut is there?
The glut was significant, about 60% above the 5 year average at the beginning of this injection season. Natural gas is stored (in underground structures) and there is a finite amount of gas that can be stored. That amount of maximum storage capacity is estimated to be about 4,200 billion cubic feet. Gas in storage is very much a function of peak and trough usage. There are times of the year when consumption exceeds production and inventories of gas in storage decline, "withdrawal season". This runs from November through March. From April through October, production exceeds consumption and inventories build through what is called "injection season". Many will be familiar with the following graph produced and updated by the EIA, showing the two seasons:
Click to enlarge
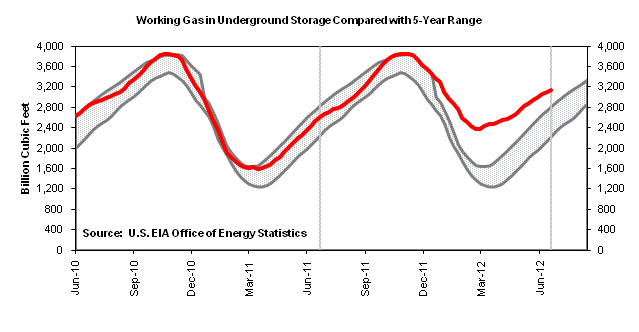
Note: The shaded area indicates the range between the historical minimum and maximum values for the weekly series from 2007 through 2011.
Source: Form EIA-912, "Weekly Underground Natural Gas Storage Report." The dashed vertical lines indicate current and year-ago weekly periods.
As the graph depicts, this year we began injection season with inventories 60% above the 5 year average (2,437 bcf this year versus the 5 year average of 1,514 bcf). For the last 5 years, the average inventory build over the injection season has been 2,146 bcf. A normal injection season would take inventories above storage capacity, a prospect that could have a devastating effect on gas prices. Just a few months ago, pundits were calling for this to happen and for natural gas prices to approach zero.
Injections are below normal this season, for two fundamental reasons
Natural gas inventories are building at a much slower rate this season. The glut that was built caused natural gas prices to plummet from $14 to a low of $1.92 reached this April 19. The reduction in prices was so steep that it has brought gas to a level that is below most fields all-in cost of production. When the economics are such that you are forced to sell below cost, production naturally curtails. The natural gas rig count has fallen dramatically from a peak of over 1,600 to 522 as at July 13, as drilling new wells ceased to be profitable.
The other factor at work here is the decline rate that all wells go through. Natural gas wells are most productive after they are initially drilled and then decline thereafter over their natural lifetime. Horizontally drilled wells are unique in that their decline rate is very steep after the first year, falling by about 70%. The growth in horizontal wells has contributed to an increased overall decline rate.
The injection and storage numbers show the glut being removed
So far this season, injections are well behind the 5 year average. The glut, which began this injection season at 60% above the 5 year average inventory level is now only 19% above the 5 year average inventory level. From week 12 to week 28 this year injections have totaled 766 bcf, compared to the 5 year average for that period of 1,087 bcf, a reduction of 30%. If the trend continues at 30% below the 5 year average, storage at the end of injection season (beginning November) should be at 3,761 bcf, only 80 bcf above the 5 year average. The glut will effectively be removed.
But the story does not end here. The rate of injection relative to the 5 year average has been declining over the course of the injection season. I track the current year 4 week rolling average which has been declining steadily relative to the 5 year 4 week rolling average. Most recently the current year 4 week average is 43% below the 5 year 4 week average. If the rate of injections continues at that rate, this forecasts a season end inventory of 3,627 bcf, which is slightly below the 5 year average.
What is the implication of this forecast?
A removal of the supply glut should elevate the price of natural gas to its full cycle cost of production plus a reasonable profit. We are seeing basic economics at work. Markets are in the long term pursuit of equilibrium. When supply and demand get out of balance, the price mechanism adjusts to restore equilibrium. Excessive supply brought prices down. Producers will exhibit rational behavior in the long run, and they will curtail production at prices that are below cost. We should expect no significant deviation from this pattern of lower injections until equilibrium prices are achieved, meaning total costs plus reasonable profit. Different companies operating in different fields have different cost structures so it is difficult to make a general statement about industry-wide costs and therefore where prices will return to. However, from what I have read from a variety of sources, I think that costs plus a reasonable profit forecasts $5 - $6 natural gas. It likely won't be a steady rise to that point, but once the market accepts that the glut has been removed, prices should get there. The time frame for this to occur should be measured in months, not years.
How can one invest to profit from this forecast?
There are a few different ways to do this.
One is to purchase natural gas commodity futures. Futures are complex and often require the use of leverage and will appeal only to the most sophisticated investors.
Another is to purchase the United States Natural Gas ETF (UNG). UNG buys front and near month futures and rolls them into the subsequent month as they expire. One needs to be very careful and consider the normal roll cost associated with rolling front month contracts on a commodity that is normally in contango (future month prices higher than current). At the time of publication, the first 3 months prices are almost equal, indicating no contango, a relatively rare event.
You can purchase stocks in companies whose production is mostly natural gas. Names such as Encana (ECA), Chesapeake (CHK), Exco (XCO) and others are predominately gas producers. Or if you don't want individual names, there is the First Trust ISE-Revere Natural Gas ETF (FCG) which holds a diversified portfolio of natural gas E&P companies.
Conclusion
Since bottoming at $1.92 on April 19th, natural gas has risen 50% to $2.88, in just 3 short months. This has been the result of slowing in production growth occasioned by the declining rig count and steep year two decline rates. Injections into storage are occurring at a rate that is now substantially below the 5 year average. Until price recovery is sufficient to restore profitability, these trends are likely to continue. Consumption is a bit of a wild card here, as it is very weather dependent, and weather is capricious. This summer has started off hotter than normal which has helped to hasten reduction in the glut. Removing the supply glut should restore prices to marginal cost plus reasonable profit, which means the substantial price gains seen so far are just the beginning.
Disclosure: I am long UNG, XCO, OTCPK:PEYUF.