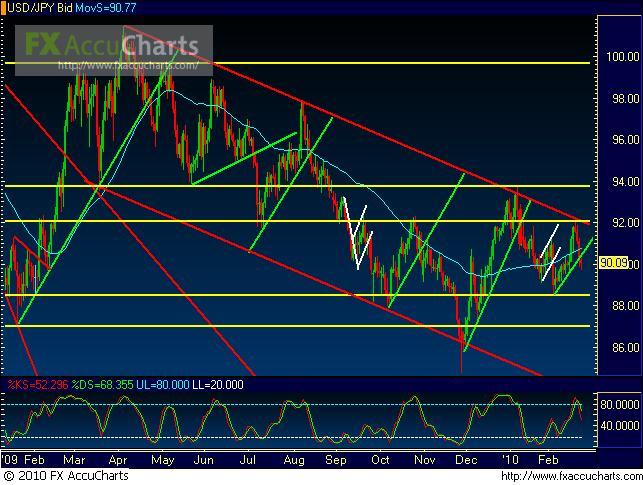
(Chart courtesy of FX Solutions' FX AccuCharts. Price on 1st pane, Slow Stochastics on 2nd pane; horizontal support/resistance levels in yellow; uptrend lines in green; downtrend lines in red; chart patterns in white; 50-period simple moving average in light blue.)
2/24/2010 – USD/JPY – Price action on USD/JPY, a daily chart of which is shown, has taken a decidedly bearish turn after having reached and respected last week the top border of a key parallel downtrend channel extending from the April high. The high that was reached on last week’s turn was just above the 92.00 price region. In the process of making this bearish turn within the context of the overall downtrend, price action has made a tentative breakdown below a short-term uptrend line extending from the early February low. With continued bearish momentum on this short-term trendline breakdown, price could initially target the 88.50 support/resistance price region, which represents the early February low, followed potentially by the 87.00 price region. Dynamic upside resistance within the context of the current bearish trend continues to reside around the top border of the noted parallel downtrend channel.
James Chen, CMT
Chief Technical Strategist
FX Solutions
IMPORTANT NOTICE: These comments are for information purposes only. The information contained on this document does not constitute a solicitation to buy or sell by FX Solutions, LLC., and/or its affiliates, and is not to be available to individuals in a jurisdiction where such availability would be contrary to local regulation or law. Opinions, market data, and recommendations are subject to change at any time. Forex trading involves substantial risk of loss and is not suitable for all investors.