Lots of technical readings are pointing to near term exhaustion. The economy may be getting healthier, but that has little to do with shorter term market moves. We could well see a correction lasting a few weeks. I wouldn't call what I expect to happen "The Top," but I think we see a solid pullback to the 1400s for a few weeks or more.
I believe in a few things. I believe that technical analysis works and Ichimoku is my preferred system (although there are many great methods). I also believe in patterns that occur over and over again, everywhere in the world, including markets. And finally, I believe that the market is so forward looking that it almost fears the recent strong economic data, because it indicates a greater chance of Fed monetary exit plans in the Fall.
As mentioned above, the strong data has mixed implications in trader/money manager psychology. That can be a catalyst, combined with temporary buyer exhaustion, to take some of the steam out of the market
Regarding Ichimoku, you can use Ichimoku a few different ways. It serves to show support and resistance levels. It helps you identify the trend. And it can provide you with good entry/exit setups. I think that it is important to use all of these in your analysis. So you want to find out, what is the big picture trend? What are my current big support levels? And would cause me to change that opinion?
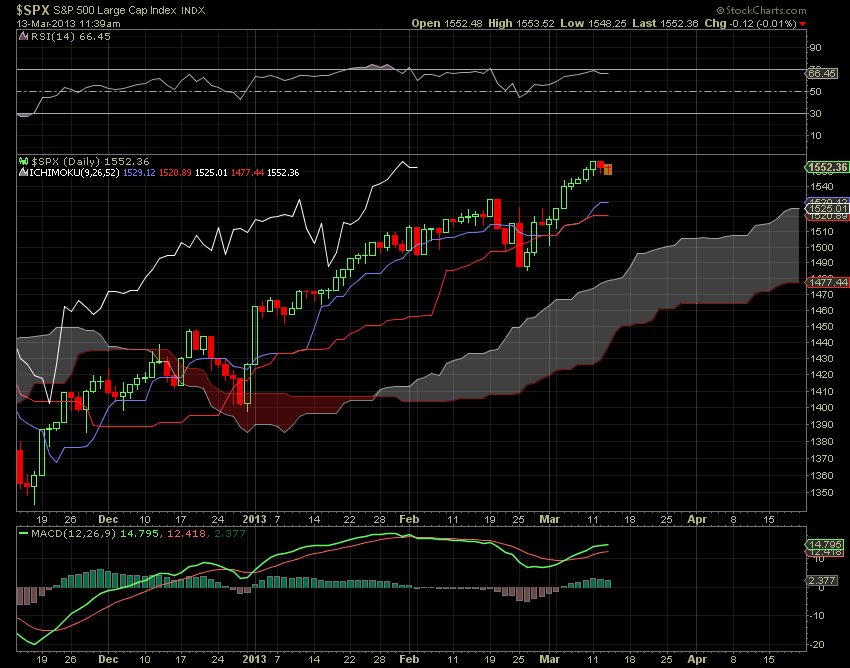
As you can see above, the fact that price is above the Tenkan (blue line) and Kijun (red line), above the cloud (shaded area), and the Chikou (white line), all show that the trend is up. The same goes for even larger time frames (weekly) as well. I like to use the four hr chart too, because it fits my holding period best. It is also indicating the trend is up. However, the four hr looks to be turning.
Regardless, if we close below 1447.50, here is what I expect to happen. We will test 1520, and may initially bounce off it, but due to the extreme size of the recent move, the lack of hedge fund holdings in cash, the weekly RSI of 70, and the finally "high" retail stock enthusiasm, I believe the pullback will go lower than 1520.
I believe we will follow the same pattern from last March, when we saw the same pattern. Below is a shot of what happened the same period last year. See the similarities?
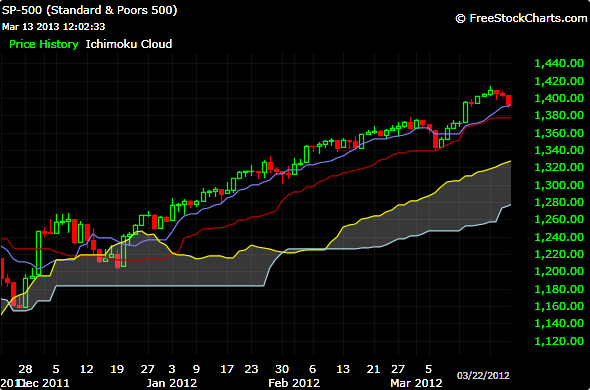
So what happened last year? Well, it's easier for me to explain how the analogy fits. We will bounce down to 1520, pause and then go to 1480ish. Then we will get a bounce back up to 1520, then 1480/90, then back up to towards the highs, before proceeding down to a bottom near 1440/50.
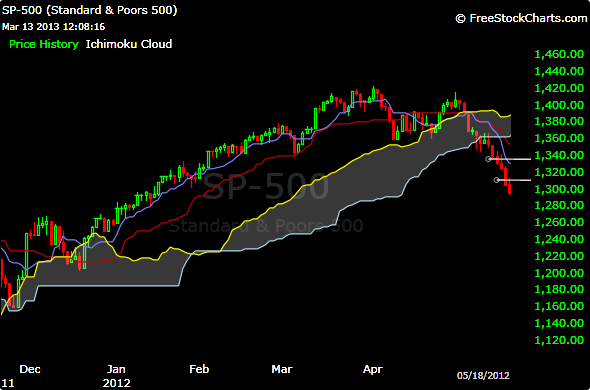
That's the analogy, roughly speaking, that happened last year and may happen again. Below is the chart showing how the rest of March and April played out last year...
The Play
I intend to buy an Apr 152/147/142 put butterfly for about .45 and look for a move to 1470-1500.
Follow-up @ 10:36am 3/14/13: Still haven't bought yet. Waiting for a close on hourly time frame below Kijun, which currently sits at 1554.
Disclosure: I am short SPY.
Additional disclosure: I added SPY 154 puts this afternoon.