With oil-rich Libya on the cusp of Civil War, Comex Gold traded back above $1400 the Troy ounce and Nymex Crude Oil breaks out to a new multi-year high, and is approaching $100 per barrel. The yield on the 10-Year US Treasury traded below 3.50%. Stock futures indicate a significantly lower open.
Comex Gold – ($1407.0) Tested $1411.5 this morning. Gold began the year in a parabolic rise that I predicted would pop at least back to my annual pivot at $1356.5, and when that level gave way I looked for my semiannual level at $1300.6 to hold, which it did on weakness to $1307.7 on January 28th. Gold appears positioned to rise towards monthly, quarterly and semiannual risky levels at $1412.4, $1441.7 and $1452.6.
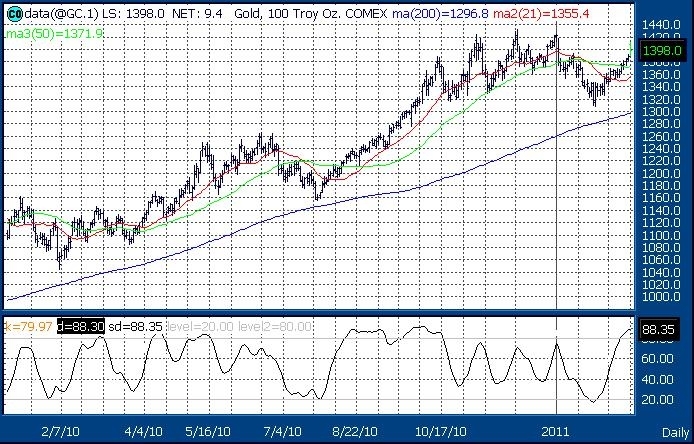
Courtesy of Thomson / Reuters
Nymex Crude Oil – ($95.39) A contract roll to the April contract plus the turmoil in Libya sparked a pop from $86.05 to $98.48 this morning. On February 15th crude oil became oversold with a test of $83.85 per barrel. Oil catapulted above my semiannual and monthly pivots at $87.52 and $91.83, and there’s no resistances until we get to my annual, semiannual and quarterly risky levels are $99.91, $101.92, $107.14 and $110.87.
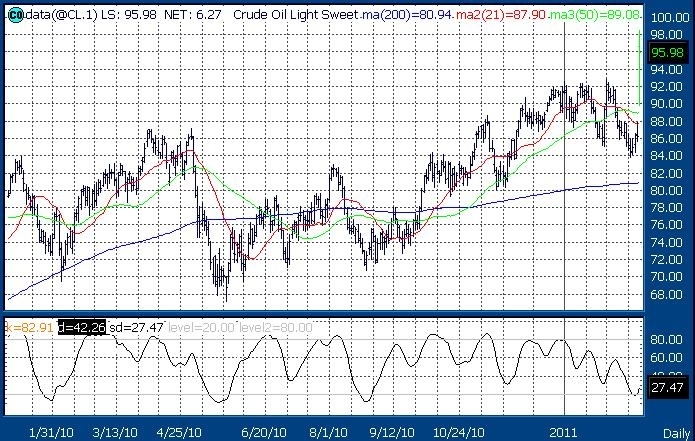
Courtesy of Thomson / Reuters
10-Year Note – (3.584) Annual, and semiannual value levels are 3.796 and 4.268 with weekly and daily risky levels at 3.529 and 3.513. The 10-Year yield tested 3.487 this morning. Annual, monthly, semiannual and monthly risky levels are 2.690, 2.562, 2.441, and 2.322.
Review of the Profile for US Equities
- The ValuEngine Valuation Warning intensified on Friday as only 31.4% of all stocks are undervalued with 68.6% of all stocks overvalued. Compare this to March 2009, 91% of all stocks were undervalued with 9% overvalued. We are just two weeks away from the anniversary of the March 5, 2009 multi-year lows as stocks continued to rise to new multi-year highs last week.
- All major equity averages ended last week with extremely overbought conditions noted on their weekly charts. The only index that’s above its 2007 high is the NASDAQ 100 (NDX) at 6.8% above its November 2007 high. The NASDAQ remains 1% below its October 2007 high.
- This week’s pivots are 12,401 Dow Industrials, 1345.0 SPX, 2831 NASDAQ, 2405.1 NDX, 414.82 Utilities, 5241 Dow Transports, and 815.37 Russell 1000 and 483.39 SOX.
- The NASDAQ is approaching my quarterly risky level at 2853.
Key Levels for the Major Equity Averages
- The Dow Industrial Average (12,391) remains extremely overbought with daily and weekly pivots at 12,350 and 12,401. The 21-day simple moving average rises to 12,114 as support with my annual risky level at 13,890.
- The S&P 500 (1343.0) remains extremely overbought with daily and weekly pivots at 1341 and 1345. The 21-day simple moving average rises to 1313 with my annual risky level at 1562.9.
- The NASDAQ (2834) remains extremely overbought with daily and weekly pivots at 2833 and 2831. The 21-day simple moving average rises to 2767 with my quarterly risky level at 2853 and annual risky level at 3243.
- The NASDAQ 100 (NDX) (2392) remains extremely overbought with daily and weekly pivots at 2403.6 and 2405.1. The 21-day simple moving average rises to 2340 with my quarterly risky level at 2438.3 and annual risky level at 2589.8.
- Dow Transports (5296)has become overbought with weekly and daily pivots at 5241 and 5387. The 21-day simple moving average rises to 5157 and annual risky level at 6131.
- The Russell 2000 (834.82) remains extremely overbought with weekly and daily pivots at 815.37 and 835.65. The 21-day simple moving average rises to 803.87 with my annual risky level at 978.58.
NASDAQ 100 Index CME (ND.1) (2395) remains overbought even with this morning’s lower open. The index traded as low as 2351.75 pre-market. The 21-day simple moving average is 2343 with this week’s pivot at 2404. My monthly value level is 2234 with quarterly risky level at 2435.
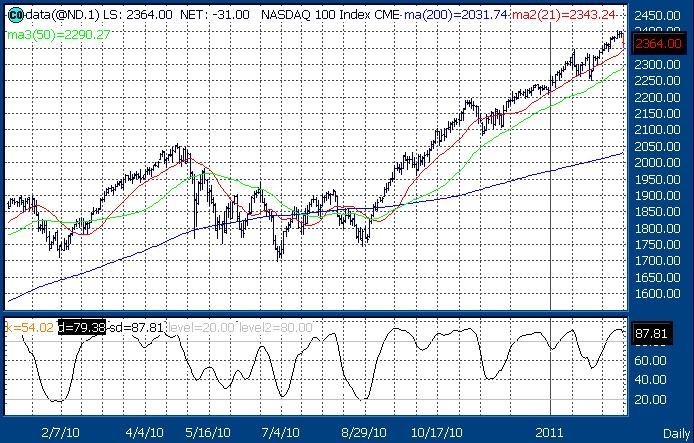
Courtesy of Thomson / Reuters
That’s today’s Four in Four. Have a great day.
Richard Suttmeier
Chief Market Strategist
Chief Market Strategist
ValuEngine.com, (800) 381-5576
Send your comments and questions to Rsuttmeier@Gmail.com. For more information on our products and services visit www.ValuEngine.com
As Chief Market Strategist at ValuEngine Inc, my research is published regularly on the website www.ValuEngine.com. I have daily, weekly, monthly, and quarterly newsletters available that track a variety of equity and other data parameters as well as my most up-to-date analysis of world markets. My newest products include a weekly ETF newsletter as well as the ValuTrader Model Portfolio newsletter. You can go HERE to review sample issues and find out more about my research.
“I Hold No Positions in the Stocks I Cover.”