Over the last few weeks, we have discussed a number of systematic fund strategies. These strategies are based on a risk factor approach and provide an investment style that stands apart but also shares elements of both active and passive approaches. What underlies these strategies is a sound economic rationale, pre-defined investment rules, and evidence of long-term outperformance of passive benchmarks.
So far, we have discussed the following strategies:
- ETF Fund Strategies, particularly momentum and value, which rotate among twenty major ETFs
- CEF Sector Momentum Strategy, which allocates to a quarter of CEF sectors in our coverage based on a momentum-strength signal
In this article, we introduce a number of strategies based on closed-end funds with a particular focus on income funds. For this reason our fund population is a subset of the entire CEF population and excludes most pure equity funds.
The obvious question here is for whom are these strategies designed? We think there are many ways to use these strategies, most of which do not require dedicated investing:
- most obviously, investors who are comfortable with "smart beta" or risk factor approaches can invest alongside these strategies
- a subset of strategy positions can be used in tactical trading as a systematic alpha overlay on top of a separate larger beta portfolio
- new individual strategy positions can be used as entry point signals for a set of funds already "on the radar" - for example, an investor who is familiar with a dozen funds and is waiting for a good entry point into those funds may use a strategy signal to initiate a position
- new specific strategy positions can be used as part of an entry into a new sector - for example an investor who wishes to initiate a long position in a new sector may look to the sector funds that the strategy is currently long
We don't expect most investors to adopt these strategies lock, stock, and barrel. However, we think it may be worthwhile to use these as potential tactical ideas or strategic entry points with the strategy itself serving as an evidence-based proof-of-concept that should give investors some comfort that probabilistically they are not on the wrong side of the trade.
Strategy CEF Space
In this article we introduce four systematic strategies, all of which beat the equally-weighted CEF fund benchmark.
These strategies are:
- Momentum - defined as the 1Y total price return, excluding the last month
- Risk Adjusted Carry - defined as past 12-month distribution rate divided by 1Y price return volatility
- Value - defined as the current distribution rate percentage over the 3Y moving average
- Discount Sector Spread Percentile (aka DSSP) - defined as the percentile of the 1Y rolling difference between the fund and sector discount, discussed in more detail here.
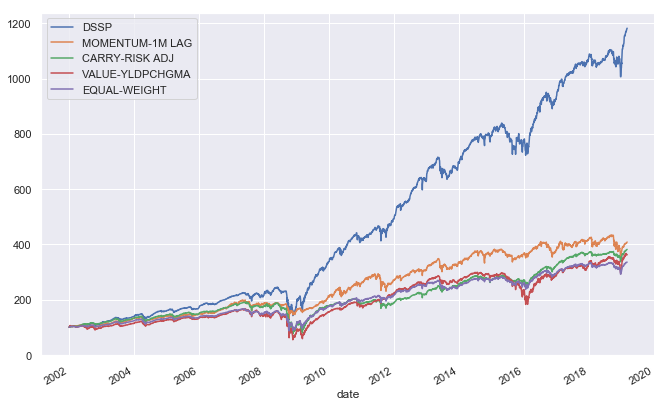
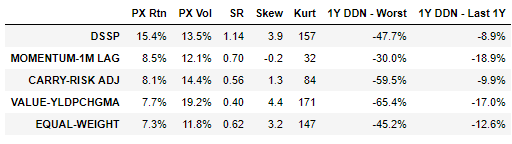
The strategy total returns are presented in the chart below. The DSSP strategy makes it a bit hard to see what else is going on, so we put annualized returns in the table below.
Source: ADS Analytics LLC, TIINGO
All four strategies outperform the benchmark on an absolute basis, and two do so on a risk-adjusted basis.
Source: ADS Analytics LLC, TIINGO
Because DSSP is far-and-away the best performing strategy, we will focus on it for the rest of the article.
Under The Hood
To check the robustness of the DSSP strategy, we run it through a number of tests.
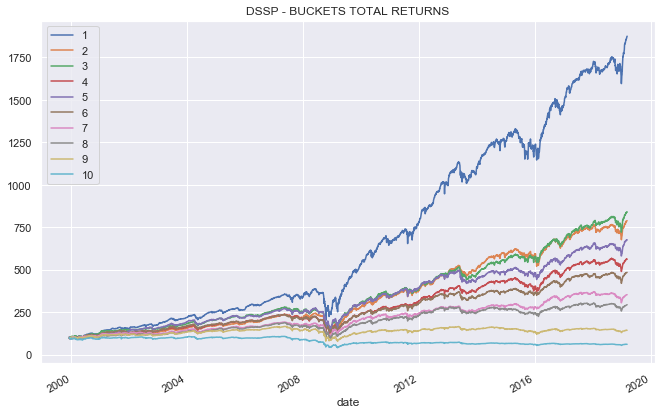
The first test is the so-called bucket consistency test. The way the strategies work is they first assign scores to each fund at the beginning of the new month. These funds are then divided into a number of buckets by score and the strategy invests in the top-scoring bucket in the new month.
What we like to see is for the buckets to have consistent returns, meaning the top bucket should have the best return, the second bucket - the second best return and so on. This is to ensure the strategy signal is actually able to discriminate among the fund population. If the bucket returns are all over the place then we know the strategy signal is not consistent and could actually be random. When we plot total returns of individual buckets, we see they are broadly in line. The first bucket has by far the best return and while buckets 2, 3 and 4, 5 are flipped, the story of the chart is that, generally speaking, the higher the bucket number the worse the return, which is what we want to see.
Source: ADS Analytics LLC, TIINGO
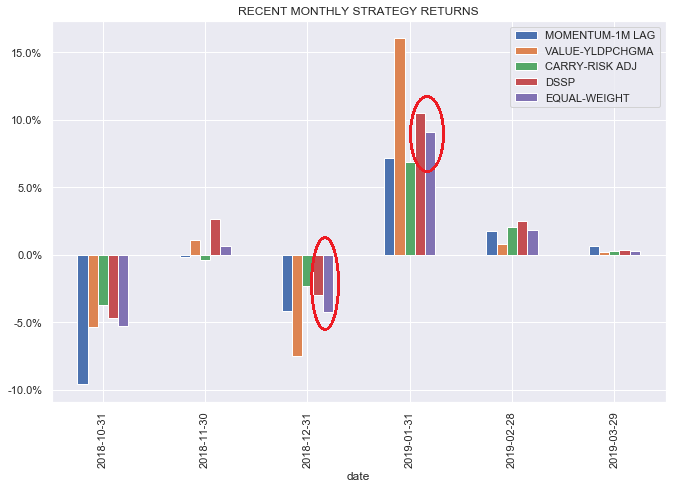
Our second test is a so-called December test where we check how the strategy did in December 2018 and the subsequent bounceback. A loss of capital is a red flag as the strategy will tend to perform badly in higher-volatility mean-reverting periods. Since the financial crisis, we have mostly experienced a steadily rising market so a strategy that does poorly in a different environment is not sufficiently robust. A quick glance at the performance of DSSP vs. the benchmark shows that the strategy outperformed the benchmark in both December and January, which is a great sign.
Source: ADS Analytics LLC, TIINGO
The final test is the excess return consistency test which is a way to gauge whether the amount of excess return the strategy is able to generate has changed. In the chart below, we plot the 1Y rolling excess return over the benchmark. Interestingly, the excess return the strategy has generated since about 2015 is smaller than over the previous ten years. While this may be something to watch, we think it is probably due to increasing efficiency of the CEF market which is not unexpected. Currently, the strategy appears to be generating close to high single digits of alpha - a still respectable figure.
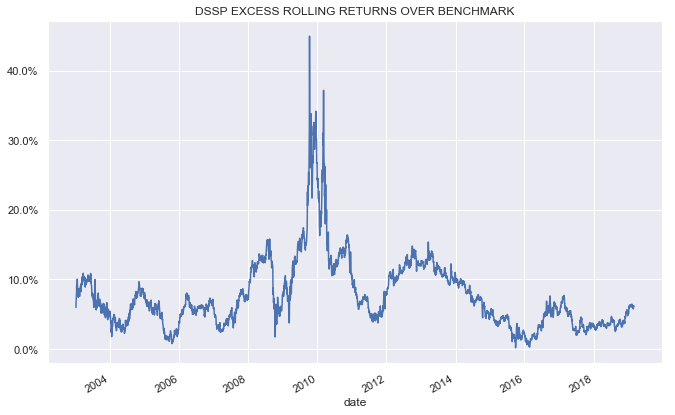
Source: ADS Analytics LLC, TIINGO
Going Forward
As we suggest above, there are multiple ways to consume the signals from these trading strategies. First and most basic, investors can trade along with the strategy positions. Secondly, investors can use the strategy positions as an initial screen within their own investment framework and finally, we tend to do several single-fund focus articles on strategy positions which investors can follow along.
As an example of the third approach we recently discussed DPG which is one of the funds the DSSP strategy is long. We enhanced the DSSP metric with a relative sector yield metric we call YSSP (yield sector spread percentile) along with a distribution stability check. This approach has the benefit of not having to analyze nearly 30 funds (the number of funds the strategy is long at any one time).
For example, below we screen for funds having the DSSP metric in the first third, YSSP in the last third and no recent distribution cuts (a recent distribution cut can be a valid reason for the DSSP metric to reset to a new level and so the signal would not be valid). We think these funds are currently at attractive entry points.
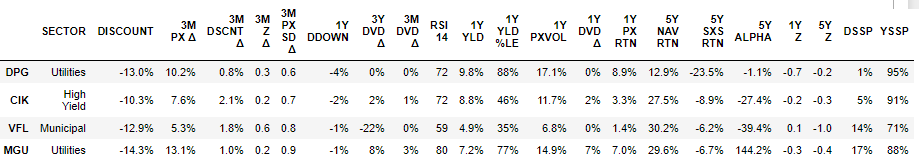
Source: ADS Analytics LLC, TIINGO
Conclusion
We think systematic trading strategies offer compelling alternatives to the more common discretionary-based investing or passive benchmarks. While we don't expect most investors to adopt these strategies wholesale, we think the strategy signals can fit well in most investors' processes as either an alpha overlay or entry/exit signals for the purpose of strategic positioning.
Thanks for reading. In the coming weeks, we plan to launch Systematic Income - our Marketplace service on this platform. In addition to detailed analytics of CEF funds and sectors, frequent tactical screens and ideas, we plan to publish and discuss regular updates and performance of our systematic strategies. We hope you can join us.