Introduction
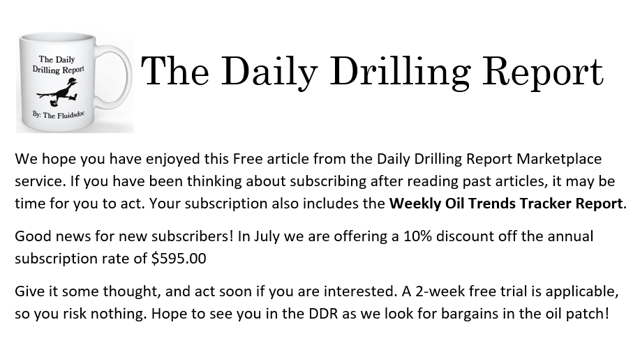
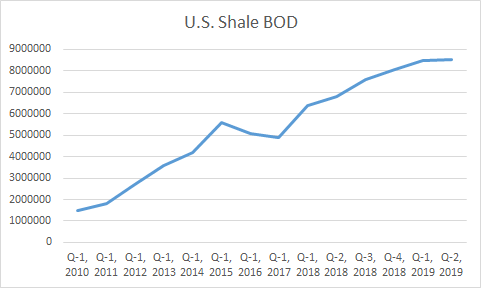
The shale growth story has been a very seductive dialogue the past 15 or so years. Who can argue with a chart like this?
You really can't. The proof is in the pudding as shale goes, and shale heretics have been made to sit in the corner with a pointy cap on their heads.
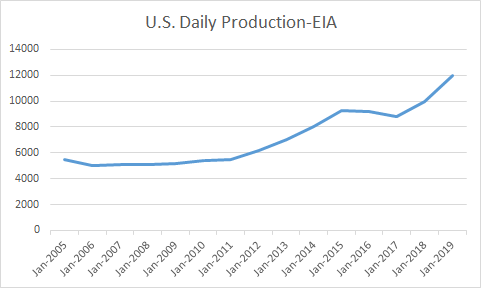
This year, for a variety of reasons, and some we will touch on in this article, domestic production and shale growth in particular have hit a wall. The latest report from EIA shows a decline that breaks the upward trend line.
EIA, chart by author
In this article we will look at a couple of key data points behind what well could be signs of shale... tapping out.
A reversal of trend for oil vs EIA oil production predictions
First, I want to briefly opine on the impact of this trend reversal for the world oil market. It is priced currently for what I would call perfection. Iran and the U.S. are still only calling each other names. China and the U.S. are making jaw-jaw once again on the topic of a trade deal. As a result, oil has sagged down about $5.00 a barrel over the first couple of days this week. All in the face of large crude storage builds in the U.S. over the past month.
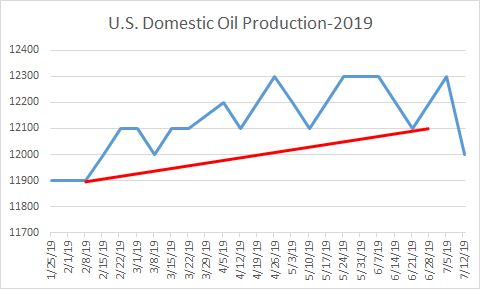
Meanwhile, the world market seems well supplied: Everyone has all the oil they need and expects to maintain that situation for the foreseeable future. Everything is rosy. The linchpin in that warm glow of market satiety is the 15%-20% year-over-year growth of U.S. production over the last decade. Every prognosticator on the planet now refers to the U.S. as the swing producer, able to fill all the pots and pans globally. The EIA is the worst of the lot. Their robust growth projections are contained in the graphic below.
STEO A nice looking graph that moves sharply upward from the lower left quadrant to the upper right quadrant, as most forecasts are prone to do.
But suppose the growth rate in U.S. shale can’t rise forever. What if the good folks over at the EIA (an arm of the federal government, which we all know is infallible) have been having their weekly brunches in California or Colorado? What if shale production actually dropped? Now, let me be clear: No one, absolutely no one, is forecasting that eventuality... yet. And that’s what worries me.
Harking back to an earlier shale demise prediction
Think I’m a worry wart? Let’s take a trip back to September of 2014 when a pundit by the name of Andrew John Hall forecast $150 oil in Business Insider, a respected publication. He wasn't alone in holding that general opinion for oil; Goldman Sachs had reached that conclusion in 2012.
But young Andrew’s predictions were historically so reliable, as regards oil prices, that he was referred to in the market as “God.” You can’t get much more authoritative than that, and reliability on a deity-like level was probably among the attributes that have led him to become CEO of Phibro, a commodities trading house.
In terms of his prediction of the demise of U.S. shale, Hall based his reasoning on the supposition that the Saudis would be successful in bringing down the shale oil juggernaut that had begun to gore their ox from a market share standpoint. In his scenario oil would then rise due to scarcity as a result of shale cratering. He believed this so passionately that he opined in a newsletter to clients thusly, as he bought oil futures contracts for their accounts:
"When you believe something, facts become inconvenient obstacles."
(If Hall is still lurking about someplace, I’ll bet he wishes he could cram that little gem back in the bottle! Note to self: never use the words “facts” and “inconvenient obstacles” in the same sentence!)
We all know what happened to oil over the next couple of years. American shale frackers proceeded to pull a hat trick. They recapitalized, cut their break-even costs by 50%, and upped production per foot of interval. Oil production from the U.S. resumed its upward march. The Saudis threw in the market-share towel by mid-2015 and closed the choke a hair on their side of the planet, with hopes of improving prices. Supply and demand then fell into a pseudo-balance over the next year, and by mid-2017 we were off on another nice ramp in the oil price.
Someone else is now CEO of Phibro. I have no inkling as to whether that fact relates to this monster missed market call. Hall may have gone back to his main job of running the universe.
But suppose Hall was right? Way early, and right for all the wrong reasons, but right nonetheless? That is the scenario we find ourselves discussing five years hence. What if shale has peaked, and is about to begin a slow decline in absolute terms? I’ll leave that thought for you to consider and provide some commentary later in this article. For now, let’s take a look at some of the indicators I’ve mentioned above.
Signs of fatigue in shale
As discussed in my recent piece on the impact crude quality may play on oil supplies, American production is starting to flatten in the 12 million-BOD range. We may even see production dip down as certain economic realities begin to grip the heretofore freewheeling shale-drilling business. Realities that include, but are not limited to:
- Well spacing and inter-well harmonics (frac hits)
- Rock quality and growing scarcity of tier 1 acreage
- Capital discipline edges out "growth at any cost"
- Takeaway capacity
EIA, Chart by author
As we move from the fourth quarter of 2018 through the second quarter of 2019 we can see there is a definite flattening of the curve. There is beginning to be a bit of a schism in the EIA's STEO domestic crude production between projections and reality. Early signs, but there nonetheless. This report projects U.S daily production approaching 13.8 million BOED by the end of 2020, an increase of about 1.6 million BOED from present levels. Even if achieved, that would represent a growth rate of 11.5%, down from 2018's pace of 17% production growth.
Worth noting: Baked into the EIA's forecast is growth from the Gulf of Mexico of 200,000 BOED in 2020. I have my doubts about this as well given the under-capitalization of this space for the last few years, but let's focus on shale, as I have promised.
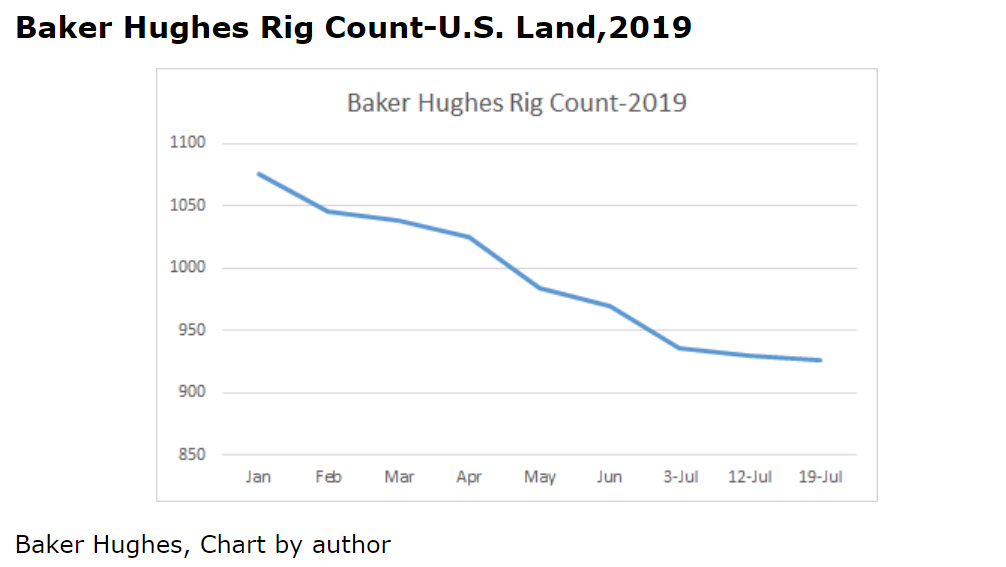
U.S. land, drilling as well are off markedly from the first of the year.
I suppose the icing on the cake would be the Schlumberger (SLB) conference call last week, where outgoing CEO Kibsgard commented thusly:
The cash flow focus amongst the E&P operators confirms our expectations of a 10% decline in North America land investments in 2019.
As an aside, that comment didn't do the service company stocks any favors, I can tell you! All of the big ones dropped 5% just as he was speaking.
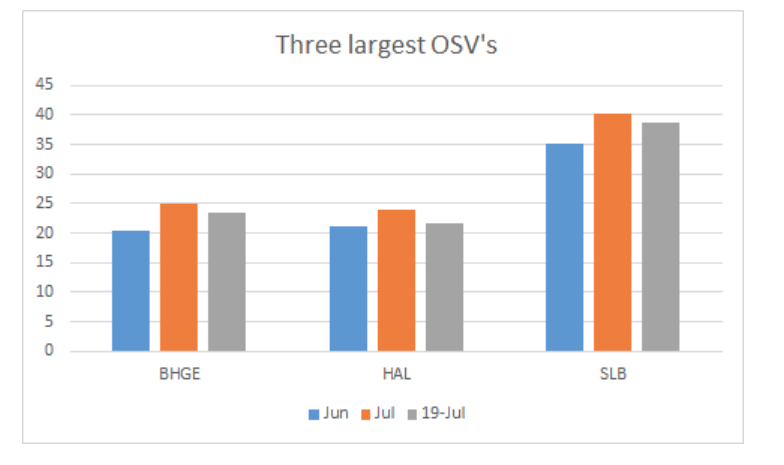
Seeking Alpha, Chart by author
So, wrapping up this section, I am going on record as saying that even if only the growth rate for shale declines, it is going to leave the world market under-supplied by a considerable amount. If shale production actually declines in real numbers, Anthony Hall’s rosy forecast of $150.00 oil is likely to become a reality in a very short period of time.
Will offshore deepwater bail us out?
The other big compartment from which the world take its oil lies in the deepwater marine environment. This area has been famously under-capitalized in recent years, as has been well documented.
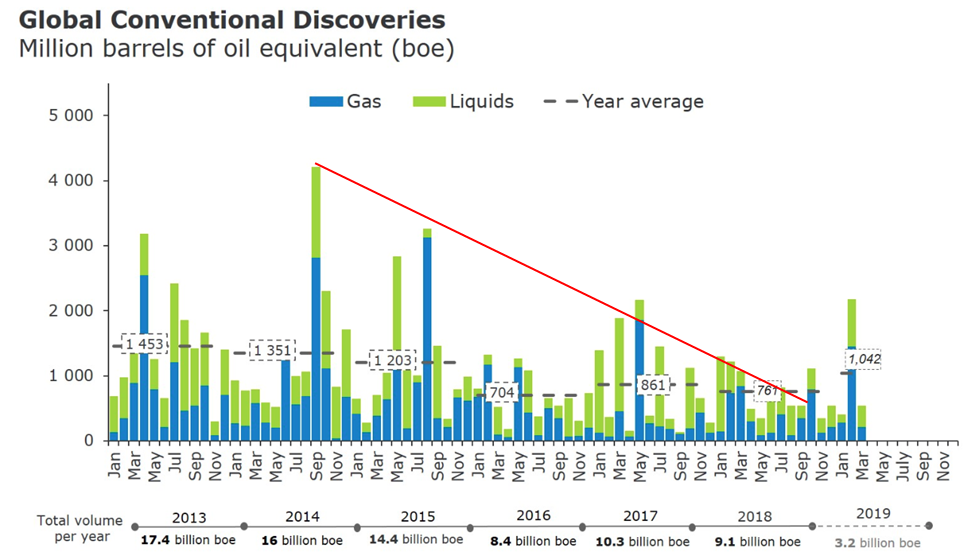
You can see from the Rystad graphic above that as capex declined, the discovery rate of conventional oil dropped from 16 billion BOE in 2014 to 9.1 billion in 2018. With only 3.2 billion bbl discoveries announced so far in 2019, the success rate will have to run pretty hard to reach 7.0 billion for the year. This would equate to a 45% decline over five years. The math isn't working very well here.
I am not ready to make a call as to the likelihood of the EIA's projections being wrong (horribly so), or not. But, I am ready to say that the trends I am seeing aren't supportive of that outcome.
Can OPEC come to the rescue?
For the last couple of years OPEC voluntarily withdrew a half a million barrels a day from the market, at first, to shore up the price. When that didn’t work, it went to a million barrels a day, and then to 1.4 million. The graph below reflects that fairly well. Saudi Arabia has taken the bulk of those cuts, but some of it is reflective of some OPEC members simply being unable to pump their quota. Here again, the data is not supportive of any ability of the cartel to fill a gap of a million barrels a day or more.
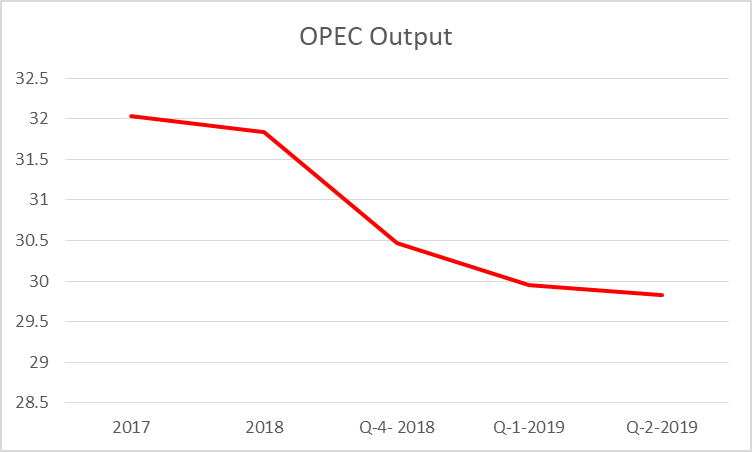
OPEC monthly report, Chart by author

The troubles of some of these countries have received a lot of press in recent times for various reasons unique to their own situations. As we all know, Venezuela, Libya, and Iran will not be ramping up much anytime soon.
Inside the cartel, that leaves Saudi to make up any shortfall. They are famous for claiming that they have several million barrels a day of excess capacity to do just that. That may indeed be true. But, in recent times rumors to the contrary have been making the rounds. Rumors that didn’t get a lot of traction as there was no way to prove for or against. Until recently during the roadshow for the ARAMCO (ARMCO) IPO.
In conjunction with the ARAMCO IPO, the proverbial camel got to stick its “nose under the tent”. Field production data of the massive Ghawar oil field was observed by third parties for the very first time. It was revealed that Ghawar has entered a sharp decline in recent years, and even secondary and tertiary recovery methods will not restore it to greatness.
So, absent a new find to replace Ghawar, the Saudis may be more talk than substance when it comes to restoring oil production.
Your takeaway
Oil stocks have a radioactive glow about them these days. If the trends I've discussed in this report bear out, they could shed that pretty quickly as oil moves up.
In the Daily Drilling Reports Oil Trends Tracker, we discussed the inventory stats put out by the EIA and several other sources. They add up to a massive draw for the coming week.
We have recommended taking proactive positions in advance of this report. Companies like Shell (RDS.A) (RDS.B), and BP (BP) are on sale as a result of recent adverse price movement in oil. The type of draw we are expecting could change that course in a hurry. Both are yielding around 6% right now, and won't stay there long.
W&T Offshore (WTI), a company we covered in a recent article, might also pop nicely. WTI is off quite a bit, and has the potential for a 50% rebound from present prices when the narrative for oil becomes less negative.
USO (USO) and several other oil ETFs are off in the 10% range, and might be a good bet as well.
We also like California Resources (CRC) as a play on heavy, non-shale oil. It has slumped way out of proportion recently due to Brent falling toward $60.00, and could be setting up for a nice rebound on news of the type I anticipate from the API and EIA.