XLU Weekly: Balance Development Continued Beneath Key Resistance

Sharedata Futures
1.47K Followers

Summary

  • Lower price discovery developed in Monday’s auction to 62.83s into early Tuesday’s trade.
  • Balance development ensued, 62.83s-63.32s, through mid-week before a failed sell-side breakdown developed to 62.61s into Thursday’s auction.
  • Buying interest emerged there, driving price higher to 63.42s into the week’s end.
  • Bullish breadth continues to trend lower from all-time highs.
  • This week’s auction saw continued balance development below key resistance, 63.47s.

In this article, we examine the significant weekly order flow and market structure developments driving XLU price action.

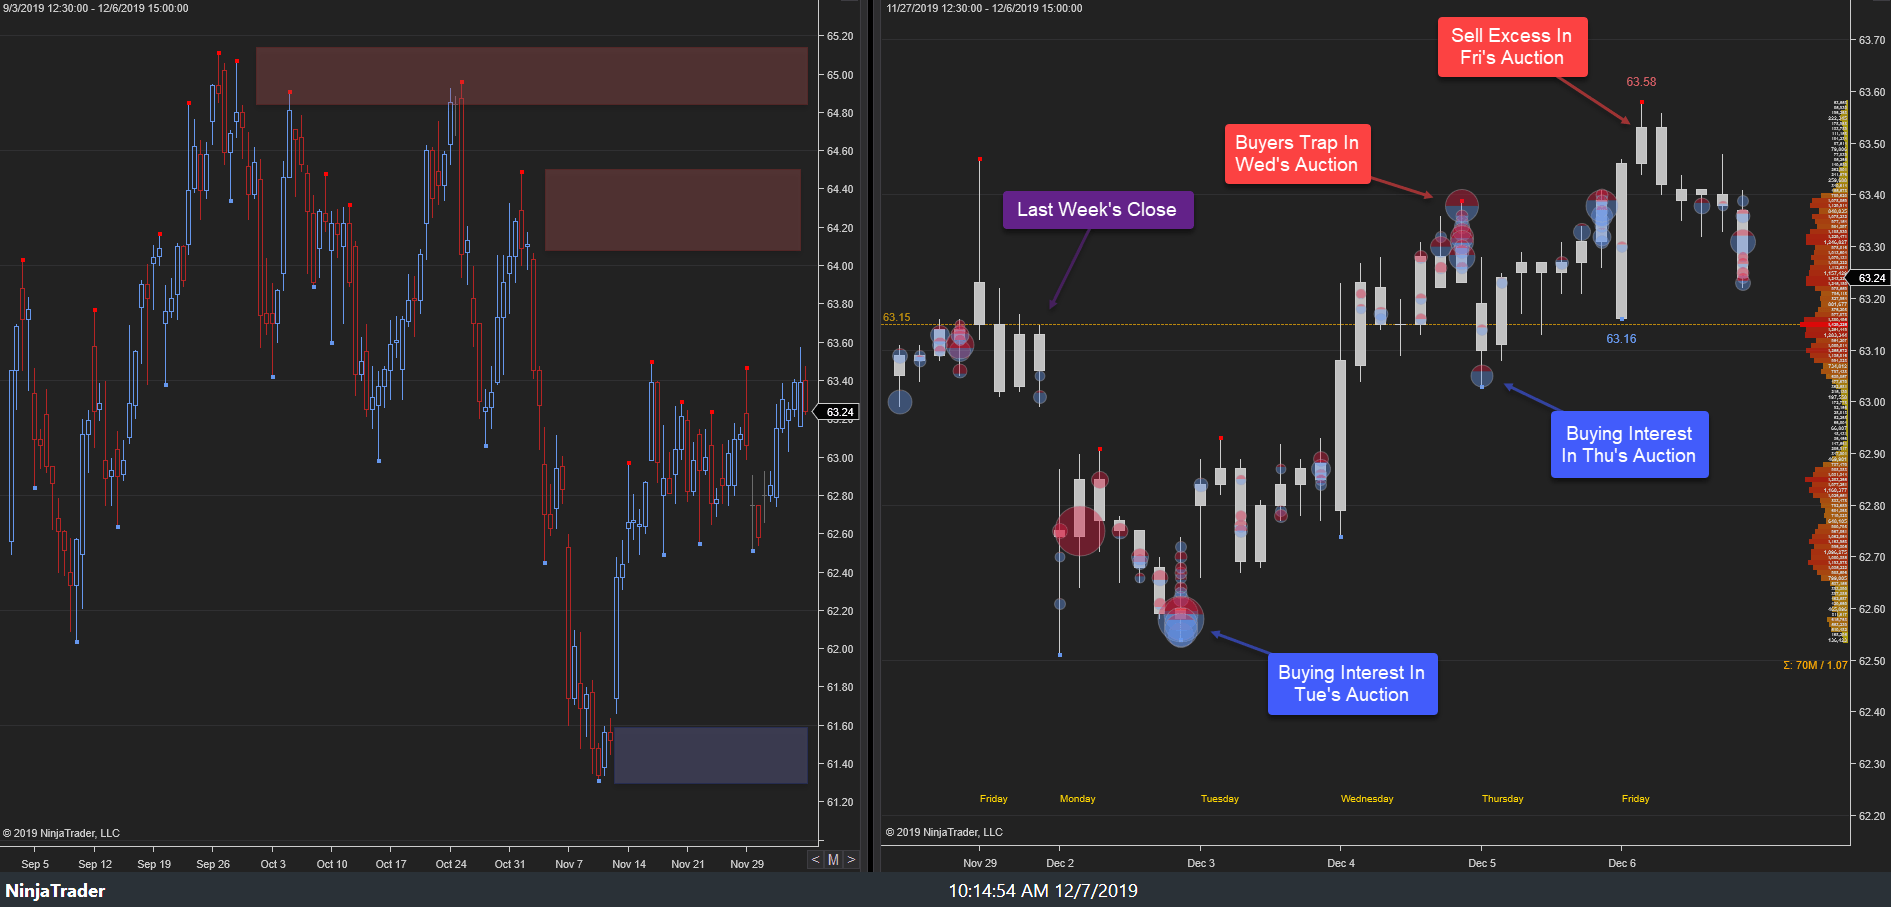
As noted in last week's XLU Weekly, the highest probability path for this week was for lower price discovery, barring failure of 63.58s as resistance. This week's primary expectation did not play out as lower price discovery developed only to 62.61s within key demand. Buying interest emerged there in Thursday's trade, driving price higher to 63.42s toward key resistance, ahead of Friday's close, settling at 63.37s.

XLU Weekly 06Dec19

09 - 13 December 2019:

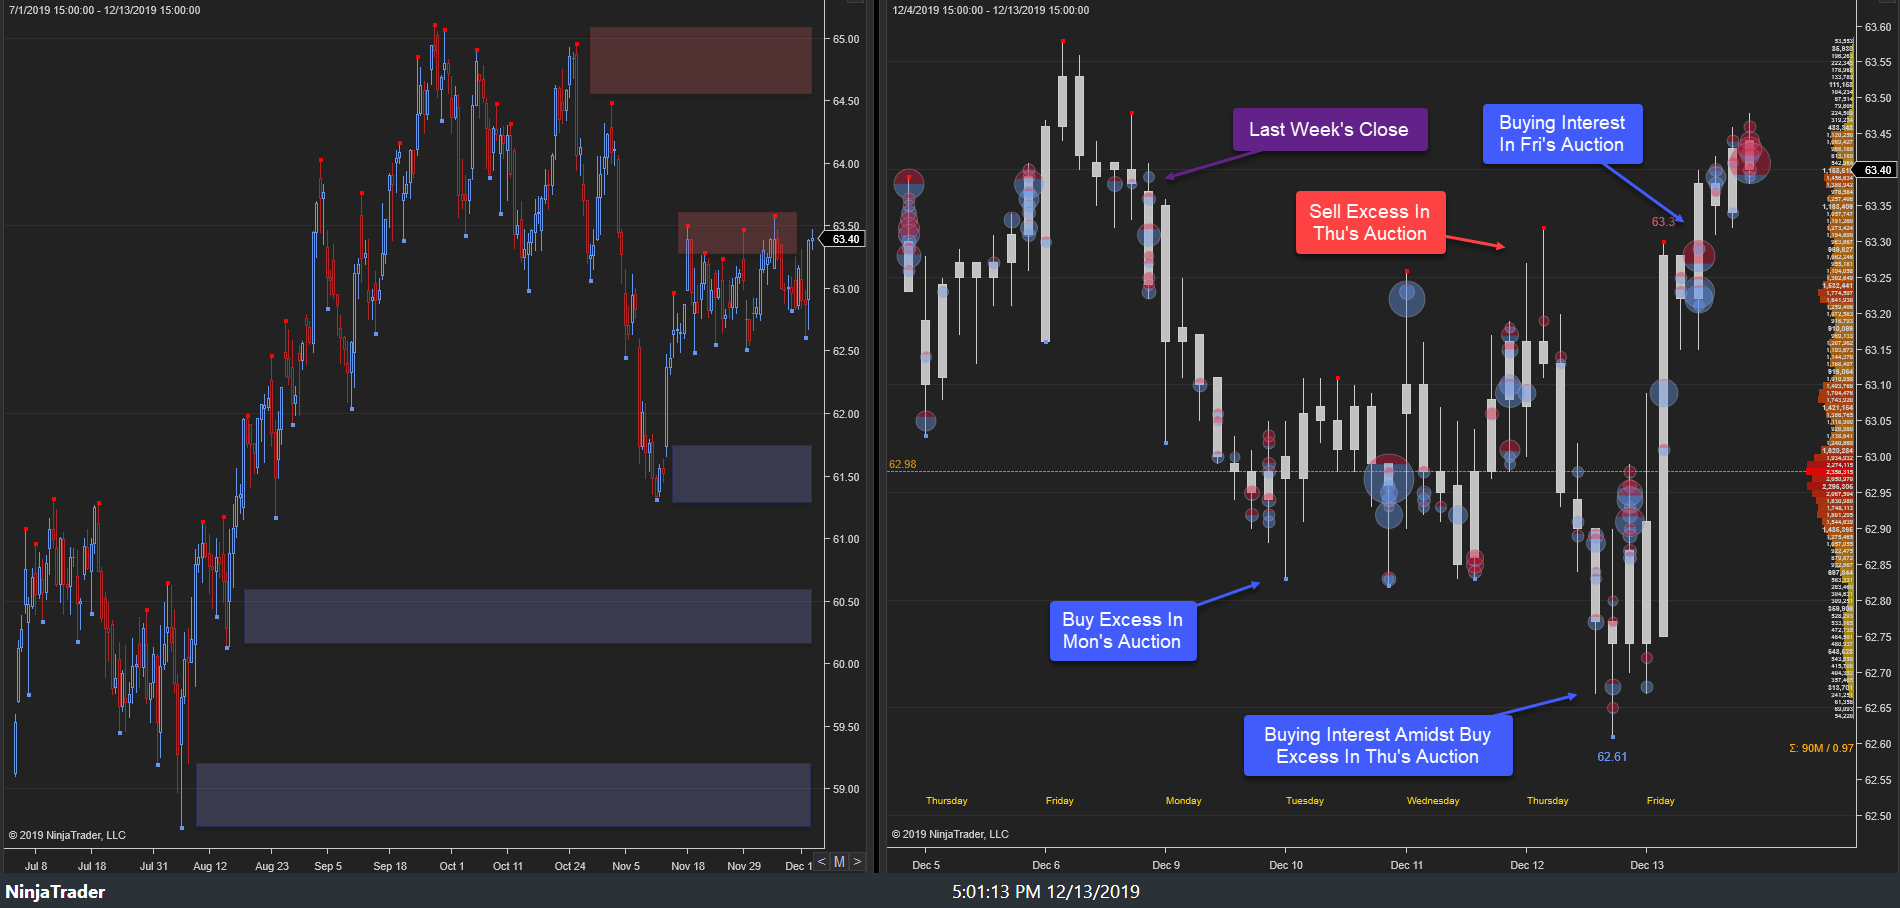
This week's auction saw lower price discovery in Monday's auction as last week's late buyers failed to hold the auction. Lower price discovery developed to 62.88s where buying interest emerged into Monday's close. A minor probe lower developed early in Tuesday's trade to 62.83s where buy excess formed, halting the sell-side sequence. Balance developed, 62.82s-63.32s, into Wednesday's auction.

A minor probe higher developed early in Thursday's auction to 63.32s, where sell excess emerged. Lower price discovery then ensued as a sell-side breakdown attempt unfolded, achieving the weekly stopping point low, 62.61s. Buying interest emerged, 62.65s/62.68s, amidst structural buy excess, halting the sell-side sequence. Higher price discovery then ensued into Friday's auction as the breakdown below 62.82s failed. Higher price discovery continued to 63.42s ahead of Friday's close, settling at 63.37s.

XLU Weekly 13Dec19

This week's auction did not see the primary expectation play out as lower price discovery to 62.61s was met with buying interest at key support. Within the larger context, this week's auction continues the back and forth between the buy-side and sell-side at the prior major structural support area, 63s.

Looking ahead, the focus into next week remains upon response to the developing multi-week balance (D-Shape distribution), 63.60s-62.48s. D-Shape distributions indicate consensus amongst buyers and sellers and forewarn of potential directional activity. Barring failure of 63.58s, the

This article was written by

1.47K Followers
Historical Data Mining & Visualization for NYMEX energy markets. Our experience derives from the proprietary trading world involved in US Index derivatives, commodity ETF derivatives, and exchange-traded NYMEX WTI derivatives.Futures trading contains substantial risk and is not for every investor. An investor could potentially lose all or more than the initial investment. Risk capital is money that can be lost without jeopardizing ones financial security or life style. Only risk capital should be used for trading and only those with sufficient risk capital should consider trading. Past performance is not necessarily indicative of future results.

Analyst’s Disclosure:I/we have no positions in any stocks mentioned, and no plans to initiate any positions within the next 72 hours. I wrote this article myself, and it expresses my own opinions. I am not receiving compensation for it (other than from Seeking Alpha). I have no business relationship with any company whose stock is mentioned in this article.

Seeking Alpha's Disclosure: Past performance is no guarantee of future results. No recommendation or advice is being given as to whether any investment is suitable for a particular investor. Any views or opinions expressed above may not reflect those of Seeking Alpha as a whole. Seeking Alpha is not a licensed securities dealer, broker or US investment adviser or investment bank. Our analysts are third party authors that include both professional investors and individual investors who may not be licensed or certified by any institute or regulatory body.

Recommended For You

About XLU ETF

SymbolLast Price% Chg
Expense Ratio
Div Frequency
Div Rate
Yield
Assets (AUM)
Compare to Peers

More on XLU

Related Stocks

SymbolLast Price% Chg
XLU
--