In this article, we examine the significant weekly order flow and market structure developments driving NYSEARCA:GDX price action.
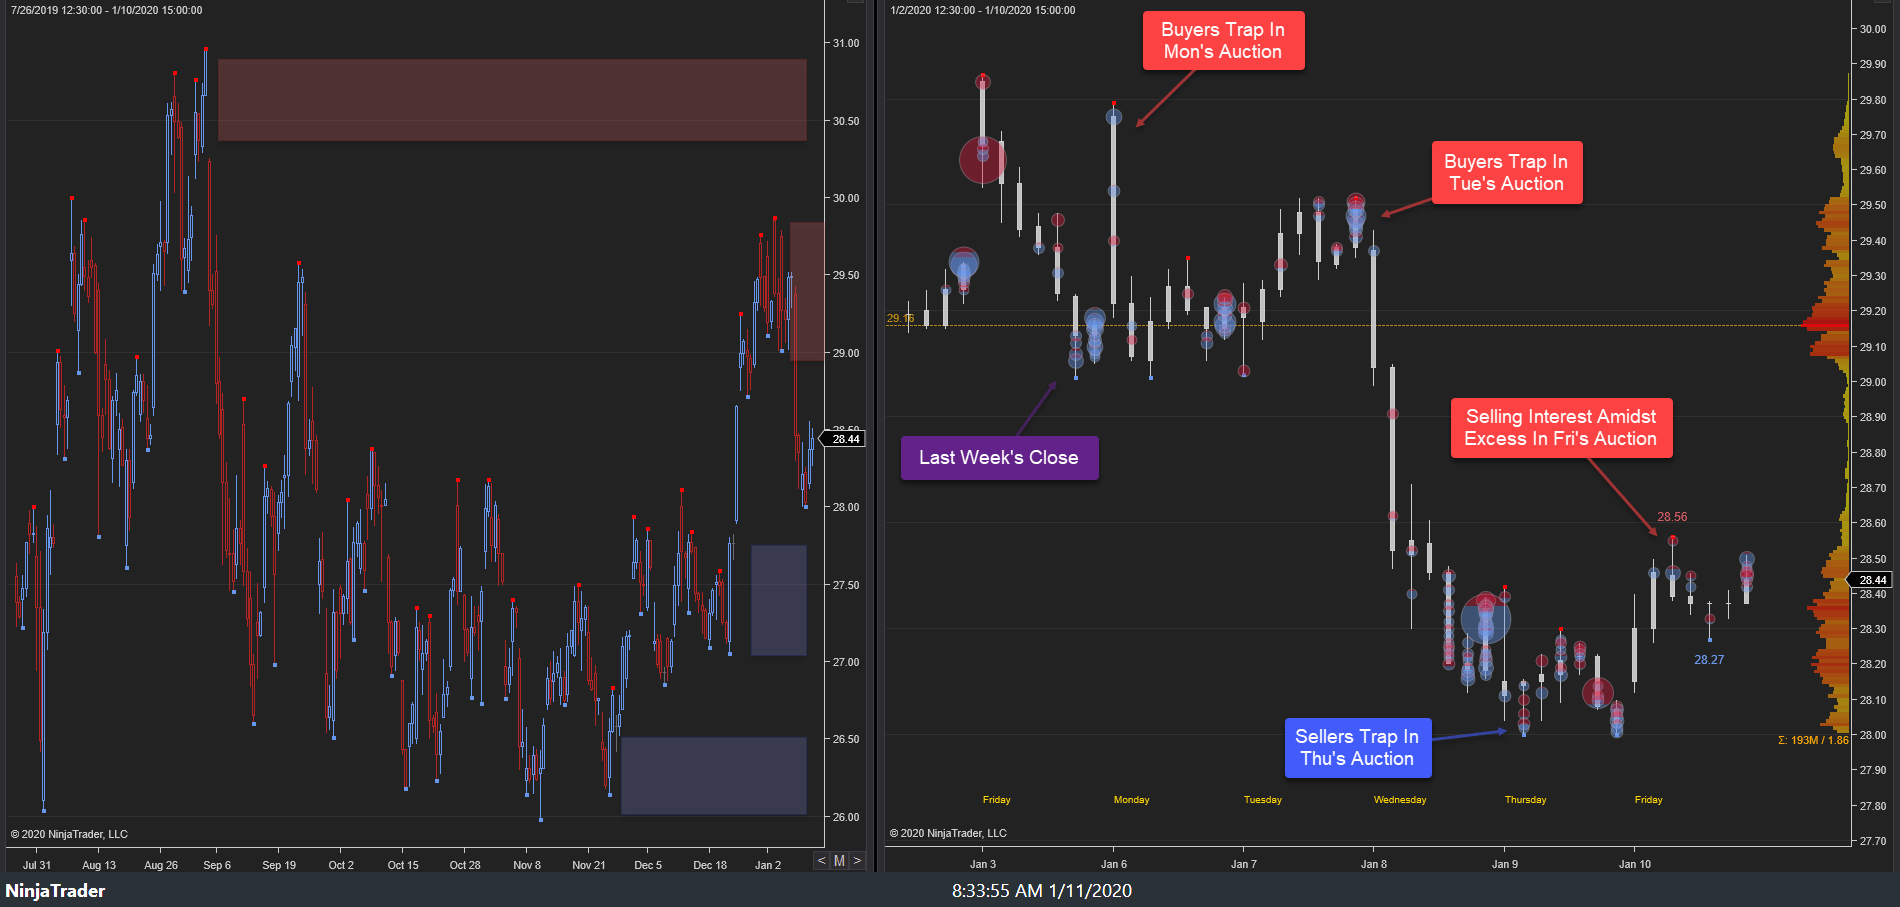
As noted in last week’s GDX Weekly, the highest probability path for this week was for price discovery lower. The primary expectation did play out, albeit marginally, as price discovery lower developed early week to 27.68s as key support was tested. Sellers trapped, driving price higher to 28.86s into Wednesday’s trade as the breakdown failed. Balance developed, 28.86s-28.30s, ahead of Friday’s close, settling at 28.42s.
13-17 January 2020:
This week’s auction saw price discovery lower early in Monday’s auction as last week’s late buyers failed to hold the auction. Price discovery lower developed through last week’s key support, 28s, in Monday’s trade, achieving a stopping point, 27.76s, as selling interest emerged, 27.89s-27.76s, into Monday’s close. A minor probe lower developed early in Tuesday’s auction, achieving the weekly stopping point low, 27.68s. Price discovery higher then ensued as Monday’s late sellers failed to hold the auction. Price discovery higher developed in Tuesday’s trade to 28.31s where buying interest emerged into Tuesday’s close.
Tuesday’s late buyers held the auction as price discovery higher continued in Wednesday’s auction, achieving the weekly stopping point high, 28.87s. Minor sell excess developed there as buying interest emerged, 28.82s-28.70s, into Wednesday’s close. Wednesday’s late buyers failed to hold the auction as price discovery lower developed into Thursday’s trade, achieving a stopping point, 28.30s. Buy excess developed as buying interest emerged, 28.37s, as balance continued ahead of Friday’s close, settling at 28.42s.
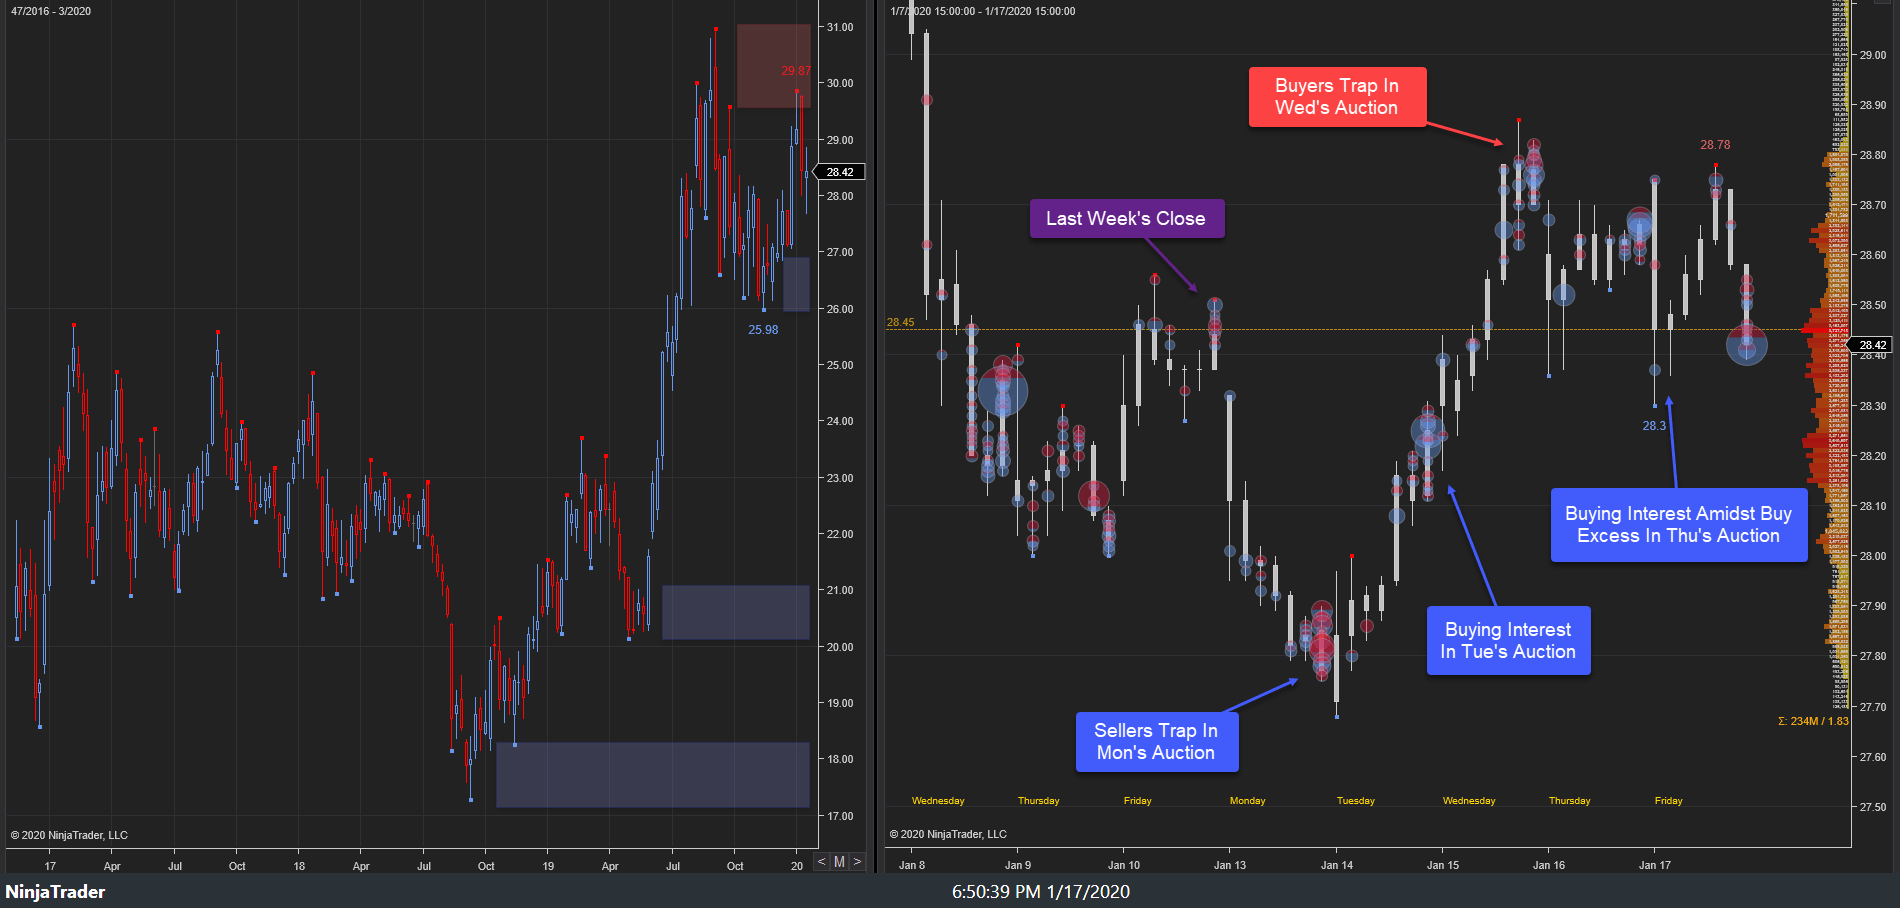
This week’s auction saw a failed sell-side breakdown below last week’s support before price discovery higher developed to 28.87s. Within the larger context, balance development continues, 31s-25.98s, following 2019’s rally.
Looking ahead, the focus into next week will center upon market response to this week’s key cluster, 28.97s-28.30s. Buy-side failure at