XLU Weekly: Rally Continued To New All-Time Highs, 68.61s

Sharedata Futures
1.47K Followers

Summary

  • Price discovery higher continued in Tuesday’s trade post-holiday to 67.95s into Thursday’s auction.
  • A failed sell excess in Thursday’s trade resulted in buy-side continuation to 68.61s into Friday’s trade, new all-time highs.
  • Bullish breadth back to all-time highs.
  • This week’s auction saw buying interest drive price higher to, 68.61s, new all-time highs.

In this article, we examine the significant weekly order flow and market structure developments driving NYSEARCA:XLU price action.

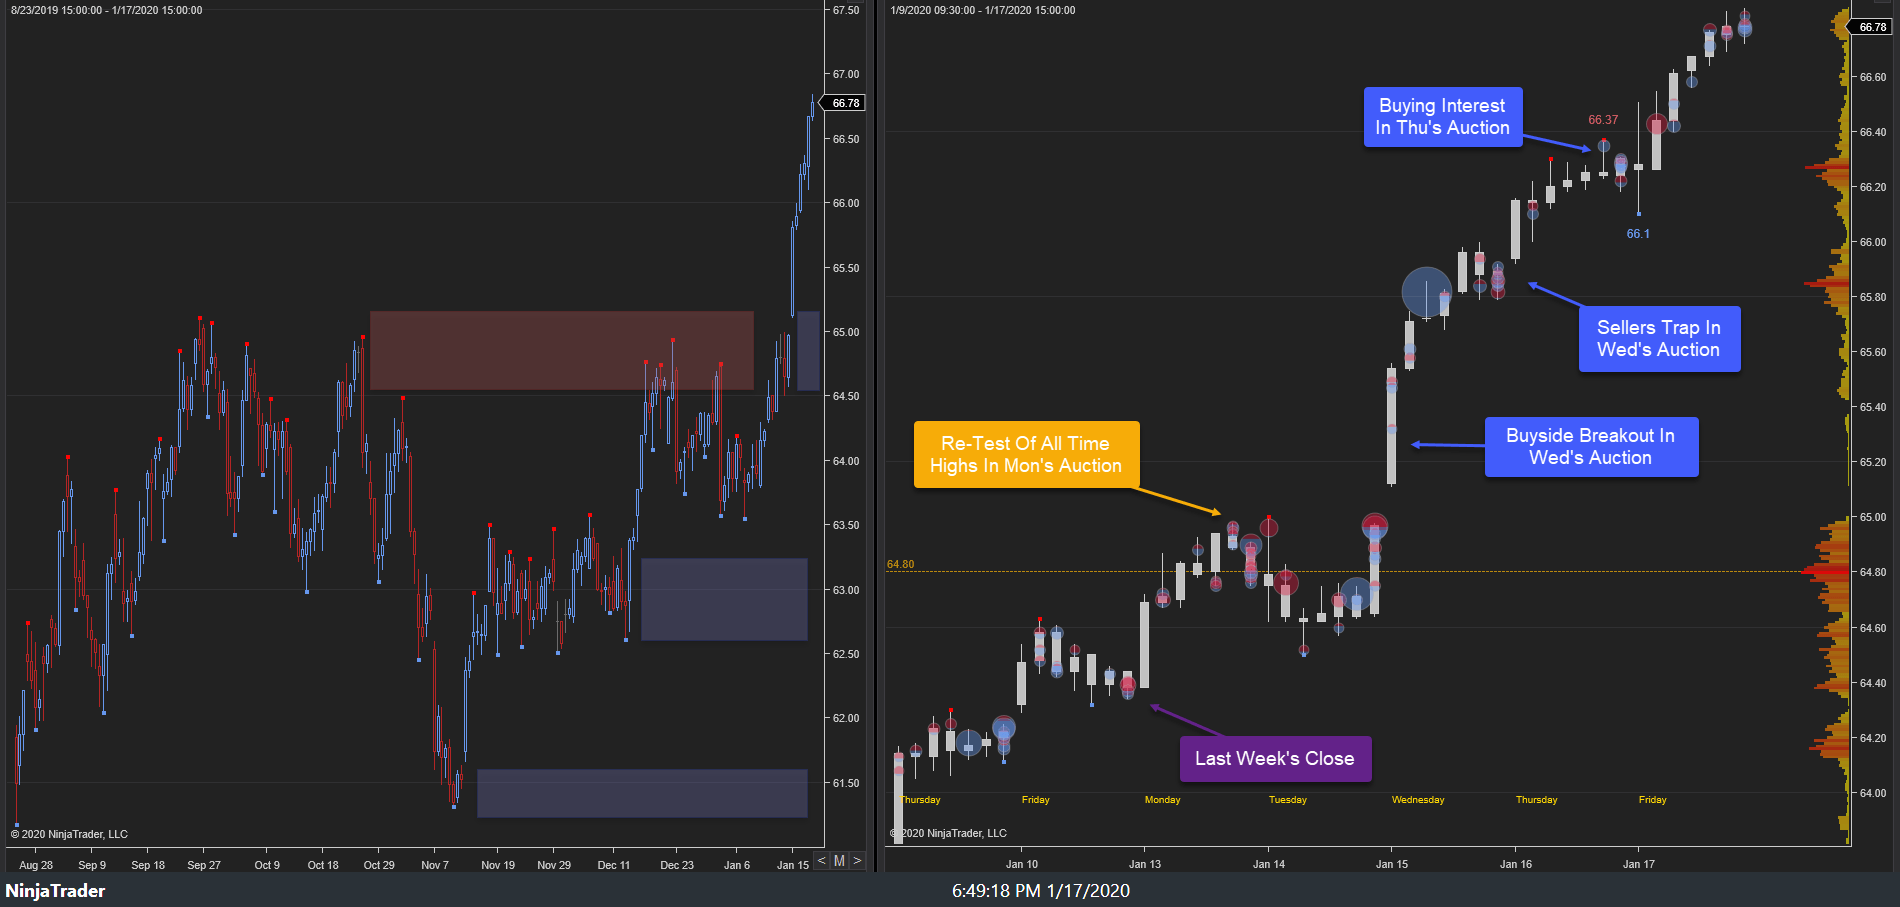
As noted in last week’s XLU Weekly, the highest probability path for this week was for price discovery higher, barring failure of 66.10s as support. This week’s primary expectation did play out as last week’s late buyers held the auction before price discovery higher developed to 68.61s ahead of Friday’s close, settling at 68.36s.

XLU Weekly 17Jan20

21-24 January 2020:

This week’s auction saw price discovery higher to 67.40s in Tuesday’s auction as last week’s late buyers held the auction. Buying interest emerged, 67.20s-63.37s, at/near all-time highs into Tuesday’s close. Tuesday’s late buyers held the auction as price discovery higher continued into Wednesday’s trade to 67.77s. Narrow balance then developed, 67.77s-67.54s, into Wednesday’s close as buying interest emerged, 67.57s.

Wednesday’s late buyers held the auction despite an attempted rejection early in Thursday’s trade. Price discovery higher continued in Thursday’s auction to 68.21s where again buying interest emerged into Thursday’s close. Thursday’s late buyers held the auction as price discovery higher continued in Friday’s trade, achieving the weekly stopping point high, 68.61s, ahead of Friday’s close, settling at 68.36s.

XLU Weekly 24Jan20

This week’s auction did see the primary expectation play out as the buy-side grind higher continued to new, all-time highs. Within the larger context, the recent buy-side breakout above prior major resistance, 65.11s, is structurally bullish.

Looking ahead, the focus into next week centers upon response to the key demand cluster, 68s-67.50s. This area is where some two-sided trade developed, and if breached could result in a liquidation of some long inventory in this linear up move from 65s. The market continues to seek resistance in a process known as price discovery. Sell-side failure at this key demand cluster would target new, all-time highs. Alternatively, buy-side failure within this key cluster would target key demand clusters

This article was written by

1.47K Followers
Historical Data Mining & Visualization for NYMEX energy markets. Our experience derives from the proprietary trading world involved in US Index derivatives, commodity ETF derivatives, and exchange-traded NYMEX WTI derivatives.Futures trading contains substantial risk and is not for every investor. An investor could potentially lose all or more than the initial investment. Risk capital is money that can be lost without jeopardizing ones financial security or life style. Only risk capital should be used for trading and only those with sufficient risk capital should consider trading. Past performance is not necessarily indicative of future results.

Analyst’s Disclosure:I/we have no positions in any stocks mentioned, and no plans to initiate any positions within the next 72 hours. I wrote this article myself, and it expresses my own opinions. I am not receiving compensation for it (other than from Seeking Alpha). I have no business relationship with any company whose stock is mentioned in this article.

Seeking Alpha's Disclosure: Past performance is no guarantee of future results. No recommendation or advice is being given as to whether any investment is suitable for a particular investor. Any views or opinions expressed above may not reflect those of Seeking Alpha as a whole. Seeking Alpha is not a licensed securities dealer, broker or US investment adviser or investment bank. Our analysts are third party authors that include both professional investors and individual investors who may not be licensed or certified by any institute or regulatory body.

Recommended For You

About XLU ETF

SymbolLast Price% Chg
Expense Ratio
Div Frequency
Div Rate
Yield
Assets (AUM)
Compare to Peers

More on XLU

Related Stocks

SymbolLast Price% Chg
XLU
--